
Mouse Integrin alpha 9 Antibody
R&D Systems | Catalog # AF3827

Scientific images may be resized, cropped, or adjusted for brightness or contrast for presentation purposes. These updates are limited to presentation and do not affect the underlying scientific interpretation of the data. Where available, additional source data may be provided upon request.
Key Product Details
Validated by
Species Reactivity
Validated:
Cited:
Applications
Validated:
Cited:
Label
Antibody Source
Product Specifications
Immunogen
Try31-Val979
Accession # NP_598482
Specificity
Clonality
Host
Isotype
Scientific Data Images for Mouse Integrin alpha 9 Antibody
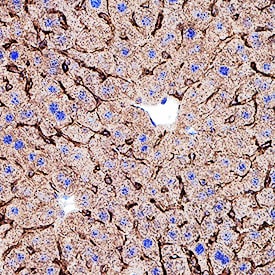
Integrin alpha 9 in Mouse Liver Tissue.
Integrin a9 was detected in perfusion fixed frozen sections of mouse liver tissue using Goat Anti-Mouse Integrin a9 Antigen Affinity-purified Polyclonal Antibody (Catalog # AF3827) at 1 µg/mL overnight at 4 °C. Before incubation with the primary antibody, tissue was subjected to heat-induced epitope retrieval using Antigen Retrieval Reagent-Basic (CTS013). Tissue was stained using the Anti-Goat IgG VisUCyte™ HRP Polymer Antibody (brown; VC004) and counterstained with hematoxylin (blue). Specific staining was localized to bile canaliculi. View our protocol for IHC Staining with VisUCyte HRP Polymer Detection Reagents.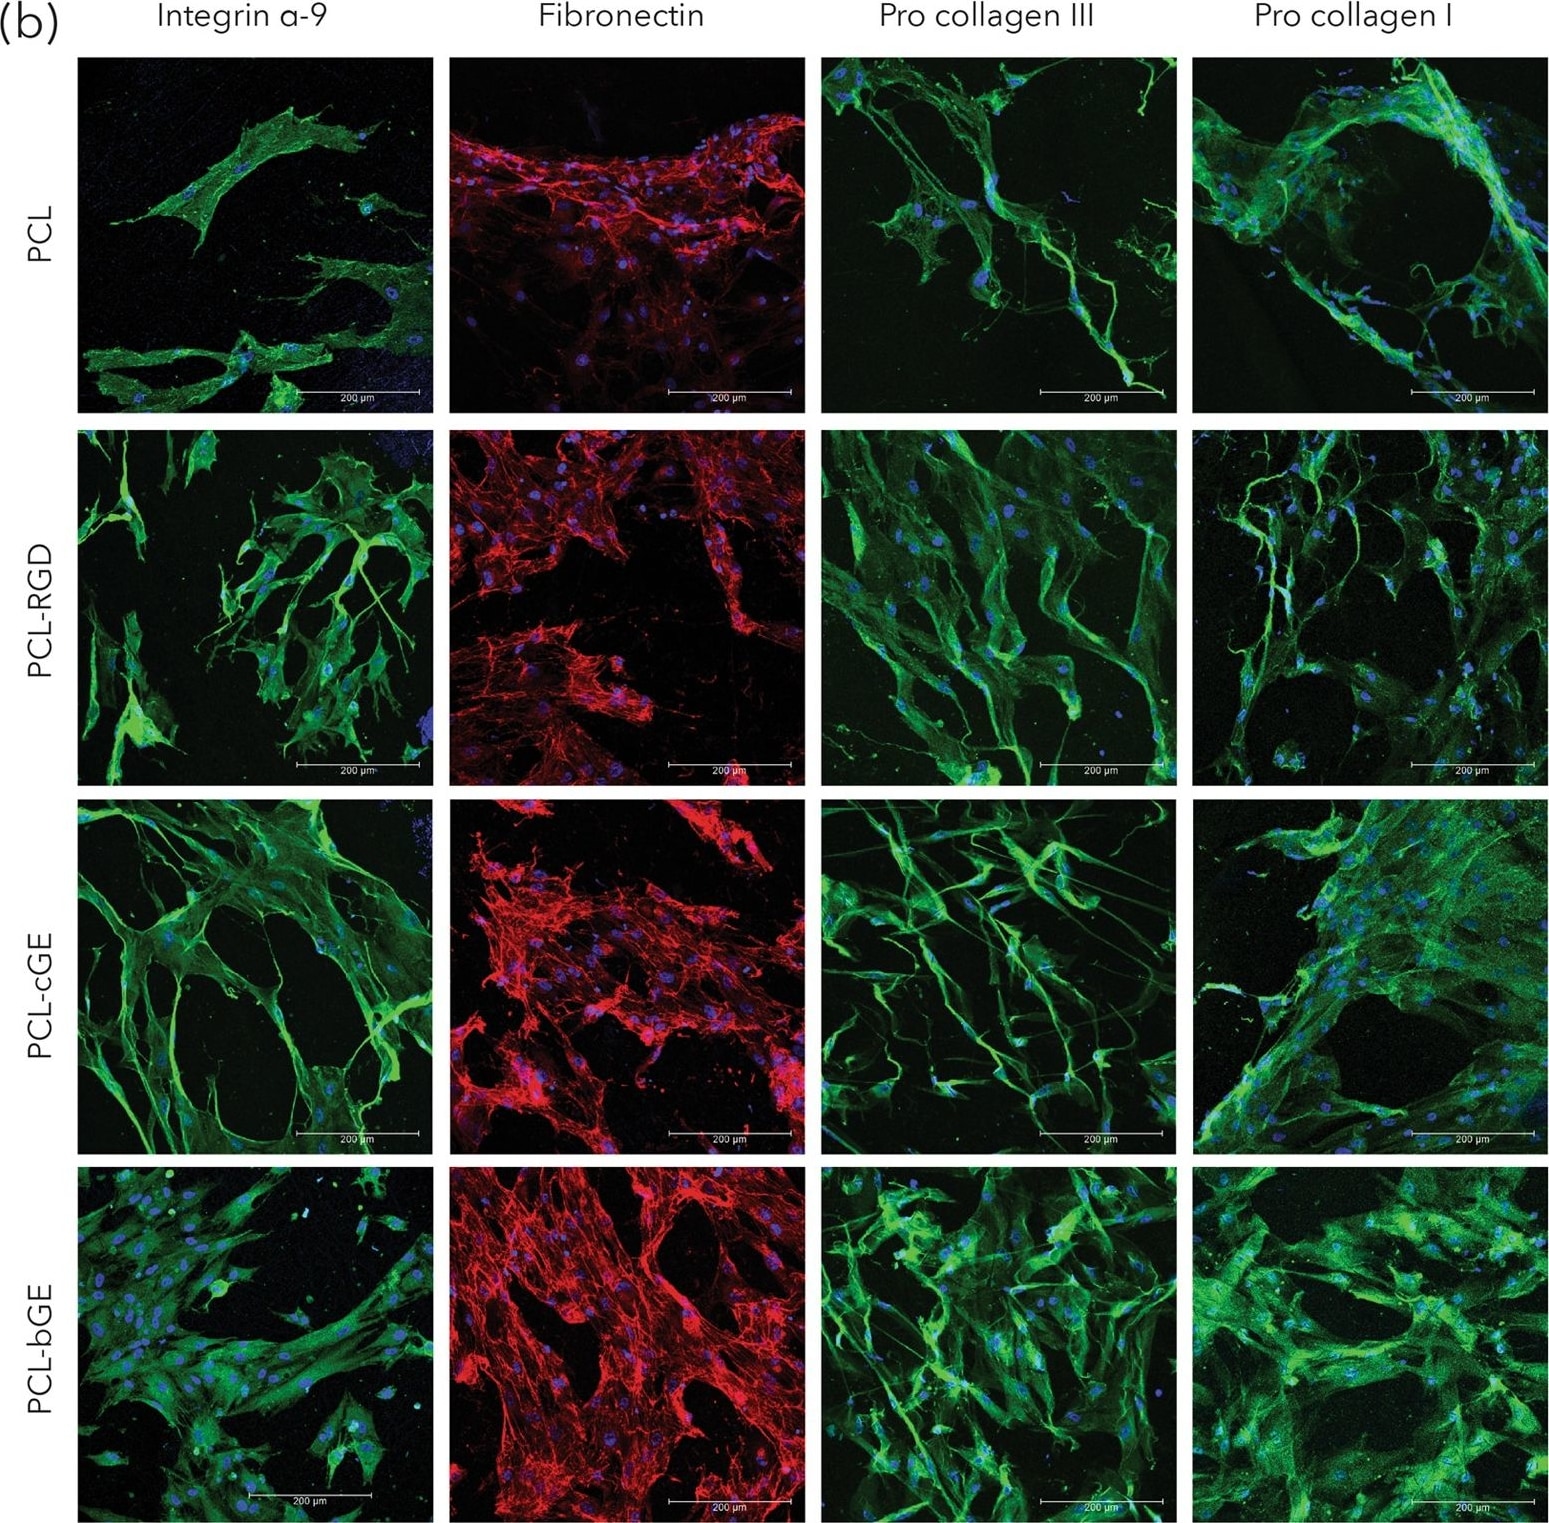
Detection of Human Integrin alpha 9 by Immunocytochemistry/Immunofluorescence
Morphology and protein expression of hSKPs. (a) SEM micrographs of nanofibrous scaffolds showing morphology of hSKPs at 7 days of culture. (b) Immunofluorescent images of hSKPs grown on nanofibrous scaffolds showing expression of integrin alpha -9 (green), fibronectin (red) and procollagen I & III (green). Image collected and cropped by CiteAb from the following publication (https://pubmed.ncbi.nlm.nih.gov/28860484), licensed under a CC-BY license. Not internally tested by R&D Systems.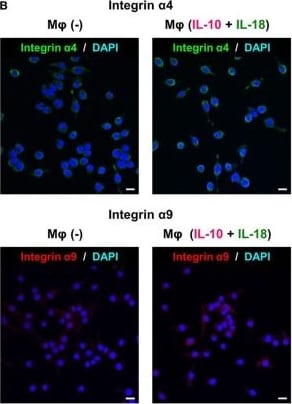
Detection of Mouse Integrin alpha 9 by Immunocytochemistry/Immunofluorescence
Intergins alpha 4/ alpha 9 are responsible for the action of osteopontin (OPN) in the augmentation of macrophage (Mφ) M2 polarization and angiogenic capacity. (A) Relative mean fluorescence intensities (MFIs) of integrins alpha 4/ alpha 9 were measured by FACS analysis in each Mφ subset. Anti-integrin alpha 4 or alpha 9 antibodies (Abs) and each isotype-matched control Ab were used at 10 µg/mL, n = 4 [***p < 0.001 vs. untreated, ###p < 0.001 vs. interleukin (IL)-10 alone]. (B) Representative confocal laser scanning immunofluorescence overlay images of integrin alpha 4 (green) and DAPI (blue), as well as those of integrin alpha 9 (red) and DAPI (blue) in Mφ (–) and Mφ (IL-10 + IL-18). Scale bar represents 20 µm. (C) Relative MFI of CD163 was measured by FACS analysis in each Mφ subset. Anti-integrin alpha 4 or alpha 9 Abs and each isotype-matched control Ab were used at 10 µg/mL, n = 4 (***p < 0.001 vs. untreated, ###p < 0.001 vs. IL-10 alone, †††p < 0.001 vs. IL-10 + IL-18). (D) The total areas and lengths of tube-like structures were determined by the Matrigel tube formation assay where b.End5 was cocultured with each Mφ subset. Anti-integrin alpha 4 or alpha 9 Abs and each isotype-matched control Ab were used at 10 µg/mL, n = 6 (***p < 0.001, **p < 0.01, *p < 0.05 vs. untreated, ###p < 0.001, ##p < 0.01, #p < 0.05 vs. IL-10 alone, †††p < 0.001 vs. IL-10 + IL-18). Integrin alpha 4 = ITGA4; Integrin alpha 9 = ITGA9. All data are expressed as means ± SEM and were analyzed by a one-way ANOVA followed by Tukey’s test. Image collected and cropped by CiteAb from the following publication (https://pubmed.ncbi.nlm.nih.gov/29559970), licensed under a CC-BY license. Not internally tested by R&D Systems.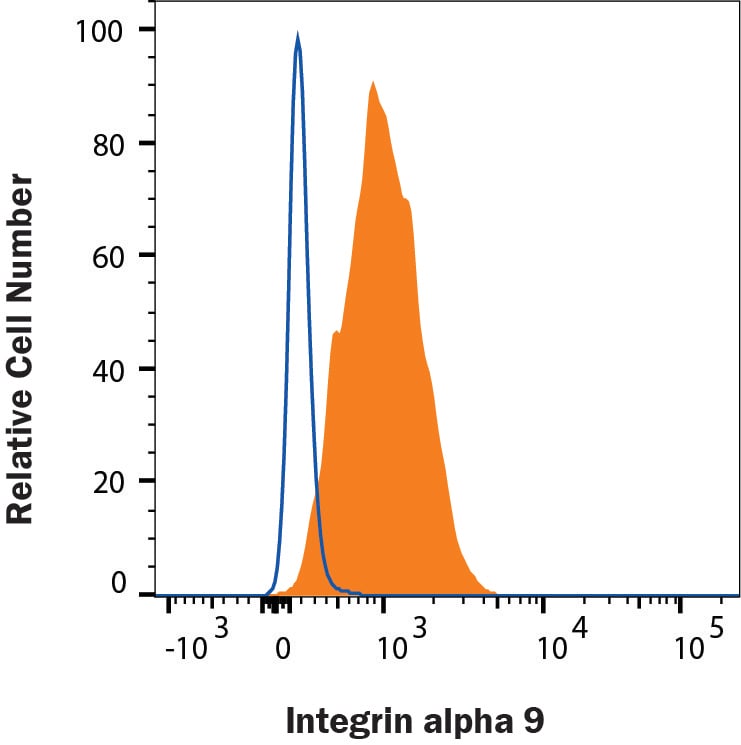
Detection of Integrin alpha 9 in AML12 Mouse Cell Line by Flow Cytometry.
AML12 mouse cell line was stained with Goat Anti-Mouse Integrin a9 Antigen Affinity-purified Polyclonal Antibody (AF3827, filled histogram) or isotype control antibody (AB-108-C, open histogram). View our protocol for Staining Membrane-associated Proteins.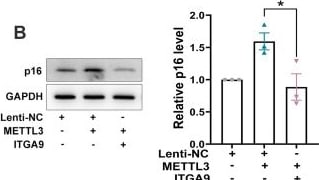
Detection of Integrin alpha 9 by Western Blot
METTL3 accelerated cellular senescence by modulating ITGA9. (A) The p16 level in MEF cells transfected with siNC, siMETTL3 or siMETTL3 and siITGA9. The quantitative results were shown on the right. Mean (±SEM), n=4, passed normality test: Shapiro-Wilk test; Paired t test (p=0.0058, t=7.062). (B) The p16 level in MEF cells infected with Lenti-NC, METTL3 or METTL3 and ITGA9. The quantitative results were shown on the right. Mean (±SEM), n=3, passed normality test: Shapiro-Wilk test; Paired t test (p=0.017, t=7.563). (C, D) Representative photographs of SA-beta -gal staining (C) and BrdU incorporation staining (D) of MEF cells transfected with siNC, siMETTL3, siITGA9, or siMETTL3 and siITGA9. The quantitative results were shown on the right. Mean (±SEM), passed normality test: Shapiro-Wilk test; Paired t test (C), n=3, p=0.0044, t=15.02; (D), n=4, p=0.0003, t=19.14). (E, F) Representative photographs of SA-beta -gal staining (E) and BrdU incorporation staining (F) of MEF cells infected with Lenti-NC, METTL3, ITGA9 or METTL3 and ITGA9. The quantitative results were shown on the right. Mean (±SEM), n=3, passed normality test: Shapiro-Wilk test; Paired t test ((E): p=0.0095, t=10.18; (F): p=0.0231, t=6.469). Image collected and cropped by CiteAb from the following open publication (https://pubmed.ncbi.nlm.nih.gov/40153583), licensed under a CC-BY license. Not internally tested by R&D Systems.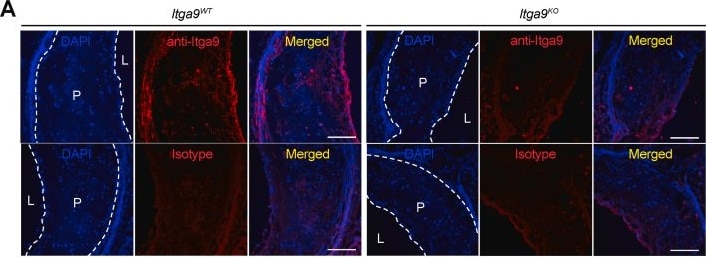
Detection of Integrin alpha 9 by Immunohistochemistry
Itga9 expression in aortic root and plasma lipids during HFD feeding.Itga9WT and Itga9KO mice were gavaged with 100 μL of 20 mg ml−1 of tamoxifen at 6 weeks of age for 5 consecutive days. Hypercholesterolemia was induced by i.v. injection of AAV8-PCSK9 at 8 weeks of age, followed by HFD feeding for 16 weeks. (A) Representative images of Itga9 immunofluorescence (red) in plaque burden of aortic root from Itga9WT (left panel) and Itga9KO mice (right panel) to validate Itga9 depletion. In lower panels for both genotypes, isotype control staining using goat IgG was performed to check antibody specificity. Nuclei were counterstained with DAPI (blue). (B) Immunoblots of Itga9 in tissues including heart, liver, and lung isolated from Itga9WT and Itga9KO mice to validate Itga9 depletion. Tubulin was used as loading control. The uncropped versions of these blots are provided in Supplementary Fig. 1. (C) Weekly body weight of Itga9WT and Itga9KO mice over the HFD feeding period. (D) Total cholesterol (at 0, 2, 8, and 16 weeks) over the HFD feeding. n = 17 for Itga9WT and n = 11 for Itga9KO in (C), n = 18 for Itga9WT and n = 12 for Itga9KO in (D). Data are shown as mean ± SD and analyzed with two-way ANOVA with repeated measures (C and D). NS, not significant. Scale bars, 100 μm. L, lumen; P, plaque. Image collected and cropped by CiteAb from the following open publication (https://linkinghub.elsevier.com/retrieve/pii/S2405844024017912), licensed under a CC-BY license. Not internally tested by R&D Systems.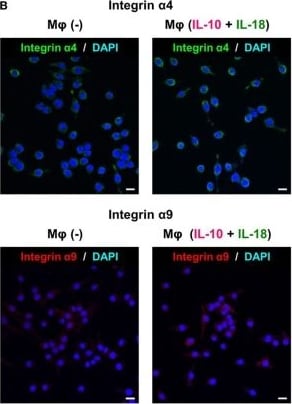
Detection of Integrin alpha 9 by Immunocytochemistry/ Immunofluorescence
Intergins alpha 4/ alpha 9 are responsible for the action of osteopontin (OPN) in the augmentation of macrophage (Mφ) M2 polarization and angiogenic capacity. (A) Relative mean fluorescence intensities (MFIs) of integrins alpha 4/ alpha 9 were measured by FACS analysis in each Mφ subset. Anti-integrin alpha 4 or alpha 9 antibodies (Abs) and each isotype-matched control Ab were used at 10 µg/mL, n = 4 [***p < 0.001 vs. untreated, ###p < 0.001 vs. interleukin (IL)-10 alone]. (B) Representative confocal laser scanning immunofluorescence overlay images of integrin alpha 4 (green) and DAPI (blue), as well as those of integrin alpha 9 (red) and DAPI (blue) in Mφ (–) and Mφ (IL-10 + IL-18). Scale bar represents 20 µm. (C) Relative MFI of CD163 was measured by FACS analysis in each Mφ subset. Anti-integrin alpha 4 or alpha 9 Abs and each isotype-matched control Ab were used at 10 µg/mL, n = 4 (***p < 0.001 vs. untreated, ###p < 0.001 vs. IL-10 alone, †††p < 0.001 vs. IL-10 + IL-18). (D) The total areas and lengths of tube-like structures were determined by the Matrigel tube formation assay where b.End5 was cocultured with each Mφ subset. Anti-integrin alpha 4 or alpha 9 Abs and each isotype-matched control Ab were used at 10 µg/mL, n = 6 (***p < 0.001, **p < 0.01, *p < 0.05 vs. untreated, ###p < 0.001, ##p < 0.01, #p < 0.05 vs. IL-10 alone, †††p < 0.001 vs. IL-10 + IL-18). Integrin alpha 4 = ITGA4; Integrin alpha 9 = ITGA9. All data are expressed as means ± SEM and were analyzed by a one-way ANOVA followed by Tukey’s test. Image collected and cropped by CiteAb from the following open publication (http://journal.frontiersin.org/article/10.3389/fimmu.2018.00334/full), licensed under a CC-BY license. Not internally tested by R&D Systems.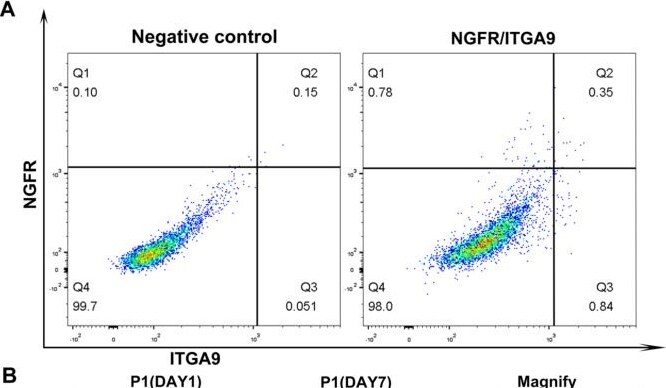
Detection of Integrin alpha 9 by Flow Cytometry
Isolation and proliferation of ITGA9 and NGFR cells in vitro. (A) ITGA9+/NGFR + and ITGA9-/NGFR + cells were isolated by FACS from adult human testes. (B) ITGA9+/NGFR + and ITGA9-/NGFR + cells were cultured and proliferation in vitro. Different cell morphologies can be seen. The scale bar represents 20 μm. Image collected and cropped by CiteAb from the following open publication (https://pubmed.ncbi.nlm.nih.gov/40450328), licensed under a CC-BY license. Not internally tested by R&D Systems.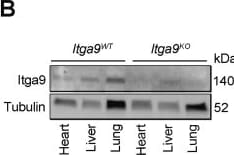
Detection of Integrin alpha 9 by Western Blot
Itga9 expression in aortic root and plasma lipids during HFD feeding.Itga9WT and Itga9KO mice were gavaged with 100 μL of 20 mg ml−1 of tamoxifen at 6 weeks of age for 5 consecutive days. Hypercholesterolemia was induced by i.v. injection of AAV8-PCSK9 at 8 weeks of age, followed by HFD feeding for 16 weeks. (A) Representative images of Itga9 immunofluorescence (red) in plaque burden of aortic root from Itga9WT (left panel) and Itga9KO mice (right panel) to validate Itga9 depletion. In lower panels for both genotypes, isotype control staining using goat IgG was performed to check antibody specificity. Nuclei were counterstained with DAPI (blue). (B) Immunoblots of Itga9 in tissues including heart, liver, and lung isolated from Itga9WT and Itga9KO mice to validate Itga9 depletion. Tubulin was used as loading control. The uncropped versions of these blots are provided in Supplementary Fig. 1. (C) Weekly body weight of Itga9WT and Itga9KO mice over the HFD feeding period. (D) Total cholesterol (at 0, 2, 8, and 16 weeks) over the HFD feeding. n = 17 for Itga9WT and n = 11 for Itga9KO in (C), n = 18 for Itga9WT and n = 12 for Itga9KO in (D). Data are shown as mean ± SD and analyzed with two-way ANOVA with repeated measures (C and D). NS, not significant. Scale bars, 100 μm. L, lumen; P, plaque. Image collected and cropped by CiteAb from the following open publication (https://linkinghub.elsevier.com/retrieve/pii/S2405844024017912), licensed under a CC-BY license. Not internally tested by R&D Systems.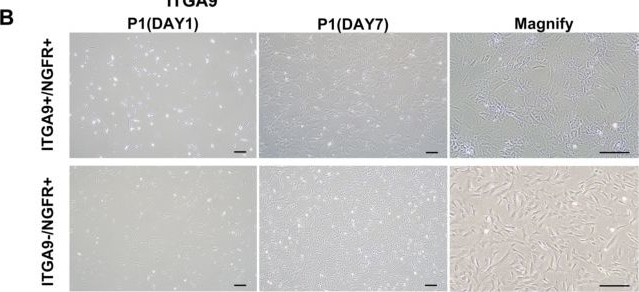
Detection of Integrin alpha 9 by Immunohistochemistry
Isolation and proliferation of ITGA9 and NGFR cells in vitro. (A) ITGA9+/NGFR + and ITGA9-/NGFR + cells were isolated by FACS from adult human testes. (B) ITGA9+/NGFR + and ITGA9-/NGFR + cells were cultured and proliferation in vitro. Different cell morphologies can be seen. The scale bar represents 20 μm. Image collected and cropped by CiteAb from the following open publication (https://pubmed.ncbi.nlm.nih.gov/40450328), licensed under a CC-BY license. Not internally tested by R&D Systems.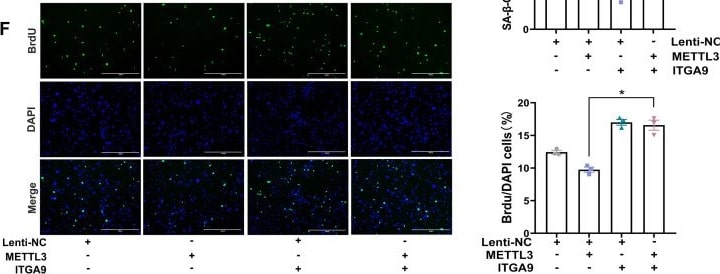
Detection of Integrin alpha 9 by Immunocytochemistry/ Immunofluorescence
METTL3 accelerated cellular senescence by modulating ITGA9. (A) The p16 level in MEF cells transfected with siNC, siMETTL3 or siMETTL3 and siITGA9. The quantitative results were shown on the right. Mean (±SEM), n=4, passed normality test: Shapiro-Wilk test; Paired t test (p=0.0058, t=7.062). (B) The p16 level in MEF cells infected with Lenti-NC, METTL3 or METTL3 and ITGA9. The quantitative results were shown on the right. Mean (±SEM), n=3, passed normality test: Shapiro-Wilk test; Paired t test (p=0.017, t=7.563). (C, D) Representative photographs of SA-beta -gal staining (C) and BrdU incorporation staining (D) of MEF cells transfected with siNC, siMETTL3, siITGA9, or siMETTL3 and siITGA9. The quantitative results were shown on the right. Mean (±SEM), passed normality test: Shapiro-Wilk test; Paired t test (C), n=3, p=0.0044, t=15.02; (D), n=4, p=0.0003, t=19.14). (E, F) Representative photographs of SA-beta -gal staining (E) and BrdU incorporation staining (F) of MEF cells infected with Lenti-NC, METTL3, ITGA9 or METTL3 and ITGA9. The quantitative results were shown on the right. Mean (±SEM), n=3, passed normality test: Shapiro-Wilk test; Paired t test ((E): p=0.0095, t=10.18; (F): p=0.0231, t=6.469). Image collected and cropped by CiteAb from the following open publication (https://pubmed.ncbi.nlm.nih.gov/40153583), licensed under a CC-BY license. Not internally tested by R&D Systems.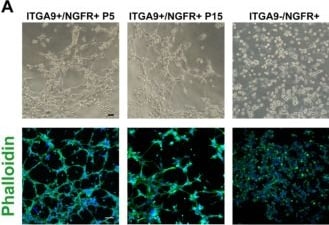
Detection of Integrin alpha 9 by Immunocytochemistry/ Immunofluorescence
Characterisations of ITGA9+/NGFR + cells in vitro (A) Representative phase-contrast micrograph of cells shows the difference of tube-forming ability. Immunofluorescence staining of phalloidin show the cytoskeleton of ITGA9+/NGFR + and ITGA9-/NGFR + cells. (B) Comparison of the capillary length and branch points between ITGA9+/NGFR + and ITGA9-/NGFR + cells. ***P < 0.001. (C) ITGA9+/NGFR + and ITGA9-/NGFR + cells in 3D microwell culture system. (D) Immunofluorescence staining of PTM-specific marker SMA show significant difference of cell spheroids index between ITGA9+/NGFR + and ITGA9-/NGFR + cells (E). ***P < 0.001. The scale bar represents 20 μm. Image collected and cropped by CiteAb from the following open publication (https://pubmed.ncbi.nlm.nih.gov/40450328), licensed under a CC-BY license. Not internally tested by R&D Systems.Applications for Mouse Integrin alpha 9 Antibody
CyTOF-ready
Flow Cytometry
Sample: AML12 mouse cell line
Immunohistochemistry
Sample: Perfusion fixed frozen sections of mouse liver
Western Blot
Sample: Recombinant Mouse Integrin alpha 9
Flow Cytometry Panel Builder
Bio-Techne Knows Flow Cytometry
Save time and reduce costly mistakes by quickly finding compatible reagents using the Panel Builder Tool.
Advanced Features
- Spectra Viewer - Custom analysis of spectra from multiple fluorochromes
- Spillover Popups - Visualize the spectra of individual fluorochromes
- Antigen Density Selector - Match fluorochrome brightness with antigen density

Formulation, Preparation, and Storage
Purification
Reconstitution
Reconstitute at 0.2 mg/mL in sterile PBS. For liquid material, refer to CoA for concentration.
Formulation
Shipping
Stability & Storage
- 12 months from date of receipt, -20 to -70 °C as supplied.
- 1 month, 2 to 8 °C under sterile conditions after reconstitution.
- 6 months, -20 to -70 °C under sterile conditions after reconstitution.
Calculators
Background: Integrin alpha 9
Alternate Names
Gene Symbol
UniProt
Additional Integrin alpha 9 Products
Product Documents for Mouse Integrin alpha 9 Antibody
Certificate of Analysis
To download a Certificate of Analysis, please enter a lot or batch number in the search box below.
Note: Certificate of Analysis not available for kit components.
Product Specific Notices for Mouse Integrin alpha 9 Antibody
For research use only
Related Research Areas
Citations for Mouse Integrin alpha 9 Antibody
 Powered by Bioz
Customer Reviews for Mouse Integrin alpha 9 Antibody
There are currently no reviews for this product. Be the first to review Mouse Integrin alpha 9 Antibody and earn rewards!
Have you used Mouse Integrin alpha 9 Antibody?
Submit a review and receive an Amazon gift card!
$25/€18/£15/$25CAN/¥2500 for a review with an image
$10/€7/£6/$10CAN/¥1110 for a review without an image
Submit a review
Protocols
Find general support by application which include: protocols, troubleshooting, illustrated assays, videos and webinars.
- 7-Amino Actinomycin D (7-AAD) Cell Viability Flow Cytometry Protocol
- Antigen Retrieval Protocol (PIER)
- Antigen Retrieval for Frozen Sections Protocol
- Appropriate Fixation of IHC/ICC Samples
- Cellular Response to Hypoxia Protocols
- Chromogenic IHC Staining of Formalin-Fixed Paraffin-Embedded (FFPE) Tissue Protocol
- Chromogenic Immunohistochemistry Staining of Frozen Tissue
- ClariTSA™ Fluorophore Kits
- Detection & Visualization of Antibody Binding
- Extracellular Membrane Flow Cytometry Protocol
- Flow Cytometry Protocol for Cell Surface Markers
- Flow Cytometry Protocol for Staining Membrane Associated Proteins
- Flow Cytometry Staining Protocols
- Flow Cytometry Troubleshooting Guide
- Fluorescent IHC Staining of Frozen Tissue Protocol
- Graphic Protocol for Heat-induced Epitope Retrieval
- Graphic Protocol for the Preparation and Fluorescent IHC Staining of Frozen Tissue Sections
- Graphic Protocol for the Preparation and Fluorescent IHC Staining of Paraffin-embedded Tissue Sections
- Graphic Protocol for the Preparation of Gelatin-coated Slides for Histological Tissue Sections
- IHC Sample Preparation (Frozen sections vs Paraffin)
- Immunofluorescent IHC Staining of Formalin-Fixed Paraffin-Embedded (FFPE) Tissue Protocol
- Immunohistochemistry (IHC) and Immunocytochemistry (ICC) Protocols
- Immunohistochemistry Frozen Troubleshooting
- Immunohistochemistry Paraffin Troubleshooting
- Intracellular Flow Cytometry Protocol Using Alcohol (Methanol)
- Intracellular Flow Cytometry Protocol Using Detergents
- Intracellular Nuclear Staining Flow Cytometry Protocol Using Detergents
- Intracellular Staining Flow Cytometry Protocol Using Alcohol Permeabilization
- Intracellular Staining Flow Cytometry Protocol Using Detergents to Permeabilize Cells
- Preparing Samples for IHC/ICC Experiments
- Preventing Non-Specific Staining (Non-Specific Binding)
- Primary Antibody Selection & Optimization
- Propidium Iodide Cell Viability Flow Cytometry Protocol
- Protocol for Heat-Induced Epitope Retrieval (HIER)
- Protocol for Liperfluo
- Protocol for Making a 4% Formaldehyde Solution in PBS
- Protocol for VisUCyte™ HRP Polymer Detection Reagent
- Protocol for the Characterization of Human Th22 Cells
- Protocol for the Characterization of Human Th9 Cells
- Protocol for the Preparation & Fixation of Cells on Coverslips
- Protocol for the Preparation and Chromogenic IHC Staining of Frozen Tissue Sections
- Protocol for the Preparation and Chromogenic IHC Staining of Frozen Tissue Sections - Graphic
- Protocol for the Preparation and Chromogenic IHC Staining of Paraffin-embedded Tissue Sections
- Protocol for the Preparation and Chromogenic IHC Staining of Paraffin-embedded Tissue Sections - Graphic
- Protocol for the Preparation and Fluorescent IHC Staining of Frozen Tissue Sections
- Protocol for the Preparation and Fluorescent IHC Staining of Paraffin-embedded Tissue Sections
- Protocol for the Preparation of Gelatin-coated Slides for Histological Tissue Sections
- Protocol: Annexin V and PI Staining by Flow Cytometry
- Protocol: Annexin V and PI Staining for Apoptosis by Flow Cytometry
- R&D Systems Quality Control Western Blot Protocol
- TUNEL and Active Caspase-3 Detection by IHC/ICC Protocol
- The Importance of IHC/ICC Controls
- Troubleshooting Guide: Fluorokine Flow Cytometry Kits
- Troubleshooting Guide: Immunohistochemistry
- Troubleshooting Guide: Western Blot Figures
- Western Blot Conditions
- Western Blot Protocol
- Western Blot Protocol for Cell Lysates
- Western Blot Troubleshooting
- Western Blot Troubleshooting Guide
- View all Protocols, Troubleshooting, Illustrated assays and Webinars