
Axl (Ufo, Ark), Dtk (Sky, Tyro3, Rse, Brt) and Mer (human and mouse homologues of chicken c-Eyk) constitute a receptor tyrosine kinase subfamily. The extracellular domains of these proteins contain two Ig-like motifs and two fibronectin type III motifs. This characteristic topology is also found in neural cell adhesion molecules and in receptor tyrosine phosphatases. These receptors bind the vitamin K-dependent protein growth-arrest-specific gene 6 (Gas6) which is structurally related to the anticoagulation factor protein S. Binding of Gas6 induces receptor autophosphorylation and downstream signaling pathways that can lead to cell proliferation, migration or the prevention of apoptosis. Studies suggest that this family of tyrosine kinase receptors may be involved in hematopoiesis, embryonic development, tumorigenesis and regulation of testicular functions (1, 2).

Scientific images may be resized, cropped, or adjusted for brightness or contrast for presentation purposes. These updates are limited to presentation and do not affect the underlying scientific interpretation of the data. Where available, additional source data may be provided upon request.
Key Product Details
Validated by
Species Reactivity
Validated:
Cited:
Applications
Validated:
Cited:
Label
Antibody Source
Product Specifications
Immunogen
Glu23-Phe498
Accession # Q60805
Specificity
Clonality
Host
Isotype
Scientific Data Images for Mouse Mer Antibody
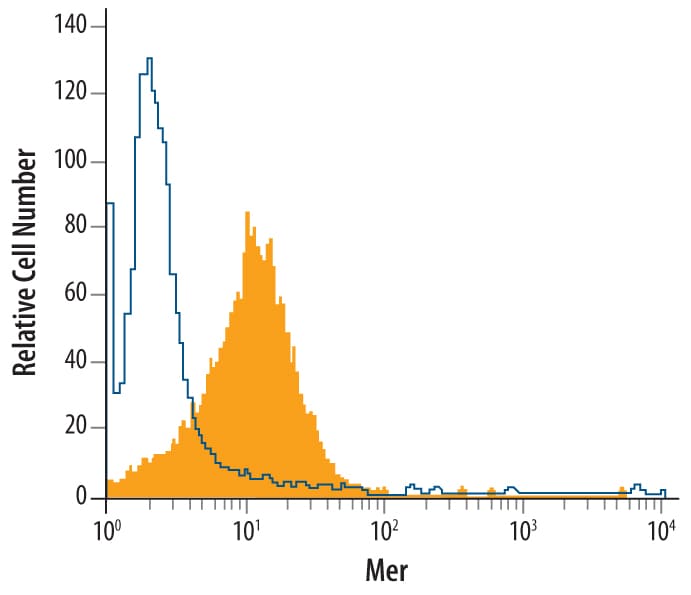
Detection of Mer in J774A.1 Mouse Cell Line by Flow Cytometry.
J774A.1 mouse reticulum cell sarcoma macrophage cell line was stained with Goat Anti-Mouse Mer Antigen Affinity-purified Polyclonal Antibody (Catalog # AF591, filled histogram) or control antibody (Catalog # AB-108-C, open histogram), followed by Allophycocyanin-conjugated Anti-Goat IgG Secondary Antibody (Catalog # F0108).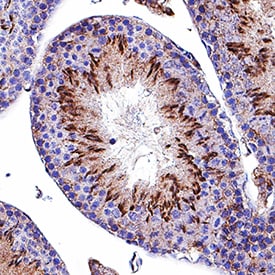
Mer in Mouse Testis.
Mer was detected in perfusion fixed frozen sections of mouse testis using Goat Anti-Mouse Mer Antigen Affinity-purified Polyclonal Antibody (Catalog # AF591) at 1 µg/mL for 1 hour at room temperature followed by incubation with the Anti-Goat IgG VisUCyte™ HRP Polymer Antibody (Catalog # VC004). Tissue was stained using DAB (brown) and counterstained with hematoxylin (blue). Specific staining was localized to sperm cells. View our protocol for IHC Staining with VisUCyte HRP Polymer Detection Reagents.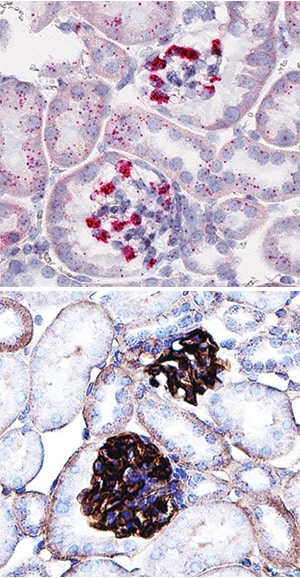
Mer in Mouse Kidney Using Dual RNAscope®ISH and IHC.
Mer mRNA was detected in formalin-fixed paraffin-embedded tissue sections of mouse kidney probed with ACD RNAScope®Probe (Catalog # 441241) and stained using ACD RNAscope®2.5 HD Detection Reagents-Red (top image, Catalog # 32260). Adjacent tissue section was processed for immunohistochemistry using R&D Systems Goat Anti-Mouse Mer Antigen Affinity-purified Polyclonal Antibody (Catalog # AF591) at 1 ug/mL with overnight incubation at 4 °C followed by incubation with the Anti-Goat IgG VisUCyte HRP Polymer Antibody (R&D Systems, Catalog # VC004) and DAB chromogen (lower image, yellow-brown). Tissues were counterstained with hematoxylin (blue).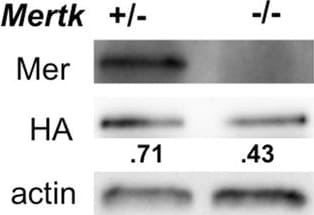
Detection of Mouse Mer by Western Blot
RPE express components of BAI1-signaling pathway and Bai1Tg. (A) Expression of the BAI1 signaling pathway was analyzed by quantitative RT-PCR in RPE isolated from P14 Mertk+/− and Mertk−/− mice (n = 2) Error bars represent SEM. (B) Immunoblot analysis of BAI1 signaling pathway in RPE whole cell lysates isolated from P14 mice. Left panel shows representative immunoblots for Mer, Dock180, Elmo2 and Rac. Right panel shows combined densitometry analysis of immunoblots from n = 3 mice per genotype. For densitometry analysis, band volumes were normalized to an actin loading control and band densities in Mertk−/− were then normalized to Mertk+/− for comparison across multiple blots. (C) Schematic of Bai1Tg insertion in the Rosa26 locus indicating the N-terminal HA-tag in red and IRES-GFP in green. Mouse image licensed from Motifolio Inc. (D) GFP expression was analyzed in RPE flat mount preparations at 20x magnification. Inset image in the left panel shows a representative flat mount at 1.2x magnification. White scale bars in images are 50 μm. Images are representative of n = 2 mice per genotype. (E) qRT-PCR analysis of Bai1Tg expression in Mertk+/−Bai1Tg (n = 9) and Mertk−/−Bai1Tg (n = 3) RPE isolated on P14. n.d. = not detected. Error bars represent SEM. (F) Immunoblot analysis of HA-tag (Bai1Tg) in RPE whole cell lysates isolated from P13-P14 mice. Immunoblot shown is representative of n = 2 experiments. (G) HA staining and localization was analyzed in eyecups at 40x magnification. Neural retinas were removed prior to fixation and staining. Black lines next to the figure align with apical microvilli of RPE. Scale bars are 20 μm. Images shown are representative of n = 2 mice per genotype. Image collected and cropped by CiteAb from the following publication (https://www.nature.com/articles/s41598-017-15191-1), licensed under a CC-BY license. Not internally tested by R&D Systems.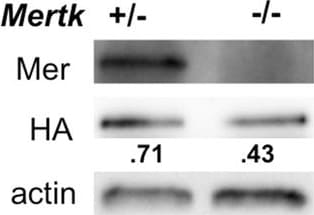
Detection of Mer by Western Blot
RPE express components of BAI1-signaling pathway and Bai1Tg. (A) Expression of the BAI1 signaling pathway was analyzed by quantitative RT-PCR in RPE isolated from P14 Mertk+/− and Mertk−/− mice (n = 2) Error bars represent SEM. (B) Immunoblot analysis of BAI1 signaling pathway in RPE whole cell lysates isolated from P14 mice. Left panel shows representative immunoblots for Mer, Dock180, Elmo2 and Rac. Right panel shows combined densitometry analysis of immunoblots from n = 3 mice per genotype. For densitometry analysis, band volumes were normalized to an actin loading control and band densities in Mertk−/− were then normalized to Mertk+/− for comparison across multiple blots. (C) Schematic of Bai1Tg insertion in the Rosa26 locus indicating the N-terminal HA-tag in red and IRES-GFP in green. Mouse image licensed from Motifolio Inc. (D) GFP expression was analyzed in RPE flat mount preparations at 20x magnification. Inset image in the left panel shows a representative flat mount at 1.2x magnification. White scale bars in images are 50 μm. Images are representative of n = 2 mice per genotype. (E) qRT-PCR analysis of Bai1Tg expression in Mertk+/−Bai1Tg (n = 9) and Mertk−/−Bai1Tg (n = 3) RPE isolated on P14. n.d. = not detected. Error bars represent SEM. (F) Immunoblot analysis of HA-tag (Bai1Tg) in RPE whole cell lysates isolated from P13-P14 mice. Immunoblot shown is representative of n = 2 experiments. (G) HA staining and localization was analyzed in eyecups at 40x magnification. Neural retinas were removed prior to fixation and staining. Black lines next to the figure align with apical microvilli of RPE. Scale bars are 20 μm. Images shown are representative of n = 2 mice per genotype. Image collected and cropped by CiteAb from the following open publication (https://pubmed.ncbi.nlm.nih.gov/29116131), licensed under a CC-BY license. Not internally tested by R&D Systems.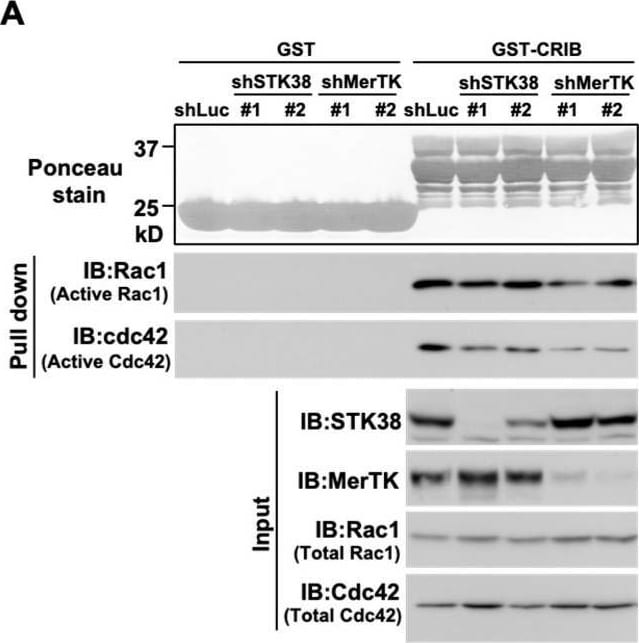
Detection of Mer by Knockdown Validated
Knockdown of MerTK and STK38 reduce active Rac1 and Cdc42. (A) HEK293T cells were infected with various combinations of retroviral constructs encoding STK38 shRNA (shSTK38 #1 and #2), MerTK shRNA (shMerTK #1 and #2), and control Luciferase shRNA (shLuc). Whole cell extracts were subjected to pulldown with GST-CRIB or GST to collect active Rac1 and Cdc42. The amount of Rac1 and Cdc42 in the pulldown assay was determined by immunoblotting (IB) with anti-Rac1 and anti-Cdc42 antibodies. Whole cell extracts (Input) were analyzed by immunoblotting (IB) with an anti-STK38, anti-MerTK, anti-Rac1, and anti-Cdc42 antibodies. Ponceau red stain was used to indicate the GST-fused protein amount. (B,C) The ratios of active Rac1 (B) and active Cdc42 (C) to total Rac1 and Cdc42 are shown in the graph. Data obtained from three independent experiments are expressed as the mean SD. *, and ** indicate p < 0.05 and p < 0.01, respectively. (D) HEK293T cells were infected with various combinations of retroviral constructs encoding STK38 shRNA (shSTK38 #1), MerTK shRNA (shMerTK #2), control luciferase shRNA (shLuc). Whole cell extracts were subjected to immunoblot analysis with an anti-STK38, anti-MerTK, and anti-alpha -tubulin antibodies. Tubulin served as an internal loading control. (E) HEK29T cells were infected with the same combination of the retroviral constructs in (D) were subjected to the immunofluorescence analysis. Cells were fixed and stained with phalloidin (red) to detect F-actin. Nuclei were visualized by DAPI. The scale bar represents 10 μm. (F) Schematic illustration of the role of STK38 in oncogenic Ras-induced cell migration. Image collected and cropped by CiteAb from the following open publication (https://www.mdpi.com/1422-0067/26/21/10388), licensed under a CC-BY license. Not internally tested by R&D Systems.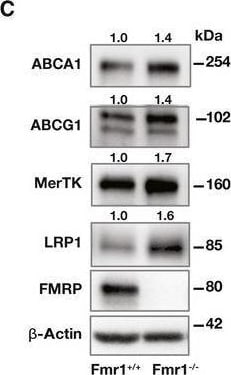
Detection of Mer by Western Blot
FMRP targets in macrophagesA, BRNA lysates from Fmr1+/+ and Fmr1−/− BMDM that were treated with PA (500 µM; 6 h) were fractionated using a 10–50% sucrose gradient and separated to polysome, monosome/NTR fractions. The absorbance (260 nm) of RNA was measured and plotted as a function of time (n = 3 biological replicates). (A) Representative profile for RNA distribution from genotypes based on UV absorbance readings after sucrose gradient fractionation. (B) The ratio of the Abca1, Abcg1, Mertk, Lrp1, Cd36, Cd47, and Rac1 mRNA in polysome to NTR fraction (n = 3 biological replicates).CBMDM were isolated from Fmr1+/+ and Fmr1−/−, and protein lysates were analyzed by Western blotting using specific antibodies for ABCA1, ABCG1, MerTK, LRP1, FMRP, and beta ‐Actin antibodies and fold inductions relative to beta ‐Actin are depicted above the blots (n = 6 biological replicates).DFmr1−/− MEF cells were transfected with EV, WT‐FMRP, or STSA‐FMRP plasmids followed by PA treatment (500 µM; 6 h). Protein lysates were analyzed by Western blotting using specific antibodies for ABCA1, MerTK, LRP1, pFMRP, FMRP, and beta ‐Actin and fold inductions relative to beta ‐Actin are depicted above the blots (n = 5 biological replicates).Data information: A representative blot is shown. In C and D, data are cumulative results of 2 and 3 independent experiments, respectively. In Western blots, the protein expression fold change was calculated relative to beta ‐Actin and depicted above the blots and a representative blot was shown. Data are mean ± SEM. Unpaired t‐test with Welch’s correction.Source data are available online for this figure. Image collected and cropped by CiteAb from the following open publication (https://link.springer.com/10.15252/emmm.202115344), licensed under a CC-BY license. Not internally tested by R&D Systems.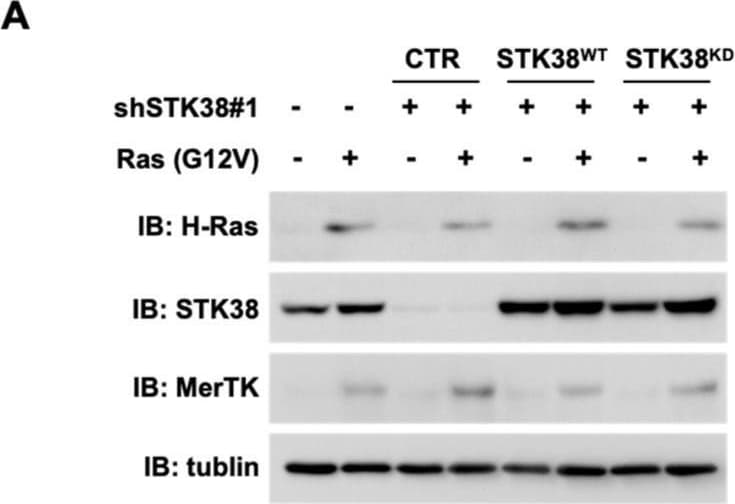
Detection of Mer by Western Blot
The kinase activity of STK38 is required for oncogenic Ras-induced cell migration. (A) NIH-3T3 cells were infected with various combinations of retroviral constructs encoding STK38 shRNA (shSTK38 #1), Ras (G12V), control luciferase shRNA (shLuc), wild-type FLAG-STK38 (STK38WT), the FLAG-STK38 kinase-dead mutant (STK38KD), and an empty vector (CTR). Whole cell extracts were analyzed by immunoblotting (IB) with an anti-H-Ras, anti-STK38, anti-MerTK, and anti-alpha -tubulin antibodies. Tubulin served as an internal loading control. (B,C) NIH-3T3 cells infected with the same combination of the retroviral constructs indicated in (A) were subjected to the transwell migration assay. The cells on the lower side in four fields were observed with 4.2× objective lens (FSX100, Olympus) and counted and shown as a graph. Error bars represent the mean ± SD of three independent biological replicates. *, **, and *** indicate p < 0.05, p < 0.01, and p < 0.005, respectively. (D) NIH-3T3 cells infected with the combination of retroviral constructs encoding Ras (G12V) (+) and an empty vector (−). Whole cell extracts were analyzed by immunoblotting (IB) with an anti-H-Ras, anti-MerTK, anti-STK38, anti-phospho-STK38 (Thr444), and anti-alpha -tubulin antibodies. Tubulin was used as internal loading control. (E) The intensity of p-STK38 signals in (D) were normalized with those of tubulin signals and the relative intensity of p-STK38 signals were shown as a graph. Error bars represent the mean ± SD of three independent biological replicates. N.S., not significant. Image collected and cropped by CiteAb from the following open publication (https://www.mdpi.com/1422-0067/26/21/10388), licensed under a CC-BY license. Not internally tested by R&D Systems.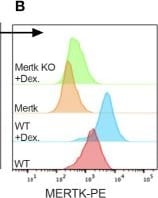
Detection of Mer by Flow Cytometry
Targeted protein degraders (TPD) for targeting MERTK on murine BMDMs. (A) BMDMs are defined as CD11b+ F4/80+ cells by flow cytometry. (B) Histograms show that MERTK is expressed on murine BMDMs and is highly induced by treatment with 0.1 µM of dexamethasone, whereas Mertk KO BMDMs do not express MERTK. (C) MERTK levels in WT, dexamethasone treated and Mertk KO BMDMs are measured by flow cytometry (Bar graphs represent mean of MFI ± SD, analyzed by ordinary one way ANOVA, n=3 *=p<0.05) and (D) mRNA expression is measured by qRTPCR (Bar graphs represent mean relative expression ± SD, analyzed by ordinary one way ANOVA, n=3 *=p<0.05; only statistically significant results have been represented by asterisks (*), for all figures in this paper). (E) shows the chemical structures of degraders, KTX-335 consists of a MERTK ligand conjugated to a cereblon ligand by a linker. KTX-959 and KTX-214 are compounds where the cereblon ligand is methylated and unable to engage cereblon, hence they serve as negative controls for KTX-652 and KTX-978, respectively. Image collected and cropped by CiteAb from the following open publication (https://www.frontiersin.org/articles/10.3389/fimmu.2023.1135373/full), licensed under a CC-BY license. Not internally tested by R&D Systems.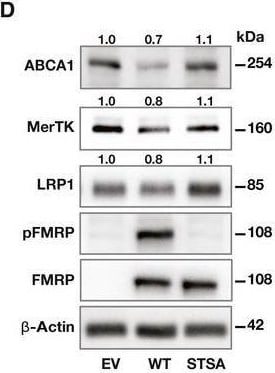
Detection of Mer by Western Blot
FMRP targets in macrophagesA, BRNA lysates from Fmr1+/+ and Fmr1−/− BMDM that were treated with PA (500 µM; 6 h) were fractionated using a 10–50% sucrose gradient and separated to polysome, monosome/NTR fractions. The absorbance (260 nm) of RNA was measured and plotted as a function of time (n = 3 biological replicates). (A) Representative profile for RNA distribution from genotypes based on UV absorbance readings after sucrose gradient fractionation. (B) The ratio of the Abca1, Abcg1, Mertk, Lrp1, Cd36, Cd47, and Rac1 mRNA in polysome to NTR fraction (n = 3 biological replicates).CBMDM were isolated from Fmr1+/+ and Fmr1−/−, and protein lysates were analyzed by Western blotting using specific antibodies for ABCA1, ABCG1, MerTK, LRP1, FMRP, and beta ‐Actin antibodies and fold inductions relative to beta ‐Actin are depicted above the blots (n = 6 biological replicates).DFmr1−/− MEF cells were transfected with EV, WT‐FMRP, or STSA‐FMRP plasmids followed by PA treatment (500 µM; 6 h). Protein lysates were analyzed by Western blotting using specific antibodies for ABCA1, MerTK, LRP1, pFMRP, FMRP, and beta ‐Actin and fold inductions relative to beta ‐Actin are depicted above the blots (n = 5 biological replicates).Data information: A representative blot is shown. In C and D, data are cumulative results of 2 and 3 independent experiments, respectively. In Western blots, the protein expression fold change was calculated relative to beta ‐Actin and depicted above the blots and a representative blot was shown. Data are mean ± SEM. Unpaired t‐test with Welch’s correction.Source data are available online for this figure. Image collected and cropped by CiteAb from the following open publication (https://link.springer.com/10.15252/emmm.202115344), licensed under a CC-BY license. Not internally tested by R&D Systems.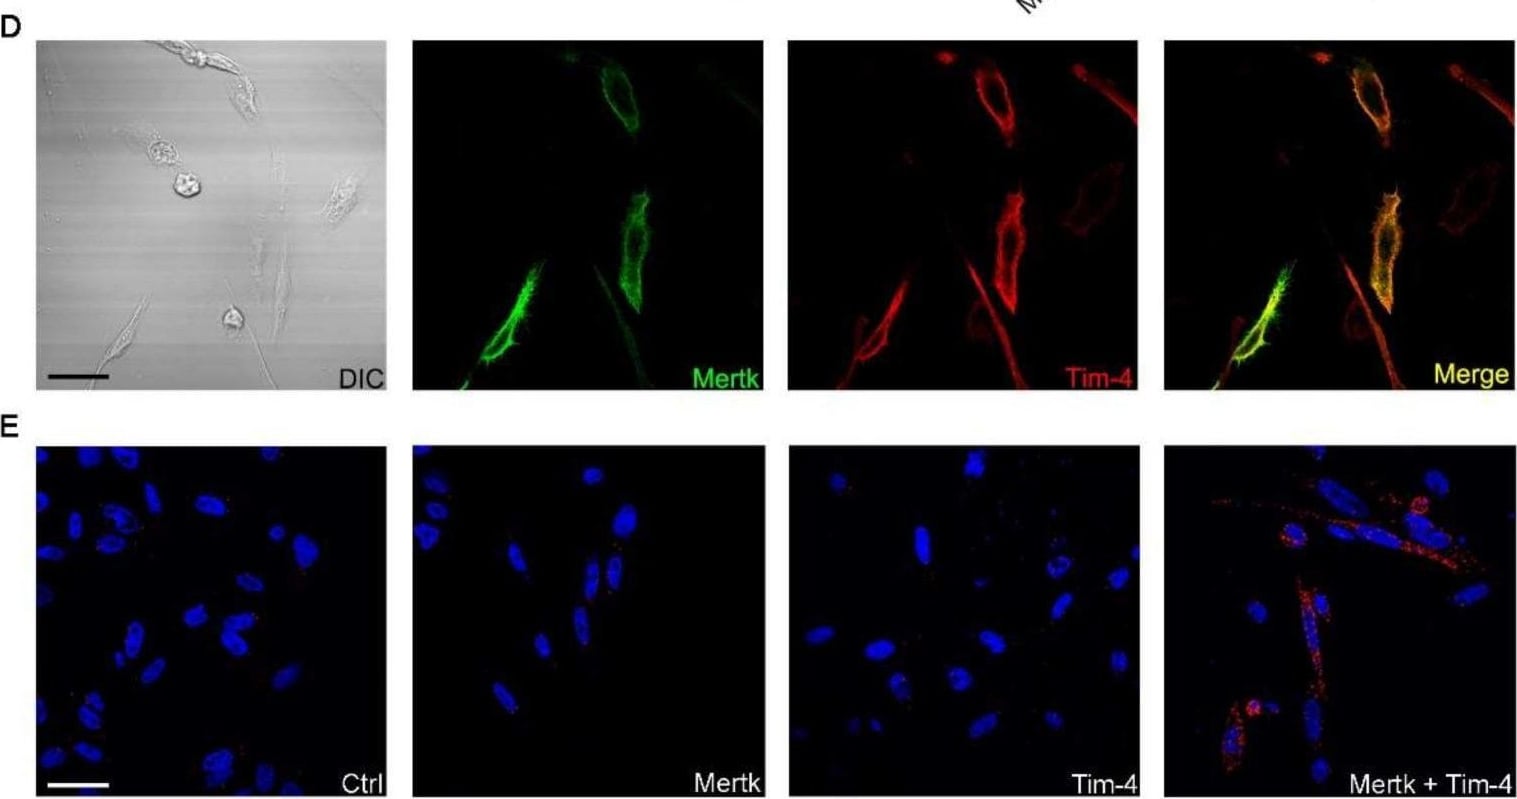
Detection of Mer by Immunocytochemistry/ Immunofluorescence
Tim-4 is colocalized with Mertk. (A) Schematic diagram of Mertk and Tim-4. Ig, immunoglobulin; FnIII, fibronectin type-III; PKD, protein tyrosine kinase domain; IgV, Immunoglobulin variable; ECR, extracellular region. (B) LR73 cells transfected with the indicated plasmids were incubated with TAMRA-labeled apoptotic thymocytes in serum-free alpha-MEM for 2 h, washed with PBS, trypsinized, and analyzed using flow cytometry. Cells that stained double-positive for TAMRA and GFP were considered to be phagocytes engulfing apoptotic cells (n = 4). (C) LR73 cells transfected with the indicated plasmids were incubated with TAMRA-labeled apoptotic thymocytes in serum-free alpha-MEM at 4 °C for 2 h and washed with PBS to remove unbound apoptotic cells. Bound apoptotic cells were then counted (n ≥ 50 cells). (D) LR73 cells transfected with HA-Tim-4 and Mertk-FLAG were incubated with anti-Mer and anti-HA antibodies, and then stained with Alexa Fluor 488- and Alexa Fluor 594-conjugated secondary antibodies. Images were acquired by confocal microscopy (n = 3). Scale bar, 20 µm. (E,F) A proximity ligation assay was performed using LR73 cells transfected with the indicated plasmids. One day after transfection, the cells were fixed, blocked, and incubated with anti-FLAG and anti-Tim-4tail antibodies. The cells then were incubated with the amplification solution at 37 °C overnight. Images were acquired by confocal microscopy ((E), n = 3) and quantified ((F), n ≥ 27 cells). Scale bar, 40 µm. Data are shown as the mean ± standard deviation. NS, not significant. **p < 0.01. ***p < 0.001. Image collected and cropped by CiteAb from the following open publication (https://pubmed.ncbi.nlm.nih.gov/32640697), licensed under a CC-BY license. Not internally tested by R&D Systems.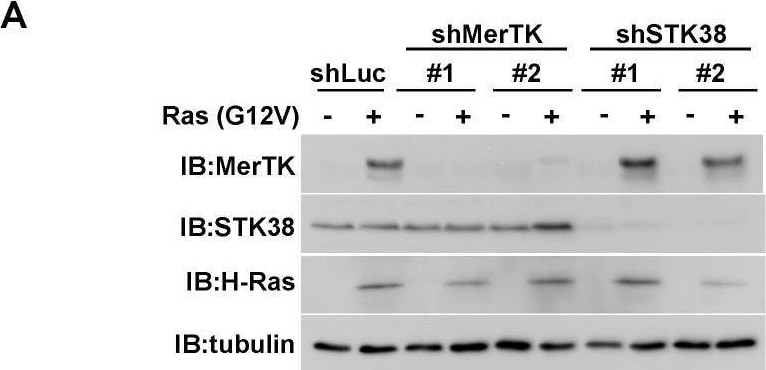
Detection of Mer by Knockdown Validated
Knockdown of STK38 suppresses cell migration induced by Ras (G12V). (A) NIH-3T3 cells were infected with various combinations of retroviral constructs encoding MerTK shRNA (shMerTK #1 or #2), STK38 shRNA (shSTK38 #1 or #2), Ras (G12V) (+), an empty vector (−), or control luciferase shRNA (shLuc). Whole cell extracts were subjected to immunoblotting (IB) with an anti-MerTK, anti-STK38, anti-H-Ras, and anti-alpha -tubulin antibodies. Tubulin served as an internal loading control. (B,C) NIH-3T3 cells infected with the same combination of the retroviral constructs in (A) were analyzed by transwell migration assay. Migrated cells were observed with 4.2× objective lens (FSX100, Olympus, Tokyo, Japan). Four fields of cells in the lower side were counted, and the counted cell number was shown as a graph. Error bars represent the mean ± SD of three independent biological replicates. *, and ** indicate p < 0.05 and p < 0.01, respectively. Image collected and cropped by CiteAb from the following open publication (https://www.mdpi.com/1422-0067/26/21/10388), licensed under a CC-BY license. Not internally tested by R&D Systems.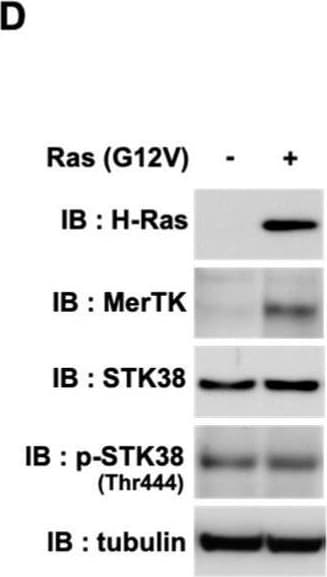
Detection of Mer by Western Blot
The kinase activity of STK38 is required for oncogenic Ras-induced cell migration. (A) NIH-3T3 cells were infected with various combinations of retroviral constructs encoding STK38 shRNA (shSTK38 #1), Ras (G12V), control luciferase shRNA (shLuc), wild-type FLAG-STK38 (STK38WT), the FLAG-STK38 kinase-dead mutant (STK38KD), and an empty vector (CTR). Whole cell extracts were analyzed by immunoblotting (IB) with an anti-H-Ras, anti-STK38, anti-MerTK, and anti-alpha -tubulin antibodies. Tubulin served as an internal loading control. (B,C) NIH-3T3 cells infected with the same combination of the retroviral constructs indicated in (A) were subjected to the transwell migration assay. The cells on the lower side in four fields were observed with 4.2× objective lens (FSX100, Olympus) and counted and shown as a graph. Error bars represent the mean ± SD of three independent biological replicates. *, **, and *** indicate p < 0.05, p < 0.01, and p < 0.005, respectively. (D) NIH-3T3 cells infected with the combination of retroviral constructs encoding Ras (G12V) (+) and an empty vector (−). Whole cell extracts were analyzed by immunoblotting (IB) with an anti-H-Ras, anti-MerTK, anti-STK38, anti-phospho-STK38 (Thr444), and anti-alpha -tubulin antibodies. Tubulin was used as internal loading control. (E) The intensity of p-STK38 signals in (D) were normalized with those of tubulin signals and the relative intensity of p-STK38 signals were shown as a graph. Error bars represent the mean ± SD of three independent biological replicates. N.S., not significant. Image collected and cropped by CiteAb from the following open publication (https://www.mdpi.com/1422-0067/26/21/10388), licensed under a CC-BY license. Not internally tested by R&D Systems.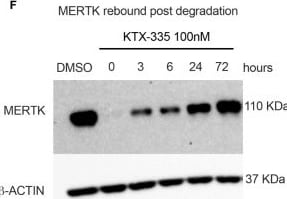
Detection of Mer by Western Blot
KTX-335 selectively degrades MERTK and suppresses efferocytosis. (A) Treatment of EGFR/TAM chimeric cell lines with KTX-335 shows degradation specific for MERTK and not for AXL or TYRO3. (Plot shows relative MFI of EGFR ± SD normalized to untreated, analyzed by two way ANOVA, Dunnett’s multiple comparison test, n=3, *=p<0.05, ** =p < 0.01, *** = p <0.001, **** = p < 0.0001, compared to untreated, also shown as 0 nM). (B) shows kinetics of degradation of MERTK on naïve BMDMs treated with KTX-335 for 1, 3, 6, 10, 18 and 24 hours. MERTK expression is measured by flow cytometry using an anti-MERTK-PE antibody and y- axis represents relative MFI (PE) ± SD normalized to the 0 hour time point (Ordinary One way ANOVA, n=4, * =p<0.05, ** =p < 0.01, *** = p <0.001, **** = p < 0.0001, compared to 0 hour time point). (C) KTX-335 reduces surface MERTK expression on naïve BMDMs (18 hours treatment) in a dose dependent manner up-to 100 nM, and demonstrating the hook effect at higher concentrations, (Plot shows relative MFI of MERTK-PE ± SD normalized to untreated, analyzed by one-way ANOVA, n=4, **** = p < 0.0001, compared to untreated). (D) KTX-335 also efficiently reduces MERTK expression on Dexamethasone induced BMDMs (Plot shows relative MFI of MERTK-PE ± SD normalized to untreated, analyzed by one-way ANOVA, n=4, * =p<0.05, ** =p < 0.01 compared to untreated). (E) KTX-335 reduces efferocytosis of apoptotic cells in naïve BMDMs, (Plot shows the mean percentage of pHrodo+ cells ± SD within the CD11b+ F4/80+ gate, analyzed by ordinary one way ANOVA, n=3, * =p<0.05, ** =p < 0.01, *** = p <0.001, **** = p < 0.0001. (F) Western blot shows rebound of MERTK in BMDMs post wash out of KTX-335 at 0, 3, 6, 24 and 72 hours. Image collected and cropped by CiteAb from the following open publication (https://www.frontiersin.org/articles/10.3389/fimmu.2023.1135373/full), licensed under a CC-BY license. Not internally tested by R&D Systems.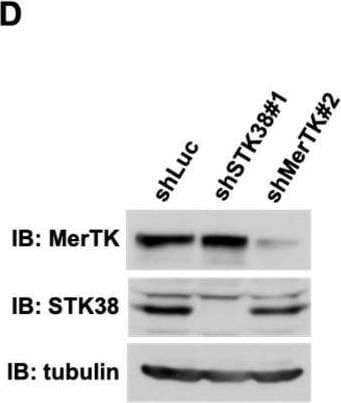
Detection of Mer by Knockdown Validated
Knockdown of MerTK and STK38 reduce active Rac1 and Cdc42. (A) HEK293T cells were infected with various combinations of retroviral constructs encoding STK38 shRNA (shSTK38 #1 and #2), MerTK shRNA (shMerTK #1 and #2), and control Luciferase shRNA (shLuc). Whole cell extracts were subjected to pulldown with GST-CRIB or GST to collect active Rac1 and Cdc42. The amount of Rac1 and Cdc42 in the pulldown assay was determined by immunoblotting (IB) with anti-Rac1 and anti-Cdc42 antibodies. Whole cell extracts (Input) were analyzed by immunoblotting (IB) with an anti-STK38, anti-MerTK, anti-Rac1, and anti-Cdc42 antibodies. Ponceau red stain was used to indicate the GST-fused protein amount. (B,C) The ratios of active Rac1 (B) and active Cdc42 (C) to total Rac1 and Cdc42 are shown in the graph. Data obtained from three independent experiments are expressed as the mean SD. *, and ** indicate p < 0.05 and p < 0.01, respectively. (D) HEK293T cells were infected with various combinations of retroviral constructs encoding STK38 shRNA (shSTK38 #1), MerTK shRNA (shMerTK #2), control luciferase shRNA (shLuc). Whole cell extracts were subjected to immunoblot analysis with an anti-STK38, anti-MerTK, and anti-alpha -tubulin antibodies. Tubulin served as an internal loading control. (E) HEK29T cells were infected with the same combination of the retroviral constructs in (D) were subjected to the immunofluorescence analysis. Cells were fixed and stained with phalloidin (red) to detect F-actin. Nuclei were visualized by DAPI. The scale bar represents 10 μm. (F) Schematic illustration of the role of STK38 in oncogenic Ras-induced cell migration. Image collected and cropped by CiteAb from the following open publication (https://www.mdpi.com/1422-0067/26/21/10388), licensed under a CC-BY license. Not internally tested by R&D Systems.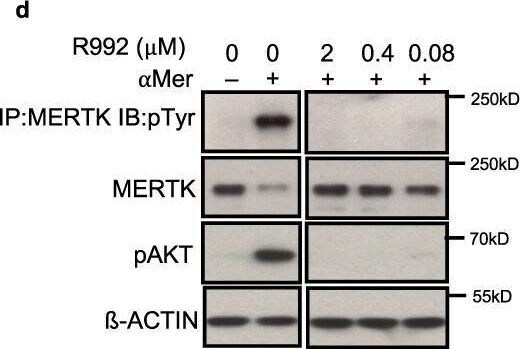
Detection of Mer by Western Blot
The MERTK-inhibitor R992 induces bone formation in healthy mice.a Structure and chemical formula of R992: 3-(Butylamino)−5-((1r,4r)−4-hydroxycyclohexyl)−8-((4-methylpiperazin-1-yl)methyl)pyrimido[4,5-c]isoquinolin-6(5H)-one (C27H38N6O2). b Illustration of R992 docked in MERTK and the H-bonds R992 forms with three residues in the ATP pocket (MET-647, PRO-672, and ASP-741). c R992 on-target and off-target activity. d, e Immunoblots of MERTK phosphorylation and AKT signaling in human (d) and murine (e) cells. f μCT of the metaphyseal proximal region of tibias of 10-week-old healthy C57BL/6J mice treated after 2 weeks of treatment with vehicle or R992. g Quantification of trabecular bone volume (BV/TV) of the proximal tibia determined by μCT analysis (Vehicle n = 7 and R992 n = 7). h, i Representative pictures (h) and analysis (i) of bone formation rate by Calcein and Demeclocycline double labeling (Vehicle n = 7 and R992 n = 7). j, k Representative pictures of Alizarin red staining of calvarial cells cultures treated with different doses of R992 on day 21 (j). The number of mineralized nodules was quantified (k) (n = 3 biological replicates). l Analysis of osteoblast differentiation marker Alpl, Runx2, and Osx on day 7 in R992-treated calvarial cell cultures in comparison to control treated cultures (n = 3 biological replicates). Data were means ± SEM. Statistical significance was determined by a two-tailed unpaired t-test. Image collected and cropped by CiteAb from the following open publication (https://pubmed.ncbi.nlm.nih.gov/36509738), licensed under a CC-BY license. Not internally tested by R&D Systems.Applications for Mouse Mer Antibody
CyTOF-ready
Dual RNAscope ISH-IHC Compatible
Sample: Immersion fixed paraffin-embedded tissue sections of mouse kidney
Flow Cytometry
Sample:
| J774A.1 mouse reticulum cell sarcoma macrophage cell line |
Immunohistochemistry
Sample: Perfusion fixed frozen sections of mouse testis
Reviewed Applications
Read 4 reviews rated 4.5 using AF591 in the following applications:
Flow Cytometry Panel Builder
Bio-Techne Knows Flow Cytometry
Save time and reduce costly mistakes by quickly finding compatible reagents using the Panel Builder Tool.
Advanced Features
- Spectra Viewer - Custom analysis of spectra from multiple fluorochromes
- Spillover Popups - Visualize the spectra of individual fluorochromes
- Antigen Density Selector - Match fluorochrome brightness with antigen density

Formulation, Preparation, and Storage
Purification
Reconstitution
Reconstitute at 0.2 mg/mL in sterile PBS. For liquid material, refer to CoA for concentration.
Formulation
Shipping
Stability & Storage
- 12 months from date of receipt, -20 to -70 °C as supplied.
- 1 month, 2 to 8 °C under sterile conditions after reconstitution.
- 6 months, -20 to -70 °C under sterile conditions after reconstitution.
Calculators
Background: Mer
References
- Nagata, K. et al. (1996) J. Biol. Chem. 22:30022.
- Crosier, K.E. and P.S Crosier (1997) Pathology 29:131.
Long Name
Alternate Names
Gene Symbol
UniProt
Additional Mer Products
Product Documents for Mouse Mer Antibody
Certificate of Analysis
To download a Certificate of Analysis, please enter a lot or batch number in the search box below.
Note: Certificate of Analysis not available for kit components.
Product Specific Notices for Mouse Mer Antibody
For research use only
Citations for Mouse Mer Antibody
 Powered by Bioz
Customer Reviews for Mouse Mer Antibody (4)
Have you used Mouse Mer Antibody?
Submit a review and receive an Amazon gift card!
$25/€18/£15/$25CAN/¥2500 for a review with an image
$10/€7/£6/$10CAN/¥1110 for a review without an image
Submit a review
Customer Images
-
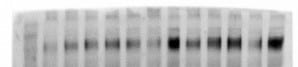
Application: Western BlotSample Tested: lysates of primary bone marrow derived macrophageSpecies: miceVerified Customer | Posted 11/08/2022The band comes around 170Kda

-
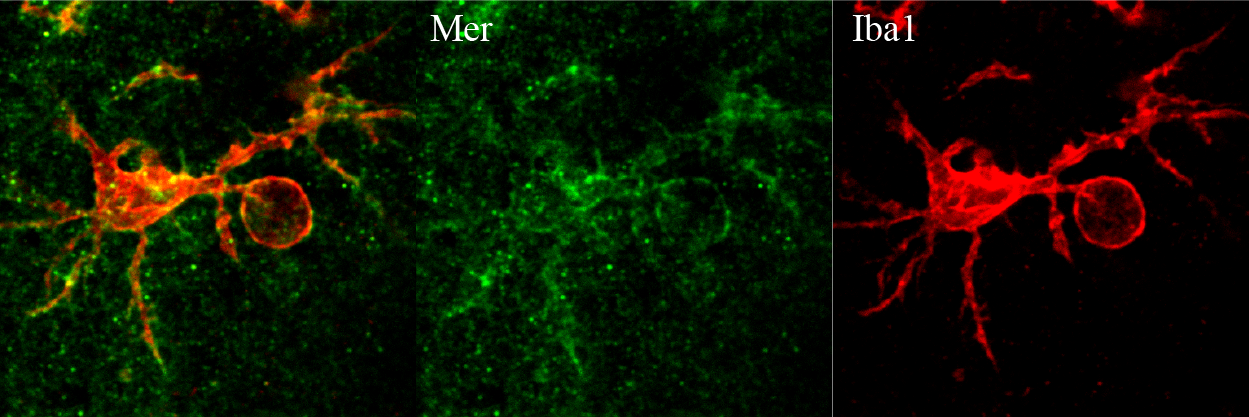
Application: immunohistochemistry free floating sectionSample Tested: Adult mouse brainSpecies: MouseVerified Customer | Posted 03/16/2018Mer is in green and Iba1 is in red.antigen retrieval for 15 mins. 1:250 dilution.
-
Application: Flow CytometrySample Tested: Peritoneal macrophagesSpecies: MouseVerified Customer | Posted 06/17/2017
-
Application: in vivoSample Tested: Adult mouse brain and brain and spinal cordSpecies: MouseVerified Customer | Posted 04/03/2017Used in vivo to inhibit Mer activation.
There are no reviews that match your criteria.
Protocols
Find general support by application which include: protocols, troubleshooting, illustrated assays, videos and webinars.
- 7-Amino Actinomycin D (7-AAD) Cell Viability Flow Cytometry Protocol
- Antigen Retrieval Protocol (PIER)
- Antigen Retrieval for Frozen Sections Protocol
- Appropriate Fixation of IHC/ICC Samples
- Cellular Response to Hypoxia Protocols
- Chromogenic IHC Staining of Formalin-Fixed Paraffin-Embedded (FFPE) Tissue Protocol
- Chromogenic Immunohistochemistry Staining of Frozen Tissue
- ClariTSA™ Fluorophore Kits
- Detection & Visualization of Antibody Binding
- Extracellular Membrane Flow Cytometry Protocol
- Flow Cytometry Protocol for Cell Surface Markers
- Flow Cytometry Protocol for Staining Membrane Associated Proteins
- Flow Cytometry Staining Protocols
- Flow Cytometry Troubleshooting Guide
- Fluorescent IHC Staining of Frozen Tissue Protocol
- Graphic Protocol for Heat-induced Epitope Retrieval
- Graphic Protocol for the Preparation and Fluorescent IHC Staining of Frozen Tissue Sections
- Graphic Protocol for the Preparation and Fluorescent IHC Staining of Paraffin-embedded Tissue Sections
- Graphic Protocol for the Preparation of Gelatin-coated Slides for Histological Tissue Sections
- IHC Sample Preparation (Frozen sections vs Paraffin)
- ISH-IHC Protocol for Chromogenic Detection on Formalin Fixed Paraffin Embedded (FFPE) Tissue
- Immunofluorescent IHC Staining of Formalin-Fixed Paraffin-Embedded (FFPE) Tissue Protocol
- Immunohistochemistry (IHC) and Immunocytochemistry (ICC) Protocols
- Immunohistochemistry Frozen Troubleshooting
- Immunohistochemistry Paraffin Troubleshooting
- Intracellular Flow Cytometry Protocol Using Alcohol (Methanol)
- Intracellular Flow Cytometry Protocol Using Detergents
- Intracellular Nuclear Staining Flow Cytometry Protocol Using Detergents
- Intracellular Staining Flow Cytometry Protocol Using Alcohol Permeabilization
- Intracellular Staining Flow Cytometry Protocol Using Detergents to Permeabilize Cells
- Preparing Samples for IHC/ICC Experiments
- Preventing Non-Specific Staining (Non-Specific Binding)
- Primary Antibody Selection & Optimization
- Propidium Iodide Cell Viability Flow Cytometry Protocol
- Protocol for Heat-Induced Epitope Retrieval (HIER)
- Protocol for Liperfluo
- Protocol for Making a 4% Formaldehyde Solution in PBS
- Protocol for VisUCyte™ HRP Polymer Detection Reagent
- Protocol for the Characterization of Human Th22 Cells
- Protocol for the Characterization of Human Th9 Cells
- Protocol for the Preparation & Fixation of Cells on Coverslips
- Protocol for the Preparation and Chromogenic IHC Staining of Frozen Tissue Sections
- Protocol for the Preparation and Chromogenic IHC Staining of Frozen Tissue Sections - Graphic
- Protocol for the Preparation and Chromogenic IHC Staining of Paraffin-embedded Tissue Sections
- Protocol for the Preparation and Chromogenic IHC Staining of Paraffin-embedded Tissue Sections - Graphic
- Protocol for the Preparation and Fluorescent IHC Staining of Frozen Tissue Sections
- Protocol for the Preparation and Fluorescent IHC Staining of Paraffin-embedded Tissue Sections
- Protocol for the Preparation of Gelatin-coated Slides for Histological Tissue Sections
- Protocol: Annexin V and PI Staining by Flow Cytometry
- Protocol: Annexin V and PI Staining for Apoptosis by Flow Cytometry
- TUNEL and Active Caspase-3 Detection by IHC/ICC Protocol
- The Importance of IHC/ICC Controls
- Troubleshooting Guide: Fluorokine Flow Cytometry Kits
- Troubleshooting Guide: Immunohistochemistry
- View all Protocols, Troubleshooting, Illustrated assays and Webinars