CIDEA Antibody - BSA Free
Novus Biologicals | Catalog # NBP1-76950
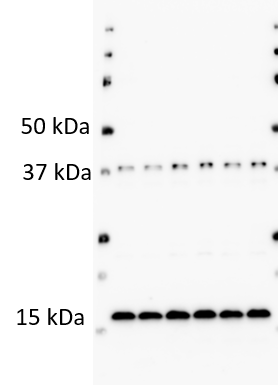
![Western Blot: CIDEA AntibodyBSA Free [NBP1-76950]](https://resources.rndsystems.com/images/products/CIDEA-Antibody-Western-Blot-NBP1-76950-img0002.jpg "Western Blot: CIDEA AntibodyBSA Free [NBP1-76950]")
Key Product Details
Species Reactivity
Validated:
Human, Mouse
Cited:
Mouse
Applications
Validated:
Immunohistochemistry, Immunohistochemistry-Paraffin, Western Blot, ELISA, Immunocytochemistry/ Immunofluorescence
Cited:
Western Blot, Immunocytochemistry/ Immunofluorescence, IF/IHC
Label
Unconjugated
Antibody Source
Polyclonal Rabbit IgG
Format
BSA Free
Loading...
Product Specifications
Immunogen
Antibody was raised against an 18 amino acid peptide near the carboxy terminus of mouse CIDE-A. The immunogen is located within the last 50 amino acids of CIDE-A.
Specificity
It has no cross activity to CIDE-B.
Clonality
Polyclonal
Host
Rabbit
Isotype
IgG
Theoretical MW
25 kDa.
Disclaimer note: The observed molecular weight of the protein may vary from the listed predicted molecular weight due to post translational modifications, post translation cleavages, relative charges, and other experimental factors.
Disclaimer note: The observed molecular weight of the protein may vary from the listed predicted molecular weight due to post translational modifications, post translation cleavages, relative charges, and other experimental factors.
Scientific Data Images for CIDEA Antibody - BSA Free
Western Blot: CIDEA AntibodyBSA Free [NBP1-76950]
Western Blot: CIDEA Antibody [NBP1-76950] - Mouse heart tissue lysate with CIDE-A antibody at 1:500 dilution.
Immunohistochemistry: CIDEA Antibody - BSA Free [NBP1-76950] -
Immunohistochemistry: CIDEA Antibody - BSA Free [NBP1-76950] - Immunohistochemistry of CIDEA in mouse heart tissue with CIDEA antibody at 5 ug/mL.
Immunocytochemistry/ Immunofluorescence: CIDEA Antibody - BSA Free [NBP1-76950] -
Immunocytochemistry/ Immunofluorescence: CIDEA Antibody - BSA Free [NBP1-76950] - Immunofluorescence of CIDEA in Mouse Heart cells with CIDEA antibody at 20 ug/mL.
Immunocytochemistry/ Immunofluorescence: CIDEA Antibody - BSA Free [NBP1-76950] -
Immunocytochemistry/ Immunofluorescence: CIDEA Antibody - BSA Free [NBP1-76950] - Immunofluorescence of CIDEA in human brain tissue with CIDE A antibody at 20 ug/mL.Green: CIDEA Antibody
Blue: DAPI staining

Immunohistochemistry: CIDEA Antibody - BSA Free [NBP1-76950] -
Immunohistochemistry: CIDEA Antibody - BSA Free [NBP1-76950] - Immunohistochemistry of CIDEA in human brain tissue with CIDE A antibody at 2.5 ug/mL.
Western Blot: CIDEA Antibody - BSA Free [NBP1-76950] -
Hepatic expression of FSP27 beta strongly increased with the severity of NAFLD whereas CIDEA expression decreased. Wild-type mice fed a control diet (Ctrl D) (n = 4) or MCDD (n = 6) for 2 and 7 weeks. (A, B, C) Hepatic expression of CIDEA, CIDEB, FSP27 alpha and FSP27 beta was evaluated in Wt, Ctrl D and MCDD mice at the mRNA level (4–6 mice/group). The gene expression was normalized to the mRNA levels of B2M or 36B4. Results are expressed relative to the expression level in controls (means +/- SEM) and statistically analyzed using the Mann–Whitney test. (D) Hepatic expression of CIDEA, FSP27 and HSP90 was evaluated in Wt, Ctrl D and MCDD mice at the protein level (2–5 mice/group). *, versus Ctrl D, p < 0.05 Image collected and cropped by CiteAb from the following open publication (https://pubmed.ncbi.nlm.nih.gov/31097771), licensed under a CC-BY license. Not internally tested by Novus Biologicals.
Western Blot: CIDEA Antibody - BSA Free [NBP1-76950] -
Hepatic expression of CIDEA, FSP27 alpha and FSP27 beta increased with hepatic steatosis induced by HFD challenge. Wild-type mice fed a control diet (Ctrl D) (n = 7) or HFD (n = 7) for 33 weeks. (A, C) Hepatic expression of CIDEA, CIDEB, FSP27 alpha and FSB27 beta was evaluated in Wt, Ctrl D and HFD mice at the mRNA level (7 mice/group). The gene expression was normalized to the mRNA levels of B2M or 36B4. Results are expressed relative to the expression level in controls (means +/- SEM) and statistically analyzed using the Mann–Whitney test. (B) Hepatic expression of CIDEA, FSP27 and HSP90 was evaluated in Wt, Ctrl D and HFD mice at the protein level (2–4 mice/group). *p < 0.05. Image collected and cropped by CiteAb from the following open publication (https://pubmed.ncbi.nlm.nih.gov/31097771), licensed under a CC-BY license. Not internally tested by Novus Biologicals.
Western Blot: CIDEA Antibody - BSA Free [NBP1-76950] -
Overexpression of CIDEA promoted apoptosis in ESCC cells. (A) Cisplatin treated cells were stained for Annexin V/PI and analyzed FACS. The percentage of Annexin V+ cells is shown. (B) Mitochondrial potential was measured by flow cytometry using the JC-1 molecular probe in ESCC cells with or without cisplatin treatment. Enhanced green fluorescence ratio of cells indicated a decrease in mitochondrial potential. (C) Cell viability of CIDEA overexpressing cells and control cells treated with different concentrations of cisplatin. (D) Caspase-9, PARP, and p-JNK were detected in CIDEA overexpressing cells and control cells with or without cisplatin treatment. (E) Quantification of p-JNK, Bad, cleaved-Caspase9, and cleaved-PARP in KYSE30 and KYSE150 cells treated with cisplatin. Statistical data are represented as mean +/- SD. *P < 0.05; **P < 0.01; ***P < 0.001; n.s., P > 0.05. Image collected and cropped by CiteAb from the following open publication (https://pubmed.ncbi.nlm.nih.gov/33614508), licensed under a CC-BY license. Not internally tested by Novus Biologicals.
Western Blot: CIDEA Antibody - BSA Free [NBP1-76950] -
Losartan reduced LDs accumulation and lipogenesis in liver. (A) Representative HE, Oil Red O, HIF1 alpha, PLIN1, PLIN2, and CIDEA staining of liver. Red arrow highlights the positive staining. Scale bar: 100 μm. Tissue staining, as quantified by either stain intensity, is represented on the left-hand vertical axis in each graph. (B) Quantification of HIF1 alpha, PLIN1, PLIN2, and CIDEA protein levels in homogenates of liver. Below graphs indicate quantification relative to Histone (for HIF1 alpha ) and beta -actin (for PLIN1, PLIN2, and CIDEA). (C) Quantification of Srebp-1c, Fas and Scd1, (D) Cd36, Fatp, Cpt1, and Cpt2 by qRT-PCR. For each animal group, n = 5. All values represent the mean +/- SEM. Data were analyzed by Student’s t test. * p ≤ 0.05, normal vs. ob/ob; # p ≤ 0.05, ob/ob vs. ob/ob+ Losartan. HIF1: hypoxia-inducible factor 1; LDs: lipid droplets; HE: hematoxylin and eosin stain; PLIN1, perilipin 1; CIDEA, cell death inducing DFFA like effector A; SREBP: sterol response element-binding protein; Fas: fatty acid synthase; Scd: stearoyl-CoA desaturase; Cd36: cluster of differentiation 36; Fatp: fatty acid transport protein; Cpt1: carnitine palmitoyltransferase 1; qRT-PCR: quantitative real time polymerase chain reaction. Image collected and cropped by CiteAb from the following open publication (https://pubmed.ncbi.nlm.nih.gov/34889901), licensed under a CC-BY license. Not internally tested by Novus Biologicals.
Western Blot: CIDEA Antibody - BSA Free [NBP1-76950] -
Losartan attenuated HIF-1 alpha expression and LDs formation in EWAT. (A) Representative HIF-1 alpha staining of EWAT from losartan-treated ob/ob mice and normal mice. Red arrow highlights the positive staining. Scale bar: 100 μm. Quantification of (B) HIF-1 alpha protein level by Western blot. Below graphs indicate quantification relative to Histone. (C) Representative HE, PLIN1, PLIN2, CIDEA and CIDEC staining of EWAT from losartan-treated ob/ob mice and normal mice. Scale bar: 100 μm. Quantification of (D) PLIN1, PLIN2, CIDEA, and CIDEC protein levels by Western blot of EWAT after losartan treatment. Below graphs indicate quantification relative to beta -actin. For each animal group, n = 5. All values represent the mean +/- SEM. Data were analyzed by Student’s t test. * p ≤ 0.05; normal vs. ob/ob. # p ≤ 0.05; ob/ob vs. ob/ob + Losartan. HIF-1 alpha, hypoxia-inducible factor-1 alpha ; LDs, lipid droplets; EWAT, epididymis white adipose tissue; HE, hematoxylin and eosin; PLIN, perilipin; CIDE, cell-death-inducing DNA-fragmentation-factor (DFF45)-like effector. Image collected and cropped by CiteAb from the following open publication (https://pubmed.ncbi.nlm.nih.gov/34360607), licensed under a CC-BY license. Not internally tested by Novus Biologicals.
Western Blot: CIDEA Antibody - BSA Free [NBP1-76950] -
Losartan decreased HIF-1 alpha and LD-associated proteins. (A) Representative HE, Oil Red O, HIF-1 alpha, PLIN1, PLIN2, CIDEA and CIDEC staining of liver from normal mice and losartan-treated ob/ob mice. Green pseudo-color represents visualization of lipofuscin’s autofluorescence at 450–490 nm. Red arrow highlights the positive staining. Scale bar: 100 μm. Quantification of (B) HIF-1 alpha, PLIN1, PLIN2, CIDEA, and CIDEC protein levels by Western blot of liver after losartan treatment. Below graphs indicate quantification relative to Histone or beta -actin. (C) Quantification of ATGL, HSL, LPL, and ACO by qRT-PCR. qRT-PCR indicates quantification relative to GAPDH. For each animal group, n = 5. All values represent the mean +/- SEM. Data were analyzed by Student’s t test. * p ≤ 0.05; normal vs. ob/ob. # p ≤ 0.05; ob/ob vs. ob/ob + Losartan. HIF-1 alpha, hypoxia-inducible factor-1 alpha ; LDs, lipid droplets; HE, hematoxylin and eosin; PLIN, perilipin; CIDE, cell-death-inducing DNA-fragmentation-factor (DFF45)-like effector; ATGL, adipose triglyceride lipase; HSL, hormone-sensitive lipase; LPL, lipoprotein lipase; ACO, acyl-CoA oxidase. Image collected and cropped by CiteAb from the following open publication (https://pubmed.ncbi.nlm.nih.gov/34360607), licensed under a CC-BY license. Not internally tested by Novus Biologicals.
Western Blot: CIDEA Antibody - BSA Free [NBP1-76950] -
Losartan attenuated HIF1 alpha expression and LDs formation in EWAT. (A) Representative HE and HIF1 alpha staining. Red arrow highlights the positive staining. Scale bar: 100 μm. Tissue staining, as quantified by either stain intensity, is represented on the left-hand vertical axis in each graph. (B) Representative PLIN1, PLIN2, CIDEA, and CIDEC staining of EWAT. Green pseudocolor represents visualization of lipofuscin’s autofluorescence at 450–490 nm. Red arrow highlights the positive staining. Scale bar: 100 μm. Tissue staining, as quantified by either stain intensity, is represented on the left-hand vertical axis in each graph. Quantification of (C) HIF1 alpha protein levels by Western blot. Below graph indicate quantification relative to Histone. Quantification of (D) PLIN1, PLIN2, CIDEA, and CIDEC protein levels by Western blot of EWAT. Below graphs indicate quantification relative to beta -actin. For each animal group, n = 5. All values represent the mean +/- SEM. Data were analyzed by Student’s t test. * p ≤ 0.05, normal vs. ob/ob; # p ≤ 0.05, ob/ob vs. ob/ob+ Losartan. HIF1 alpha : hypoxia-inducible factor 1 alpha ; LDs: lipid droplets; EWAT: epididymal white adipose tissue; HE: hematoxylin and eosin stain; PLIN1: perilipin 1; CIDEA: cell death inducing DFFA like effector A. Image collected and cropped by CiteAb from the following open publication (https://pubmed.ncbi.nlm.nih.gov/34889901), licensed under a CC-BY license. Not internally tested by Novus Biologicals.Applications for CIDEA Antibody - BSA Free
Application
Recommended Usage
ELISA
1:100 - 1:2000
Immunocytochemistry/ Immunofluorescence
20 ug/mL
Immunohistochemistry
2.5 ug/mL
Western Blot
0.5 ug/mL
Reviewed Applications
Read 1 review rated 3 using NBP1-76950 in the following applications:
Formulation, Preparation, and Storage
Purification
Peptide affinity purified
Formulation
PBS
Format
BSA Free
Preservative
0.02% Sodium Azide
Concentration
1 mg/ml
Shipping
The product is shipped with polar packs. Upon receipt, store it immediately at the temperature recommended below.
Stability & Storage
Store at 4C.
Background: CIDEA
Long Name
Cell Death-inducing DFFA-like Effector A
Alternate Names
cell death activator CIDE-A, cell death-inducing DFFA-like effector aCIDE-A
Gene Symbol
CIDEA
UniProt
Additional CIDEA Products
Product Documents for CIDEA Antibody - BSA Free
Certificate of Analysis
To download a Certificate of Analysis, please enter a lot or batch number in the search box below.
Product Specific Notices for CIDEA Antibody - BSA Free
This product is for research use only and is not approved for use in humans or in clinical diagnosis. Primary Antibodies are guaranteed for 1 year from date of receipt.
Related Research Areas
Citations for CIDEA Antibody - BSA Free
 Powered by Bioz
Customer Reviews for CIDEA Antibody - BSA Free (1)
3 out of 5
1 Customer Rating
Have you used CIDEA Antibody - BSA Free?
Submit a review and receive an Amazon gift card!
$25/€18/£15/$25CAN/¥2500 Yen for a review with an image
$10/€7/£6/$10CAN/¥1110 Yen for a review without an image
Submit a review
Customer Images
Showing
1
-
1 of
1 review
Showing All
Filter By:
-
Application: Western BlotSample Tested: Mesenchymal stem cells differentiated into adipocytesSpecies: MouseVerified Customer | Posted 11/16/2018Loaded 20 ug protein. Blocked 1 hour at room temp in 5% BSA (TBST). Incubated primary overnight at 4 degrees C, 1:1000 in 5% BSA (TBST)Dark bands at ~15 and ~37. Difficult to determine which, if either is CIDEA.

There are no reviews that match your criteria.
Protocols
Find general support by application which include: protocols, troubleshooting, illustrated assays, videos and webinars.
- Antigen Retrieval Protocol (PIER)
- Antigen Retrieval for Frozen Sections Protocol
- Appropriate Fixation of IHC/ICC Samples
- Cellular Response to Hypoxia Protocols
- Chromogenic IHC Staining of Formalin-Fixed Paraffin-Embedded (FFPE) Tissue Protocol
- Chromogenic Immunohistochemistry Staining of Frozen Tissue
- ClariTSA™ Fluorophore Kits
- Detection & Visualization of Antibody Binding
- ELISA Sample Preparation & Collection Guide
- ELISA Troubleshooting Guide
- Fluorescent IHC Staining of Frozen Tissue Protocol
- Graphic Protocol for Heat-induced Epitope Retrieval
- Graphic Protocol for the Preparation and Fluorescent IHC Staining of Frozen Tissue Sections
- Graphic Protocol for the Preparation and Fluorescent IHC Staining of Paraffin-embedded Tissue Sections
- Graphic Protocol for the Preparation of Gelatin-coated Slides for Histological Tissue Sections
- How to Run an R&D Systems DuoSet ELISA
- How to Run an R&D Systems Quantikine ELISA
- How to Run an R&D Systems Quantikine™ QuicKit™ ELISA
- ICC Cell Smear Protocol for Suspension Cells
- ICC Immunocytochemistry Protocol Videos
- ICC for Adherent Cells
- IHC Sample Preparation (Frozen sections vs Paraffin)
- Immunocytochemistry (ICC) Protocol
- Immunocytochemistry Troubleshooting
- Immunofluorescence of Organoids Embedded in Cultrex Basement Membrane Extract
- Immunofluorescent IHC Staining of Formalin-Fixed Paraffin-Embedded (FFPE) Tissue Protocol
- Immunohistochemistry (IHC) and Immunocytochemistry (ICC) Protocols
- Immunohistochemistry Frozen Troubleshooting
- Immunohistochemistry Paraffin Troubleshooting
- Preparing Samples for IHC/ICC Experiments
- Preventing Non-Specific Staining (Non-Specific Binding)
- Primary Antibody Selection & Optimization
- Protocol for Heat-Induced Epitope Retrieval (HIER)
- Protocol for Making a 4% Formaldehyde Solution in PBS
- Protocol for VisUCyte™ HRP Polymer Detection Reagent
- Protocol for the Fluorescent ICC Staining of Cell Smears - Graphic
- Protocol for the Fluorescent ICC Staining of Cultured Cells on Coverslips - Graphic
- Protocol for the Preparation & Fixation of Cells on Coverslips
- Protocol for the Preparation and Chromogenic IHC Staining of Frozen Tissue Sections
- Protocol for the Preparation and Chromogenic IHC Staining of Frozen Tissue Sections - Graphic
- Protocol for the Preparation and Chromogenic IHC Staining of Paraffin-embedded Tissue Sections
- Protocol for the Preparation and Chromogenic IHC Staining of Paraffin-embedded Tissue Sections - Graphic
- Protocol for the Preparation and Fluorescent ICC Staining of Cells on Coverslips
- Protocol for the Preparation and Fluorescent ICC Staining of Non-adherent Cells
- Protocol for the Preparation and Fluorescent ICC Staining of Stem Cells on Coverslips
- Protocol for the Preparation and Fluorescent IHC Staining of Frozen Tissue Sections
- Protocol for the Preparation and Fluorescent IHC Staining of Paraffin-embedded Tissue Sections
- Protocol for the Preparation of Gelatin-coated Slides for Histological Tissue Sections
- Protocol for the Preparation of a Cell Smear for Non-adherent Cell ICC - Graphic
- Quantikine HS ELISA Kit Assay Principle, Alkaline Phosphatase
- Quantikine HS ELISA Kit Principle, Streptavidin-HRP Polymer
- R&D Systems Quality Control Western Blot Protocol
- Sandwich ELISA (Colorimetric) – Biotin/Streptavidin Detection Protocol
- Sandwich ELISA (Colorimetric) – Direct Detection Protocol
- TUNEL and Active Caspase-3 Detection by IHC/ICC Protocol
- The Importance of IHC/ICC Controls
- Troubleshooting Guide: ELISA
- Troubleshooting Guide: Immunohistochemistry
- Troubleshooting Guide: Western Blot Figures
- Western Blot Conditions
- Western Blot Protocol
- Western Blot Protocol for Cell Lysates
- Western Blot Troubleshooting
- Western Blot Troubleshooting Guide
- View all Protocols, Troubleshooting, Illustrated assays and Webinars
Loading...