HIF-1 alpha Antibody - BSA Free
Novus Biologicals | Catalog # NB100-479

Key Product Details
Validated by
Knockout/Knockdown, Biological Validation
Species Reactivity
Validated:
Human, Mouse, Rat, Porcine, Canine, Fish, Goat, Hamster, Primate, Rabbit, Zebrafish
Cited:
Human, Mouse, Rat, Porcine, Canine, Fish, Fish - Danio rerio (Zebrafish), Goat, Hamster, Moth - Trichoplusia ni (Cabbage Looper), Rabbit
Applications
Validated:
Immunohistochemistry, Immunohistochemistry-Paraffin, Immunohistochemistry-Frozen, Immunohistochemistry Whole-Mount, Western Blot, Immunoblotting, Flow Cytometry, Immunocytochemistry/ Immunofluorescence, Simple Western, Immunoprecipitation, Chromatin Immunoprecipitation (ChIP), Knockdown Validated
Cited:
Knockout Validated, Immunohistochemistry, Immunohistochemistry-Paraffin, Immunohistochemistry-Frozen, Immunohistochemistry Free-Floating, Immunohistochemistry Whole-Mount, Western Blot, Immunoblotting, Flow Cytometry, Immunocytochemistry/ Immunofluorescence, Immunoprecipitation, Chromatin Immunoprecipitation, Chromatin Immunoprecipitation (ChIP), Chemotaxis, CyTof, EA, IF/IHC
Label
Unconjugated
Antibody Source
Polyclonal Rabbit IgG
Format
BSA Free
Loading...
Product Specifications
Immunogen
This HIF-1 alpha antibody was developed against a fusion protein including amino acids 530 - 825 of the mouse HIF-1 alpha protein [Uniprot# Q61221].
Reactivity Notes
Use in Zebrafish reported in scientific literature (PMID:35457018).Use in Mouse reported in scientific literature (PMID:33727588). Use in Goat reported in scientific literature (PMID:21599540).
Clonality
Polyclonal
Host
Rabbit
Isotype
IgG
Theoretical MW
93 kDa.
Disclaimer note: The observed molecular weight of the protein may vary from the listed predicted molecular weight due to post translational modifications, post translation cleavages, relative charges, and other experimental factors.
Disclaimer note: The observed molecular weight of the protein may vary from the listed predicted molecular weight due to post translational modifications, post translation cleavages, relative charges, and other experimental factors.
Scientific Data Images for HIF-1 alpha Antibody - BSA Free
ChIP-qPCR Analysis of HIF-1 alpha in Treated Human MDA-MB-231 Breast Cancer Cells
ChIP-qPCR assay of HIF-1 binding to hypoxia response element (HRE) of the PKM2 gene in human MDA-MB-231 breast cancer cells treated with vehicle or DMOG (HIF inducer) for 8 hours. Negative control: immunoprecipitation was performed with IgG. Image courtesy of Gregg Semenza, Johns Hopkins University School of Medicine.

Immunohistological Analysis of HIF-1 alpha in Wounded and non-Wounded Mouse Tissues
HIF-1-alpha-Antibody-Immunohistochemistry-NB100-479-img0030.jpg
Staining of HIF-1 alpha in Paraffin Embedded Mouse Kidney with and without Blocking Peptide
Staining in normal mouse kidney showing (A) staining with HIF-1 alpha antibody and (B) blocking peptide used at 10-fold excess concentration. Images provided by Dr Yves Heremans. Please see the product review of NBC1-18422 for additional details.

Immunohistological Staining of HIF-1 alpha in Paraffin Embedded Mouse Skin Wound
Analysis in paraffin section of mouse skin wound using NB100-479 at 1:6000. Image courtesy of product review by Ian Darby of RMIT University.

Chromatin Immunoprecipitation Using HIF-1 alpha Antibody in MDA-MB-231 Cells
MDA-MB-231 cells were exposed to 20% or 1% O2 for 16 hours, and chromatin immunoprecipitation (ChIP) was performed with the indicated antibody (Ab). Primers flanking the HIF binding site in the S100A10 gene were used for qPCR. ChIP image submitted by a verified customer review.


Detection of HIF-1 alpha in U251 Cells by Western Blot
U251 cells exposed to 4 hour hypoxia (0.5% oxygen) incubation. Western blot image submitted by a verified customer review.
Immunocytochemistry/Immunofluorescence Staining of HIF-1 alpha in RCC4 Cells
Detection of HIF-1 Alpha (green) in RCC4 cells using NB100-479. Nuclei (Blue) were counterstained using Hoechst 33258.
Immunohistological Staining of HIF-1 alpha in Paraffin Embedded Human Kidney Tumor
Analysis of HIF-1 alpha in human kidney tumor.
Immunohistological Staining of HIF-1 alpha in Human Placenta
Staining of human placenta, villi.
Staining of HIF-1 alpha in i.v. CDDP and i.a. CDDP Administered Tumor Tissue
HIF-1-alpha-Antibody-Immunohistochemistry-Paraffin-NB100-479-img0028.jpg
Immunohistological Imaging of HIF-1 alpha in Preimplantation Embryos
HIF-1-alpha-Antibody-Immunohistochemistry-NB100-479-img0026.jpg
Simple Western Analysis of HIF-1 alpha in MSCs
Simple Western lane view shows lysates of MCF +/- DMOG, BioSpherix MSCs in hypoxic conditions, and BioSpherix MSCs in normoxic conditions loaded at 0.5 mg/ml. A band was detected for HIF-1 alpha at approximately 116 kDa (as indicated) using NB100-479 (1:100 dilution) followed by Anti-Rabbit Secondary Antibody (042-206, ProteinSimple). This experiment was conducted under standard assay conditions, and using the 12-230 kDa separation module (SW-W004). Non-specific interaction with the 230 kDa Simple Western standard seen with this antibody. Image from an internal validation.
Western Blot: HIF-1 alpha Antibody - BSA Free [NB100-479] -
Cofilin phosphorylation is HIF-1 alpha dependent.Wt, shC, and the HIF-1 alpha knock down cell clones c1 and c2 cells were lysed after 24 hrs of normoxia (20% O2) or hypoxia (1% O2). Cell extracts were analysed by Western blots. Note that p-cofilin levels are reduced in c2 and c2 cells compared to wt and shC cells at 20% O2 and 1% O2.
Western Blot: HIF-1 alpha Antibody - BSA Free [NB100-479] -
Western Blot: HIF-1 alpha Antibody - BSA Free [NB100-479] - Hypoxic markers accumulate in miR-29-sponge Zebrafish hearts. (A) Representative western blot analysis of hypoxia inducible factor 1 alpha (HIF1 alpha ) expression in Wild Type & miR-29-sponge Zebrafish heart. In each condition, alpha -tubulin was used as loading control. Three independent experiments were performed. Full-length blot is presented in Supplementary Figure 6.(B) qRT-PCR mRNA analysis of hypoxia associated genes: erythropoietin alpha (epoa); hexokinase2 (hk2); heme oxygenase1a (hmox1a); lactate dehydrogenase A (ldha); cyclin-dependent kinase inhibitor 1B (p27) in Wild Type (black circles; n = 4) & miR-29-sponge (gray squares; n = 4) Zebrafish hearts expressed as fold-change versus Wild Type samples. *p < 0.05 Vs Wild Type. Image collected & cropped by CiteAb from the following publication (https://www.nature.com/articles/s41598-017-16829-w), licensed under a CC-BY license. Not internally tested by Novus Biologicals.
Immunocytochemistry/ Immunofluorescence: HIF-1 alpha Antibody - BSA Free [NB100-479] -
Immunocytochemistry/ Immunofluorescence: HIF-1 alpha Antibody - BSA Free [NB100-479] - (a,b) Immunofluorescence staining of (a) HIF-1 alpha (green), the macrophage marker F4/80 (red) & DAPI nuclear stain (blue), & (b) lactate dehydrogenase (LDH, green), F4/80 (red) & DAPI (blue) in WAT of lean & obese mice. Colocalization is shown in the merged image (arrows). Scale bar = 100 µm. (c,d) Relative mRNA expression of (c) Hif1a & Hif2a, & the HIF target genes (d) Vegfa & Glut1 in ATM isolated from lean & obese mice (n = 3). (e) Levels of succinate in ATM of lean & obese mice (n = 6). (f) Relative mRNA levels of the glutamate transporter Slc3a2 in ATM from lean & obese (n = 3). Data is expressed as mean ± s.e.m. *p < 0.05. Image collected & cropped by CiteAb from the following publication (https://pubmed.ncbi.nlm.nih.gov/32221369), licensed under a CC-BY license. Not internally tested by Novus Biologicals.
Western Blot: HIF-1 alpha Antibody - BSA Free [NB100-479] -
Western Blot: HIF-1 alpha Antibody - BSA Free [NB100-479] - Increased expression of HIF alpha and/or Twist in A549 & H441 cells induced by the inhibition of PIMT & Thapsigargin(A) Immunoblotting of Slug, ZEB1, Snail1, Twist, & HIF1 alpha in A549 sh-PIMT & sh-control cells. (B, C) Immunoblotting & relative intensity of HIF1 alpha in A549 cells treated with Tg. (D) Immunoblotting of Slug, ZEB1, Snail1, Twist, & HIF1 alpha in si-control cells & si-PIMT H441 cells. (E, F) Immunoblotting & relative intensity of HIF1 alpha in H441 cells treated with Tg. #1 & #2 indicates si-RNA of J-010000-05-0002 & J-010000-07-0002, respectively. Image collected & cropped by CiteAb from the following publication (https://www.oncotarget.com/lookup/doi/10.18632/oncotarget.24324), licensed under a CC-BY license. Not internally tested by Novus Biologicals.
Immunocytochemistry/ Immunofluorescence: HIF-1 alpha Antibody - BSA Free [NB100-479] -
Immunocytochemistry/ Immunofluorescence: HIF-1 alpha Antibody - BSA Free [NB100-479] - Histology & immunofluorescence in rat corneal sections. a Hematoxylin & Eosin (H&E), b VEGF-A (green); c CCL2 (green); d TNF-alpha (green); e CXCL5 (green); f CD45 (green) & g HIF-1 alpha (green) staining in rat cornea tissue. Nuclear counterstaining by DAPI (blue) in fluorescent images Image collected & cropped by CiteAb from the following publication (http://link.springer.com/10.1007/s10456-018-9594-9), licensed under a CC-BY license. Not internally tested by Novus Biologicals.
Western Blot: HIF-1 alpha Antibody - BSA Free [NB100-479] -
Western Blot: HIF-1 alpha Antibody - BSA Free [NB100-479] - Increased expression of HIF alpha and/or Twist in A549 & H441 cells induced by the inhibition of PIMT & Thapsigargin(A) Immunoblotting of Slug, ZEB1, Snail1, Twist, & HIF1 alpha in A549 sh-PIMT & sh-control cells. (B, C) Immunoblotting & relative intensity of HIF1 alpha in A549 cells treated with Tg. (D) Immunoblotting of Slug, ZEB1, Snail1, Twist, & HIF1 alpha in si-control cells & si-PIMT H441 cells. (E, F) Immunoblotting & relative intensity of HIF1 alpha in H441 cells treated with Tg. #1 & #2 indicates si-RNA of J-010000-05-0002 & J-010000-07-0002, respectively. Image collected & cropped by CiteAb from the following publication (https://www.oncotarget.com/lookup/doi/10.18632/oncotarget.24324), licensed under a CC-BY license. Not internally tested by Novus Biologicals.
Immunohistochemistry: HIF-1 alpha Antibody - BSA Free [NB100-479] -
Immunohistochemistry: HIF-1 alpha Antibody - BSA Free [NB100-479] - White-jaded spleen & muscle in another NOD/SCID mouse model. One-week-old NOD/SCID mice were i.p. infected with EV-A71, & scarified after disease manifestation. aUpper panel: An atrophic & discolored spleen was identified in EV-A71-infected mice. Viral protein (VP1) & HIF1A were both expressed in the infected spleen. Lower panel: A saline control showed a normal-sized spleen with no VP1 & less expression of HIF1A. b Both HIF1A & VEGFA were strongly expressed in the whitened muscles infected with EV-A71, but not detectable in the saline control Image collected & cropped by CiteAb from the following publication (https://pubmed.ncbi.nlm.nih.gov/31711481), licensed under a CC-BY license. Not internally tested by Novus Biologicals.
Western Blot: HIF-1 alpha Antibody - BSA Free [NB100-479] -
Western Blot: HIF-1 alpha Antibody - BSA Free [NB100-479] - The Neutralizing antibody against nucleolin eliminate HDGF-stimulated AKT/HIF-1 alpha /NF-kappa B/VEGF signaling in SCC4 oral cancer cells. a-d SCC4 cells were treated with recombinant HDGF protein (100 ng/ml) in the presence of anti-NCL or anti-IgG antibody (5 μg/ml) for 24 h before total protein extraction. Cell lysates were subjected to Western blotting with the indicated antibodies. beta -actin was used as an internal control for loading & transfer. Data were mean of three experiments. *, P < 0.05; **, P < 0.01; ns, not statistically significant Image collected & cropped by CiteAb from the following publication (https://pubmed.ncbi.nlm.nih.gov/31711427), licensed under a CC-BY license. Not internally tested by Novus Biologicals.
Immunocytochemistry/ Immunofluorescence: HIF-1 alpha Antibody - BSA Free [NB100-479] -
Immunocytochemistry/ Immunofluorescence: HIF-1 alpha Antibody - BSA Free [NB100-479] - Hif1 alpha expression in neonatal & adult ovary.(A) Section of P5 ovary showing MVH expression in all oocytes & Hif1 alpha expression only in small oocytes (primary follicles; top). Negative control images without primary antibodies (bottom). Scale bar: 50μm. (B) Section of adult ovary showing absence of Hif1 alpha expression in primary follicles detected with MVH staining (top). Negative control without primary antibody (bottom). Scale bar: 50μm. (C) Section of adult ovary showing Hif1 alpha expression in mature primary oocyte (arrow). Negative control without primary antibody (bottom). Scale bar: 100μm. (D) Image of a Metaphase II oocyte from superovulated three-month-old female showing Hif1 alpha expression. Scale bar: 50μm. Image collected & cropped by CiteAb from the following publication (https://pubmed.ncbi.nlm.nih.gov/27148974), licensed under a CC-BY license. Not internally tested by Novus Biologicals.
Western Blot: HIF-1 alpha Antibody - BSA Free [NB100-479] -
Western Blot: HIF-1 alpha Antibody - BSA Free [NB100-479] - Effect of alpha -MSH on HIF-1 alpha expression & activity in B16-F10 melanoma cells during hypoxia.a, b alpha -MSH increased HIF-1 alpha mRNA & protein expression levels during hypoxia. c Cells were transfected with luciferase reporter driven by a promoter region containing HIF-1 alpha -specific binding sites before alpha -MSH treatment at the indicated time & concentration. The luciferase activities were measured immediately & expressed as means ± SD from triplicate experiments. d Relative mRNA expression levels were analyzed by real-time PCR. Data are expressed as fold change compared with control (means ± SD of triplicate experiments). *p < 0.05, **p < 0.01. alpha -MSH elevated the Bcl-2 family gene expression levels by HIF-1 alpha activation Image collected & cropped by CiteAb from the following publication (https://pubmed.ncbi.nlm.nih.gov/30062060), licensed under a CC-BY license. Not internally tested by Novus Biologicals.
Western Blot: HIF-1 alpha Antibody - BSA Free [NB100-479] -
Western Blot: HIF-1 alpha Antibody - BSA Free [NB100-479] - Increased expression of HIF alpha and/or Twist in A549 & H441 cells induced by the inhibition of PIMT & Thapsigargin(A) Immunoblotting of Slug, ZEB1, Snail1, Twist, & HIF1 alpha in A549 sh-PIMT & sh-control cells. (B, C) Immunoblotting & relative intensity of HIF1 alpha in A549 cells treated with Tg. (D) Immunoblotting of Slug, ZEB1, Snail1, Twist, & HIF1 alpha in si-control cells & si-PIMT H441 cells. (E, F) Immunoblotting & relative intensity of HIF1 alpha in H441 cells treated with Tg. #1 & #2 indicates si-RNA of J-010000-05-0002 & J-010000-07-0002, respectively. Image collected & cropped by CiteAb from the following publication (https://www.oncotarget.com/lookup/doi/10.18632/oncotarget.24324), licensed under a CC-BY license. Not internally tested by Novus Biologicals.
Immunocytochemistry/ Immunofluorescence: HIF-1 alpha Antibody - BSA Free [NB100-479] -
Immunocytochemistry/ Immunofluorescence: HIF-1 alpha Antibody - BSA Free [NB100-479] - (a) Immunofluorescence staining for HIF-1 alpha (red), hypoxia probe pimonidazole (green) & DAPI nuclei (blue) in WAT of obese mice. Boxed region in the merged image shows HIF-1 alpha -positive cells in crown-like structures that are Pimo− (arrows). (b) HIF-1 alpha protein levels in BMDM treated with BSA (control) or BSA-conjugated palmitate (Palm) for 6, 12 & 24 hours. Tubulin is shown as an internal loading control. (c) Fold change in mRNA expression of Hif1a, Vegfa & Il1b in BMDM treated with palmitate or BSA. (d) Relative mRNA expression in BMDM treated as indicated in the presence or absence of a HIF-1 alpha inhibitor. Data are representative of 3 independent experiments & are expressed as mean ± s.e.m. *p < 0.05. Image collected & cropped by CiteAb from the following publication (https://pubmed.ncbi.nlm.nih.gov/32221369), licensed under a CC-BY license. Not internally tested by Novus Biologicals.
Western Blot: HIF-1 alpha Antibody - BSA Free [NB100-479] -
Western Blot: HIF-1 alpha Antibody - BSA Free [NB100-479] - Hif1 alpha mediates Glut1 induction downstream of Bmp-mTORC1 signaling. a–c Western blot (a, c) or RT-qPCR (b) analyses in primary chondrocytes after 24 h of BMP2 treatment with or without mTOR inhibitors. Rapa: rapamycin. d Western blot analyses in primary chondrocytes in response to BMP2 with or without the Hif1 alpha inhibitors for 24 h. Quantification of all western blots denotes average fold change over vehicle control after normalization to beta -actin (±SD, n = 3). *p < 0.05, n = 3, error bar indicates SD, two-tailed Student’s t-test Image collected & cropped by CiteAb from the following publication (https://pubmed.ncbi.nlm.nih.gov/30446646), licensed under a CC-BY license. Not internally tested by Novus Biologicals.
Western Blot: HIF-1 alpha Antibody - BSA Free [NB100-479] -
Western Blot: HIF-1 alpha Antibody - BSA Free [NB100-479] - Tamoxifen administration-induced PHD2 deletion in skeletal muscle in Phd2f/f/Rosa26CreERT2 mice. a. PHD1, 2, & 3 deletion efficiency in the gastrocnemius muscles of tamoxifen-treated Phd2f/f/Rosa26CreERT2 mice was determined using qRT-PCR. Relative gene expression was determined using gastrocnemius muscle tissue cDNA (n = 3–4 mice per group). b. Anti-PHD2 & PHD3 Western blotting of gastrocnemius & soleus muscles at 6 weeks after tamoxifen administration. c. The expression of HIF-1 alpha in gastrocnemius & soleus at 5 weeks after tamoxifen administration. d. The level of hif-1 alpha mRNA in gastrocnemius at 5 weeks after tamoxifen administration. *p < 0.05; **p < 0.01 compared to control. Values are means ± SEM Image collected & cropped by CiteAb from the following publication (https://pubmed.ncbi.nlm.nih.gov/26949511), licensed under a CC-BY license. Not internally tested by Novus Biologicals.
Immunocytochemistry/ Immunofluorescence: HIF-1 alpha Antibody - BSA Free [NB100-479] -
Immunocytochemistry/ Immunofluorescence: HIF-1 alpha Antibody - BSA Free [NB100-479] - Hif1 alpha expression in neonatal & adult ovary.(A) Section of P5 ovary showing MVH expression in all oocytes & Hif1 alpha expression only in small oocytes (primary follicles; top). Negative control images without primary antibodies (bottom). Scale bar: 50μm. (B) Section of adult ovary showing absence of Hif1 alpha expression in primary follicles detected with MVH staining (top). Negative control without primary antibody (bottom). Scale bar: 50μm. (C) Section of adult ovary showing Hif1 alpha expression in mature primary oocyte (arrow). Negative control without primary antibody (bottom). Scale bar: 100μm. (D) Image of a Metaphase II oocyte from superovulated three-month-old female showing Hif1 alpha expression. Scale bar: 50μm. Image collected & cropped by CiteAb from the following publication (https://pubmed.ncbi.nlm.nih.gov/27148974), licensed under a CC-BY license. Not internally tested by Novus Biologicals.
Western Blot: HIF-1 alpha Antibody - BSA Free [NB100-479] -
Western Blot: HIF-1 alpha Antibody - BSA Free [NB100-479] - FASN Regulates HIF-alpha Protein Stability & HIF Target Gene Expression. (A) FASN siRNA downregulates HIF-alpha protein levels. PREC, HeLa & HCT116 cells treated with FASN (+) or control (−) siRNA & harvested after 72 h. Cells exposed to hypoxia (1% oxygen) or maintained in normoxia (21% oxygen) 4 h before harvesting & subjecting WCEs to WB analysis. Unmodified (250 kDa) & modified (larger) FASN bands indicated by large arrowheads, REDD1 by a small arrowhead, & HIF-1 alpha & HIF-2 alpha by arrows. Image collected & cropped by CiteAb from the following publication (https://pubmed.ncbi.nlm.nih.gov/28775317), licensed under a CC-BY license. Not internally tested by Novus Biologicals.
Immunocytochemistry/ Immunofluorescence: HIF-1 alpha Antibody - BSA Free [NB100-479] -
Immunocytochemistry/ Immunofluorescence: HIF-1 alpha Antibody - BSA Free [NB100-479] - Hif1 alpha expression in neonatal & adult ovary.(A) Section of P5 ovary showing MVH expression in all oocytes & Hif1 alpha expression only in small oocytes (primary follicles; top). Negative control images without primary antibodies (bottom). Scale bar: 50μm. (B) Section of adult ovary showing absence of Hif1 alpha expression in primary follicles detected with MVH staining (top). Negative control without primary antibody (bottom). Scale bar: 50μm. (C) Section of adult ovary showing Hif1 alpha expression in mature primary oocyte (arrow). Negative control without primary antibody (bottom). Scale bar: 100μm. (D) Image of a Metaphase II oocyte from superovulated three-month-old female showing Hif1 alpha expression. Scale bar: 50μm. Image collected & cropped by CiteAb from the following publication (https://pubmed.ncbi.nlm.nih.gov/27148974), licensed under a CC-BY license. Not internally tested by Novus Biologicals.
Western Blot: HIF-1 alpha Antibody - BSA Free [NB100-479] -
Western Blot: HIF-1 alpha Antibody - BSA Free [NB100-479] - FASN Regulates HIF-alpha Protein Stability & HIF Target Gene Expression. (B) Downregulation of HIF-1 alpha & HIF-2 alpha in HCT116 cell clones carrying the FASN gene mutagenized using CRISPR-Cas9 (See Supplementary Fig. S3 for genomic DNA information). Protein samples prepared in normoxia (left column) or hypoxia (right column) for WB analysis. Asterisk indicates a non-specific band. Image collected & cropped by CiteAb from the following publication (https://pubmed.ncbi.nlm.nih.gov/28775317), licensed under a CC-BY license. Not internally tested by Novus Biologicals.
Western Blot: HIF-1 alpha Antibody - BSA Free [NB100-479] -
Western Blot: HIF-1 alpha Antibody - BSA Free [NB100-479] - Effect of silencing Cx43 on the expression of HIF-1 alpha in astrocytes.Astrocytes were transfected with NT-siRNA or with Cx43-siRNA. At the indicated times the expression of HIF-1 alpha & Cx43 was analysed by Western blot. A) Representative Western blot of HIF-1 alpha, Cx43 & GAPDH showing that the decrease in Cx43 expression was concomitant with HIF-1 alpha up-regulation. B) HIF-1 alpha quantification. C) Cx43 quantification. The results are expressed as percentages of the level found in the NT-siRNA condition at time 0. ***p<0.001 versus the corresponding NT-siRNA values. Image collected & cropped by CiteAb from the following publication (https://dx.plos.org/10.1371/journal.pone.0032448), licensed under a CC-BY license. Not internally tested by Novus Biologicals.
Western Blot: HIF-1 alpha Antibody - BSA Free [NB100-479] -
Western Blot: HIF-1 alpha Antibody - BSA Free [NB100-479] - HDGF triggered AKT/HIF-1 alpha /NF-kappa B signaling in SCC4 oral cancer cells. a-d Cells were treated with recombinant HDGF (1–100 ng/ml) for 24 h & then harvested for total protein extraction. The cell lysates were separated by SDS-PAGE & detected by Western blotting with the indicated primary antibodies. beta -actin was used as an internal control for loading & transfer. Data were mean of three experiments. *, P < 0.05; **, P < 0.01; ns, not statistically significant Image collected & cropped by CiteAb from the following publication (https://pubmed.ncbi.nlm.nih.gov/31711427), licensed under a CC-BY license. Not internally tested by Novus Biologicals.
Western Blot: HIF-1 alpha Antibody - BSA Free [NB100-479] -
Western Blot: HIF-1 alpha Antibody - BSA Free [NB100-479] - Cofilin phosphorylation is HIF-1 alpha dependent.Wt, shC, & the HIF-1 alpha knock down cell clones c1 & c2 cells were lysed after 24 hrs of normoxia (20% O2) or hypoxia (1% O2). Cell extracts were analysed by Western blots. Note that p-cofilin levels are reduced in c2 & c2 cells compared to wt & shC cells at 20% O2 & 1% O2. Image collected & cropped by CiteAb from the following publication (https://dx.plos.org/10.1371/journal.pone.0069128), licensed under a CC-BY license. Not internally tested by Novus Biologicals.
Western Blot: HIF-1 alpha Antibody - BSA Free [NB100-479] -
Western Blot: HIF-1 alpha Antibody - BSA Free [NB100-479] - Genotyping of transgenes.PCR genotyping was performed for all four transgenes as described in materials & methods. Sizes of the amplified products obtained are: 240 bp for Hif-1 alpha (wild type); 274 bp for Hif-1 alpha flox/flox; 410 bp for Hif-2 alpha (wild type); 444bp for Hif-2 alpha flox/flox; 370 bpfor Cre transgene; 350 bpfor rtTA transgene. One representative sample was genotyped for the four transgenes from each of three generated mouse strains: SPC-rtTA-/tg/(tetO)7-Cre-/tg/Hif-1 alpha fl/fl (Lane 1), SPC-rtTA-/tg/(tetO)7-Cre-/tg/Hif-2 alpha fl/fl mouse (Lane 2), & SPC-rtTA-/tg/(tetO)7-Cre-/tg/Hif-1 alpha /2 alpha fl/fl (Lane 3)). Image collected & cropped by CiteAb from the following publication (https://dx.plos.org/10.1371/journal.pone.0139270), licensed under a CC-BY license. Not internally tested by Novus Biologicals.
Western Blot: HIF-1 alpha Antibody - BSA Free [NB100-479] -
Western Blot: HIF-1 alpha Antibody - BSA Free [NB100-479] - Effect of 24 h UO on renal HIF-1 alpha /2 alpha expression.WT mice were exposed to either sham-operation or left UO, which continued for 24 hours, & then was released. The left kidneys were harvested immediately (d0), 2, 4 or 7 days after release of obstruction (n = 4 at each time point). Immunoblot analyses of HIF-1 alpha & HIF-2 alpha in left kidneys were then performed & co-detection of TBP was performed to assess equal loading. HIF protein bands were quantified & normalized to TBP. Data were expressed as mean ± SD, & the mean value obtained from non-operated control mice was arbitrarily defined as 1. *, p<0.05 versus sham-operated controls; **, p<0.05 versus all the other groups. C, non-operated controls; S, sham-operated controls. Image collected & cropped by CiteAb from the following publication (https://pubmed.ncbi.nlm.nih.gov/22295069), licensed under a CC-BY license. Not internally tested by Novus Biologicals.
Immunocytochemistry/ Immunofluorescence: HIF-1 alpha Antibody - BSA Free [NB100-479] -
Immunocytochemistry/ Immunofluorescence: HIF-1 alpha Antibody - BSA Free [NB100-479] - Hif1 alpha expression in 15.5dpc germ cells.(A) Sections of male (top) & female (bottom) gonads from 15.5 dpc Oct4-GFP embryos showing Oct4-GFP & Hif1 alpha expressions in germ cells. Scale bars: 50μm (male) & 20μm (female). (B) FACS-sorted male (top) & female (bottom) 15.5dpc germ cells showing Oct4-GFP & Hif1 alpha expressions. Scale bars: 100μm (male) & 50μm (female). Image collected & cropped by CiteAb from the following publication (https://pubmed.ncbi.nlm.nih.gov/27148974), licensed under a CC-BY license. Not internally tested by Novus Biologicals.
Western Blot: HIF-1 alpha Antibody - BSA Free [NB100-479] -
Western Blot: HIF-1 alpha Antibody - BSA Free [NB100-479] - Effect of ET-1 on glucose uptake in HIF-1 alpha -silenced astrocytes.Astrocytes were transfected with NT-siRNA or with HIF-1 alpha -siRNA. After 48 h, astrocytes were incubated in the absence (control, C) or presence of 0.1 µM ET-1 for 24 h. A) HIF-1 alpha, Hx-1, GLUT-3, Hx-2, GLUT-1 & GAPDH Western blots & quantification. The results are the means ± SEM of at least three independent experiments & they are expressed as percentages of the level found in the control NT-siRNA. B) Glucose uptake expressed as pmol of 2-deoxyglucose (2-DG) taken up per hour & per milligram of protein. The results show that the down-regulation of HIF-1 alpha levels promoted by HIF-1 alpha -siRNA decreased the rate of glucose uptake & the expression of GLUT-1, GLUT-3, Hx-1 & Hx-2, both in the control & in the ET-1 treated astrocytes. ***p<0.001, **p<0.01 & *p<0.05 versus the corresponding controls (C); ###p<0.001, ##p<0.01 & #p<0.05 versus the corresponding NT-siRNA. Image collected & cropped by CiteAb from the following publication (https://dx.plos.org/10.1371/journal.pone.0032448), licensed under a CC-BY license. Not internally tested by Novus Biologicals.
Western Blot: HIF-1 alpha Antibody - BSA Free [NB100-479] -
Western Blot: HIF-1 alpha Antibody - BSA Free [NB100-479] - Effect of ET-1 & Cx43 on HIF-1 alpha expression & glucose uptake when c-Src is inhibited.Astrocytes were preincubated with 100 ng/µL PP2 (c-Src inhibitor) or 100 ng/µL PP3 (inactive analogue) for 1 h. Then, cells were incubated in the absence (control) or presence of 0.1 µM ET-1 for 24 h. A) HIF-1 alpha Western blot & quantification. The results are expressed as percentages of the level found in the controls treated with PP3 & they show that the inhibitor of c-Src PP2 prevented the up-regulation of HIF-1 alpha promoted by ET-1. ***p<0.001 versus the absence of ET-1. B) Glucose uptake expressed as pmol of 2-deoxyglucose taken up per hour & per milligram of protein. The results show that the inhibitor of c-Src PP2 prevented the increase in the rate of glucose uptake promoted by ET-1. ***p<0.001 versus the absence of ET-1. C) Astrocytes were preincubated with 100 ng/µL PP2 or 100 ng/µL PP3 for 1 h. Then, cells were transfected with NT-siRNA or with Cx43-siRNA & after 48 h HIF-1 alpha was analysed by Western blot. The results are expressed as percentages of the level found in the PP3 NT-siRNA & they show that the inhibitor of c-Src PP2 prevented the up-regulation of HIF-1 alpha promoted by silencing Cx43. ***p<0.001 versus the corresponding NT-siRNA. Image collected & cropped by CiteAb from the following publication (https://dx.plos.org/10.1371/journal.pone.0032448), licensed under a CC-BY license. Not internally tested by Novus Biologicals.
Western Blot: HIF-1 alpha Antibody - BSA Free [NB100-479] -
Western Blot: HIF-1 alpha Antibody - BSA Free [NB100-479] - Hypoxia reduces inflammatory processes & induces autophagy in Il-10−/− mice. a, b, c, d, e, f & g WT, Nrlp3−/−,Il-10−/−, & Il-10−/−Nrlp3−/−double knockout mice were subjected to normoxia (N, 21% O2) or hypoxia (H, 8% O2). After 18 h, mice were killed & colon biopsies were collected. Statistical analysis was performed using one-way ANOVA followed by Tukey’s post-test. Results represent mean + s.e.m., WT mice under normoxia: n = 5, WT mice under hypoxia: n = 5; Nrlp3−/− mice under normoxia: n = 4; Nrlp3−/− mice under hypoxia: n = 5; Il-10−/− mice under hypoxia: n = 4; Il-10−/− mice under hypoxia: n = 4; Il-10−/−Nrlp3−/− mice under normoxia: n = 7; Il-10−/−Nrlp3−/− mice under hypoxia: n = 9, *P < 0.05; **P < 0.01; ***P < 0.001. h Total protein was isolated & western blot performed. LC3-I & LC3-II bands were quantified, & autophagy was measured by variations in the ratio of LC3-II/LC3-I & the total amount of LC3 (LC3-I plus LC3-II) relative to beta -actin Image collected & cropped by CiteAb from the following publication (https://pubmed.ncbi.nlm.nih.gov/28740109), licensed under a CC-BY license. Not internally tested by Novus Biologicals.
Western Blot: HIF-1 alpha Antibody - BSA Free [NB100-479] -
Western Blot: HIF-1 alpha Antibody - BSA Free [NB100-479] - Hypoxia reduces inflammatory processes & induces autophagy in the DSS mouse model of colitis. a, b, c, d, e, f & g WT & Nrlp3−/− mice were administered with DSS or DSS-free water & subjected to normoxia (N, 21% O2) or hypoxia (H, 8% O2). After 18 h, mice were killed & colon biopsies were collected. Statistical analysis was performed using one-way ANOVA followed by Tukey’s post-test. Results represent mean + s.e.m., WT mice under normoxia: n = 5, WT mice under normoxia: n = 5, DSS-treated WT mice under normoxia: n = 6; Nrlp3−/− mice under normoxia: n = 5; DSS-treated Nrlp3−/− mice under normoxia: n = 6; WT mice under hypoxia: n = 4, DSS-treated WT mice under hypoxia: n = 5; Nrlp3−/− mice under hypoxia: n = 3; DSS-treated Nrlp3−/− mice under hypoxia: n = 3, *P < 0.05; **P < 0.01; ***P < 0.001. h Total protein was isolated & western blot performed. LC3-I & LC3-II bands were quantified, & autophagy was measured by variations in the ratio of LC3-II/LC3-I & the total amount of LC3 (LC3-I plus LC3-II) relative to beta -actin Image collected & cropped by CiteAb from the following publication (https://pubmed.ncbi.nlm.nih.gov/28740109), licensed under a CC-BY license. Not internally tested by Novus Biologicals.
Western Blot: HIF-1 alpha Antibody - BSA Free [NB100-479] -
Western Blot: HIF-1 alpha Antibody - BSA Free [NB100-479] - Effect of HIF-1 alpha silencing on alpha -MSH-induced apoptosis in B16-F10 melanoma cells during hypoxia.a Cells were transfected with shLacZ or shHIF-1 alpha plasmids for 48 h before harvest. HIF-1 alpha shRNA reduced the basal HIF-1 alpha mRNA & protein expression levels. b, c Relative mRNA expression levels were analyzed by real-time PCR. Data are expressed as fold change compared with control (means ± SD of triplicate experiments). d Cell lysates were analyzed by immunoblot using the indicated antibodies. beta -Actin was used as an internal control for loading & transfer. e The population of apoptotic cells was analyzed by flow cytometry & qualified as mean ± SD from triplicate experiments. *p < 0.05, **p < 0.01. Knockdown of HIF-1 alpha diminished alpha -MSH-induced apoptosis in B16-F10 melanoma cells during hypoxia Image collected & cropped by CiteAb from the following publication (https://pubmed.ncbi.nlm.nih.gov/30062060), licensed under a CC-BY license. Not internally tested by Novus Biologicals.
Western Blot: HIF-1 alpha Antibody - BSA Free [NB100-479] -
Western Blot: HIF-1 alpha Antibody - BSA Free [NB100-479] - FASN & CAD Binding Specificity of pVHL Mutants Derived from VHL Patients. (A) Schematic representation of pVHL domains. Dotted lines indicate the approximate positions of the HIF-1 alpha & Elongin C binding domains. The alpha & beta structural domains are also indicated. (B) Effects of pVHL mutations on interactions with E3 ligase components, HIF-alpha & other interacting proteins including FASN. pVHL mutants were stably expressed by lentiviral vectors in HCT116 cells, & WCEs were tested in precipitation assays. Note that the mutant pVHL-W88S almost completely lost the ability to bind to HIF-1 alpha & HIF-2 alpha, whereas pVHL-Y112H retains this ability almost completely. However, both pVHL-W88S & pVHL-Y112H show significantly reduced binding to FASN & CAD, as indicated by small & large asterisks, respectively. Arrows indicate HIF-1 alpha & HIF-2 alpha bands. Long arrows & arrowheads indicate unmodified & modified forms of FASN, respectively. Protein samples prepared from hypoxia (1% oxygen)-exposed cells were added as positive control in left-end extra lanes. (C) The same samples as used in B were analyzed by silver staining. The E3 ligase components appear as major bands as indicated. (D) Subcellular localization of stably expressed pVHL mutants in 786-O. pVHL-Y112H & pVHL-W88S showed preferential nuclear localization, whereas pVHL-WT & pVHL-H115Q which both strongly bind to FASN & CAD, showed cytoplasmic localization. Cells showing clear nuclear (C < N) or cytoplasmic (C > N) localization in three microscopic viewing areas were counted as shown in the lower panel. The total counted cell numbers ranged from 35 to 64. The experiments were repeated more than twice, except for the cell localization count, & the results were reproduced. Image collected & cropped by CiteAb from the following publication (https://pubmed.ncbi.nlm.nih.gov/28775317), licensed under a CC-BY license. Not internally tested by Novus Biologicals.
Western Blot: HIF-1 alpha Antibody - BSA Free [NB100-479] -
Western Blot: HIF-1 alpha Antibody - BSA Free [NB100-479] - Hypoxia signaling & cytotoxicity to CdCl2. (a) Wild-type (WT) cells were left untreated (Ctrl) or exposed to 150 μM CoCl2 (Co2+), 1, 5 or 10 μM CdCl2 (Cd2+) or 150 μM CoCl2 & 10 μM CdCl2 for 24 hours. HIF1 alpha −/− cell extract treated with 150 μM CoCl2 was used as a negative control. Nuclear protein was extracted & separated by SDS-PAGE, transferred to nitrocellulose membrane & probed with a HIF1 alpha (upper panel) or beta -actin (lower panel) specific antibody. The bands observed in the cadmium only WT cells are nonspecific as they are also observed in the HIF1 alpha −/− cells. (b) BNip3 mRNA expression levels were analyzed by qRT-PCR in wild type (WT, white bars) & HIF1 alpha −/− cells (black bars). Cells were left untreated (0), or exposed to 5 μM CdCl2 (Cd2+) or 150 μM CoCl2 (Co2+) for 24 hours. Each value was normalized to the control level in the corresponding cell line. *P < 0.05 compared to the corresponding controls, n = 4. (c) BNIP3 protein levels were determined in wild type & HIF1 alpha −/− cells after treatment with 150 μM CoCl2 (Co2+) or 5 μM CdCl2 (Cd2+) for 24 hours using a BNIP3 specific antibody & beta -actin was used as a loading control (lower Panel). Image collected & cropped by CiteAb from the following publication (https://pubmed.ncbi.nlm.nih.gov/21811500), licensed under a CC-BY license. Not internally tested by Novus Biologicals.
Immunocytochemistry/ Immunofluorescence: HIF-1 alpha Antibody - BSA Free [NB100-479] -
Immunocytochemistry/ Immunofluorescence: HIF-1 alpha Antibody - BSA Free [NB100-479] - FIH exits the nucleus via a Leptomycin B-sensitive exportin1-dependent pathway. (A) Immunofluorescence staining of FIH (green) & HIF1 alpha (red) in MCF7 cells after the indicated hypoxia (0.5% O2) & re-oxygenation treatments. TO-PRO-3 (blue) was used to stain nuclei. (B) Total cell lysates from U2OS cells were immunoprecipitated with an anti-exportin1 antibody or control IgG. FIH, exportin1 & beta -tubulin levels are indicated. (C) Immunofluorescence staining of FIH (green) in FIH-null mouse embryonic fibroblasts (MEFs) transfected with HA-FIH 1–349 or HA-FIH delta NES followed by normoxia, hypoxia (1% O2, 3 h) or 3 h of hypoxia followed by re-oxygenation for 1 h. TO-PRO-3 (blue) was used to stain nuclei. Arrows indicate nuclear localization of signal. (D) Total cell lysates from U2OS cells transfected with control vector, HA-FIH 1–349 or HA-FIH delta NES were immunoprecipitated with an anti-exportin 1 antibody. HA-FIH, exportin1 & beta -tubulin levels are indicated. FL, full length; IgGL, IgG light chain. Scale bars: 20 µm. Image collected & cropped by CiteAb from the following publication (https://pubmed.ncbi.nlm.nih.gov/30333145), licensed under a CC-BY license. Not internally tested by Novus Biologicals.
Western Blot: HIF-1 alpha Antibody - BSA Free [NB100-479] -
Western Blot: HIF-1 alpha Antibody - BSA Free [NB100-479] - Phagocyte infiltration contributes to the respiratory burst & consequent EPO signalling activation during inflammation resolution.ZymA (i.p., 1 mg per mouse) was applied to induce peritonitis in male WT mice. (a–c) Mice were treated with either 0.5 mg per mice i.p. of anti-Ly6G antibody or control (isotype control rat IgG2a) 1.5 day before zymA injection, & exudate leucocytes, peritoneum & peritoneal fluid were collected for analysis of ROS (a, n=3), hypoxia, HIF-1 alpha (b, n=3) & EPO (c, n=3) at 6 24 h. (d–f) Mice were treated with either anti-Ly6G antibody (0.5 mg per mice) plus clodronate liposomes (0.2 ml per 10 g) or control (isotype antibody+empty liposome) before zymA injection, & exudate leucocytes, peritoneum & peritoneal fluid were collected for analysis of ROS (d, n=3), hypoxia, HIF-1 alpha (e, n=3) & EPO (f, n=3) at 24 h. Representative data from two independent experiments are shown. For flow cytometry data, black numbers refer to the percentage of positive cells & red numbers refer to the mean fluorescent intensity. Error bars represent the s.e.m. *P<0.05, two-tailed unpaired Student's t-test. Full-size images for b & e are shown in Supplementary Fig. 12. Image collected & cropped by CiteAb from the following publication (https://pubmed.ncbi.nlm.nih.gov/27397585), licensed under a CC-BY license. Not internally tested by Novus Biologicals.
Chromatin Immunoprecipitation: HIF-1 alpha Antibody - BSA Free [NB100-479] -
Chromatin Immunoprecipitation: HIF-1 alpha Antibody - BSA Free [NB100-479] - Hypoxia reduces inflammatory signaling pathways & NLRP3 expression & induces autophagy in IECs. a HT-29 cells were subjected to normoxia & hypoxia at the indicated times in the absence or presence of 10 µg/ml LPS. Autophagy was measured by variations in the ratio of LC3-II/LC3-I & the total amount of LC3 (LC3-I plus LC3-II) relative to beta -actin. Results are representative of two independent experiments. b, c & d HT-29 cells were subjected to normoxia & hypoxia for the indicated periods in the absence or presence of 10 µg/ml LPS, followed by transcript analysis. Statistical analysis was performed using one-way ANOVA followed by Tukey’s post-test. Results represent mean + s.e.m. of two independent experiments done in triplicate, *P < 0.05; **P < 0.01; ***P < 0.001; ns not significant. e HT-29 cells were subjected to normoxia or hypoxia in the presence & absence of 10 µg/ml LPS & 20 µM of MG132. Results are representative of two independent experiments. f & g Putative binding sites for HIF-1 alpha & NF-kappa B were found in the p62 f & NLRP3 g promoters using Genomatix software tools. Numbers under the boxes indicate the distance from the transcription start site. HT-29 cells were subjected to normoxia (21% O2) or hypoxia (0.2% O2) for 6 h & 24 h. ChIP analysis was performed using antibodies against HIF-1 alpha & NF-kappa B for immunoprecipitation. PCR was performed using the promoter-specific primers for the p62 f & NLRP3 g promoter binding sites of HIF-1 alpha & NF-kappa B. Aliquots taken prior to immunoprecipitation were used as input control. PCR products were run on 2% agarose gel. The results are representative of three independent experiments. Image collected & cropped by CiteAb from the following publication (https://pubmed.ncbi.nlm.nih.gov/28740109), licensed under a CC-BY license. Not internally tested by Novus Biologicals.
Western Blot: HIF-1 alpha Antibody - BSA Free [NB100-479] -
Western Blot: HIF-1 alpha Antibody - BSA Free [NB100-479] - Effect of Hif1a deletion upon growth & invasion. (A) Wild-type (WT) mammary tumor epithelial cells (MTECs) grown to 80% confluence subjected to hypoxic culture for the indicated times up to 24 hours, or cells continued to be cultured under normoxic conditions such that the time t = 0 sample harvested on the same day as the time t = 24 hours hypoxic condition sample. High-salt enriched whole-cell extracts resolved on 3% to 8% Tris-acetate gels & blotted onto polyvinylidene fluoride membrane, which divided horizontally at approximately 60 kDa. The top half of the blot used to detect HIF-1 alpha, & the lower portion used to detect lamin (loading control) to avoid the need to strip & reprobe the blot. (B) Growth curve of WT & knockout (KO) MTECs cultured at normoxia (Nor) or hypoxia (Hyp) in growth medium supplemented w/ 5% fetal bovine serum (FBS) + epidermal growth factor (EGF) (left) or w/ 2% FBS (right). For cells grown in 5% FBS + EGF, a representative graph is shown in which the mean ± SEM of cell number per time point of quadruplicate wells per genotype/oxygen tension is plotted per time point. For cells grown in 2% FBS, the grand mean ± SEM of cell number is presented, which calculated as an average of the mean cell number observed per replicates per time point as observed in three replicate experiments. All data analyzed by two-way analysis of variance (ANOVA, *P < 0.05). (C) The mean fold change (FC) in invasion normalized to invasion index observed for WT cells cultured at normoxia (FC = 1.0). Data represent the mean FC in invasion observed in three independent experiments. All columns compared using one-way ANOVA w/ a Bonferroni posttest. *P < 0.05. Image collected & cropped by CiteAb from the following publication (http://breast-cancer-research.biomedcentral.com/articles/10.1186/bcr3087), licensed under a CC-BY license. Not internally tested by Novus Biologicals.
Western Blot: HIF-1 alpha Antibody - BSA Free [NB100-479] -
Western Blot: HIF-1 alpha Antibody - BSA Free [NB100-479] - Involvement of HIF-1 alpha in alveolar epithelial cell phenotypic changes induced by hypoxia. Primary rat AECs were cultured in normoxia (Nx) (21% O2) or hypoxia (Hx) (1.5% O2) during 6 days in presence or absence of 10 µM YC-1. (A) Immunostaining of ZO-1 (magenta) & TTF1 (cyan) were performed. n = 4 experiments were performed. Isolated primary rat AECs were cultured in normoxia (Nx) (21% O2) or hypoxia (Hx) (1.5% O2) during 6 h in the presence or absence of 100 mM 4-phenylbutyrate (4-PBA) or pre-treated or not with 1 µM BAPTA-AM 90 min before exposition to hypoxia. A representative picture of at least n = 4 independent experiments for each condition has been presented & scale bar represents 50 µm. (B) Western blot of HIF-1 alpha protein levels was performed. Representative blot of n = 5 experiments is shown. Expression levels of HIF-1 alpha were quantified & reported to beta -actin expression for each condition. Primary rat AECs were transfected with plasmid coding for luciferase reporter activity of hypoxia responsive element (HRE: i.e., HIF-luc), & cultured as described. (C) Luciferase activity corresponding to the transcriptional capacity of HIF was reported (n = 4 experiments). Raw data were submitted a Kruskal-Wallis test. * & ** indicate a significant difference as compared with normoxic value with p < 0.05 & p < 0.01 respectively. # & ## indicate a significant difference as compared with value in untreated hypoxic cells with p < 0.05 & p < 0.01, respectively. Image collected & cropped by CiteAb from the following publication (https://pubmed.ncbi.nlm.nih.gov/30875855), licensed under a CC-BY license. Not internally tested by Novus Biologicals.
Western Blot: HIF-1 alpha Antibody - BSA Free [NB100-479] -
Western Blot: HIF-1 alpha Antibody - BSA Free [NB100-479] - Pharmacological inhibition of ABCC3 reduces cell proliferation through STAT3 & HIF1 alpha dysregulation & induction of apoptosis. a Representative Western blot images show the effects of pharmacological inhibition of ABCC3 with MCI-715 on the expression of pSTAT3 Y705 & HIF1 alpha in three PDAC cell lines (AsPC1, HPAFII, CFPAC-1). Cells were treated with MCI-715 at the concentration of 10 μM & collected after 24 h (CFPAC-1) or 48 h (AsPC1, HPAFII). The quantitative analysis of n = 3 separate experiments is presented in Additional file 1: Figure S2; b The effects of the treatment of AsPC1, HPAFII & CFPAC-1 cell lines with 10 μM MCI-715 on the Caspase 3/7 activity (72 h post treatment) measured with Caspase 3/7 fluorigenic probe; c Representative Western blotting images & quantitative analysis of cleaved caspase 3 expression following treatment of indicated PDAC cell lines with 10 μM MCI-715. All results are presented as mean ± SEM of 3 independent experiments. The quantitative analysis was performed with the use of ImageJ & Image Lab software, unpaired Student’s t-test was performed for statistical analysis, *p < 0.05, **p < 0.01, ***p < 0.001, ****p < 0.0001 Image collected & cropped by CiteAb from the following publication (https://pubmed.ncbi.nlm.nih.gov/31378204), licensed under a CC-BY license. Not internally tested by Novus Biologicals.
Western Blot: HIF-1 alpha Antibody - BSA Free [NB100-479] -
Western Blot: HIF-1 alpha Antibody - BSA Free [NB100-479] - Normoxic pretreatment sensitizes glioma cells to radiation after rapid acute hypoxic (RAH) exposure.(A) The rapid acute hypoxia (RAH) protocol is shown depicting the timing & severity of hypoxic exposure. Cells either remain in a continuous hypoxic environment (–) or are transiently (25 min) exposed to normoxia 25 min prior to radiation (+). Continuously normoxic cells (NOx) were irradiated as a positive control. (B) The results of anchorage-independent colony forming assays are shown for U87, U87-luc, GL261 glioma cells & 0308 GSCs after 5 Gy radiation exposure under varying oxygen conditions. To allow for ease of comparisons among cell types, raw values are expressed as a percentage of the corresponding cell type’s negative (non-irradiated) control & the means & SEMs are plotted. Each result represents at least three independent samples, plated in triplicate. Holm-Sidak comparisons for multiple groups were used for statistical comparisons of raw values (**p<0.01). Also shown are Western blots of nuclear HIF-1 alpha at the time of irradiation for each cell type. Corresponding Western blots of lamin A/C are shown as a loading control. All lanes shown that are non-adjacent to the negative control (NOx) are denoted with a separating black line. Image collected & cropped by CiteAb from the following publication (https://pubmed.ncbi.nlm.nih.gov/25350400), licensed under a CC-BY license. Not internally tested by Novus Biologicals.
Western Blot: HIF-1 alpha Antibody - BSA Free [NB100-479] -
Western Blot: HIF-1 alpha Antibody - BSA Free [NB100-479] - Multiple distinct mechanisms for downregulation of AKT activity in TSC1/2-deficient SCs. A-F: Western blots of sciatic nerve lysates from control & TSC2-SCKO/TSC1-SCKO mice at age P28 (A-E) or P14 (F) (3 mice per group), probed with the indicated antibodies. G: Immunofluorescence of longitudinal frozen sciatic nerve sections from control & TSC2-SCKO mice (age P28) showing greatly increased immunoreactivity of PTEN in the mutant (cytoplasmic signals surrounding DAPI+ nuclei). Scale bars: 50 µm H: Schematic summarizing distinct mechanisms underlying the downregulation of AKT activity in SCs from TSC1/2-SCKO nerves. Components highlighted in red are upregulated while blue highlighting depicts downregulation in mutant nerves. Note downregulation of insulin receptor substrate 1 (IRS-1) by constitutively active S6 kinases downstream of mTORC1. This leads to attenuated activation of PI3K/AKT. Lack of mTORC2 stimulation occurs through abolished TSC1/2 which results in reduced AKT phosphorylation in position Ser473 as well as through feedback inhibition by S6 kinases. Lastly, hyperactive mTORC1 promotes Hif1 alpha transcription factor expression which results in increased PTEN transcription, & thus attenuated PI3K/AKT signaling. Image collected & cropped by CiteAb from the following publication (https://pubmed.ncbi.nlm.nih.gov/29497474), licensed under a CC-BY license. Not internally tested by Novus Biologicals.
Western Blot: HIF-1 alpha Antibody - BSA Free [NB100-479] -
Western Blot: HIF-1 alpha Antibody - BSA Free [NB100-479] - DLK1 cleavage is dependent on HIFs & ADAM 17 activity.a, b Representative images & densitometric analysis of western blots showing HIF-1 alpha, HIF-2 alpha, & DLK1 expression & cleavage in U3082MG cells after siRNA targeting of HIF1A & HIF2A in hypoxia. c, d Representative images & densitometric analysis of western blots showing the effects of ADAM inhibition by pre-treatment with 20 µM TAPI-2 on DLK1 cleavage in U3082MG cells grown at 21% or 1% O2 for 48 h. SDHA was used as loading control. e, f Representative images & densitometric analysis of western blots showing the effects of ADAM17 inhibition by pre-treatment with 0.5 μM TMI-1 on DLK1 cleavage in U3082MG cells grown at 21% or 1% O2 for 48 h. SDHA was used as loading control. Statistical analysis: b has 3 independent experiments while d & f have four independent experiments, all data are expressed as mean ± SEM. Statistical significance was determined by one-way ANOVA, followed by Bonferroni post hoc test. In the whole figure significance is represented as *p < 0.05, **p < 0.01, & ***p < 0.001 vs. respective 21% O2 controls or as indicated by straight lines. Image collected & cropped by CiteAb from the following publication (https://pubmed.ncbi.nlm.nih.gov/32205867), licensed under a CC-BY license. Not internally tested by Novus Biologicals.
Western Blot: HIF-1 alpha Antibody - BSA Free [NB100-479] -
Western Blot: HIF-1 alpha Antibody - BSA Free [NB100-479] - Hypoxia downregulates MHC class I expression via HIF transcription factors.(A-C): siRNA mediated knockdown of HIF-1 alpha reversed hypoxic downregulation of MHC class I expression as compared with the scrambled, non-targeting (NT) siRNA control. MCA205 tumor cells were reverse transfected with scrambled siRNA (NT; red histogram) or with HIF-1 alpha specific siRNA (blue histogram) & cultured as 3D spheroids under 1% (A) or 21% (B) oxygen for 48h. Levels of MHC class I surface expression was determined using flow cytometry. Efficacy of gene knockdown was assessed using Western blot (C). beta -Actin was used as the loading control. Representative data of 3 independent experiments shown. (D-F): Flow cytometry assessment of surface expression of HLA-ABC on paired isogenic renal cell carcinoma cell lines RCC4 (D), UMRC2 (E) & CAKI2 (F). Each pair had the parental cell line that lacked endogenous wild-type VHL (VHL null, transfected with empty vector) & one with vector stably expressing functional VHL (VHL restored). Restoring VHL function & thereby reducing HIF expression, significantly increased HLA-ABC expression on the cells. Representative histograms of 4 independent experiments are shown. Grey filled: unstained control; red: VHL null genotype; blue: VHL restored genotype. (D1-F1): Inactivation of HIF-1 alpha by restoring VHL expression was verified by Western blotting for RCC4 (D1), UMRC2 (E1) & CAKI2 (F1) cells. beta -Actin was used as the loading control. Image collected & cropped by CiteAb from the following publication (https://dx.plos.org/10.1371/journal.pone.0187314), licensed under a CC-BY license. Not internally tested by Novus Biologicals.
Western Blot: HIF-1 alpha Antibody - BSA Free [NB100-479] -
Western Blot: HIF-1 alpha Antibody - BSA Free [NB100-479] - Effect of ET-1 & Cx43 on HIF-1 alpha expression & glucose uptake when c-Src is inhibited.Astrocytes were preincubated with 100 ng/µL PP2 (c-Src inhibitor) or 100 ng/µL PP3 (inactive analogue) for 1 h. Then, cells were incubated in the absence (control) or presence of 0.1 µM ET-1 for 24 h. A) HIF-1 alpha Western blot & quantification. The results are expressed as percentages of the level found in the controls treated with PP3 & they show that the inhibitor of c-Src PP2 prevented the up-regulation of HIF-1 alpha promoted by ET-1. ***p<0.001 versus the absence of ET-1. B) Glucose uptake expressed as pmol of 2-deoxyglucose taken up per hour & per milligram of protein. The results show that the inhibitor of c-Src PP2 prevented the increase in the rate of glucose uptake promoted by ET-1. ***p<0.001 versus the absence of ET-1. C) Astrocytes were preincubated with 100 ng/µL PP2 or 100 ng/µL PP3 for 1 h. Then, cells were transfected with NT-siRNA or with Cx43-siRNA & after 48 h HIF-1 alpha was analysed by Western blot. The results are expressed as percentages of the level found in the PP3 NT-siRNA & they show that the inhibitor of c-Src PP2 prevented the up-regulation of HIF-1 alpha promoted by silencing Cx43. ***p<0.001 versus the corresponding NT-siRNA. Image collected & cropped by CiteAb from the following publication (https://dx.plos.org/10.1371/journal.pone.0032448), licensed under a CC-BY license. Not internally tested by Novus Biologicals.
Western Blot: HIF-1 alpha Antibody - BSA Free [NB100-479] -
Western Blot: HIF-1 alpha Antibody - BSA Free [NB100-479] - HIF-1 alpha protein increases in HCT116 cells exposed to rapid intermittent hypoxia. Increased HIF-1 alpha increases HIF-1 transactivation, leading to increased expression of HIF-1 target genes at both the mRNA & protein level. (A) Rapid intermittent hypoxia increases HIF-1 alpha protein after 6 h of exposure. (B) Rapid intermittent hypoxia increases the mRNA expression of genes involved in glycolysis, extracellular matrix remodeling & the HIF pathway after 18 h of exposure. (C) Additional genes with known hypoxia response elements (HRE) binding sites for HIF-1 were measured & all tested genes showed an increase in both chronic hypoxia & intermittent hypoxia after 18 h. All values were normalized to normoxic expression levels, which is equivalent to 0 on the Log2 scale. Results are the mean ± SEM of independent experiments run in duplicate (n ≥ 3). (D) The increase in mRNAs is also reflected in an increase in the protein levels of Glut1, HK2, LDHA & PHD2. * p < 0.05, ** p < 0.01, *** p < 0.001 & **** p < 0.0001. Image collected & cropped by CiteAb from the following publication (https://pubmed.ncbi.nlm.nih.gov/30669593), licensed under a CC-BY license. Not internally tested by Novus Biologicals.
Western Blot: HIF-1 alpha Antibody - BSA Free [NB100-479] -
Western Blot: HIF-1 alpha Antibody - BSA Free [NB100-479] - Hif1 alpha expression in neonatal & adult testis.(A) Section of testis from 5-day old (P5) male new born pups showing Hif1 alpha expression in MVH+ gonocytes within the seminiferous tubules (top) & negative control images without primary antibodies (bottom). Scale bar: 50μm. (B) Western blot analysis of Hif1 alpha expression in P5 testes (left) compared to extract of the adult brain sub-ventricular zone (SVZ) (right). Loading control ( beta -Actin) is shown below. (C) Section of adult (3 month old) testis showing Hif1 alpha expression in spermatogonia. Scale bar: 30μm. (D) Western blot analysis of whole adult testis. HEK293 cells treated with DFX were used as a positive control & intestinal tissue was used as a negative control. Loading control ( beta -Actin) is shown below. Image collected & cropped by CiteAb from the following publication (https://pubmed.ncbi.nlm.nih.gov/27148974), licensed under a CC-BY license. Not internally tested by Novus Biologicals.
Western Blot: HIF-1 alpha Antibody - BSA Free [NB100-479] -
Western Blot: HIF-1 alpha Antibody - BSA Free [NB100-479] - Roles of P38 mitogen-activated protein kinase (MAPK) in the DFO-mediated up-regulate of HIF-1 alpha protein in APPsw cells. (A) APPsw were exposed to 100 μM Fe, 100 μM DFO, or both combined for 24 h. Whole cell lysates were prepared & subjected to analysis for P38 or GAPDH protein. (B) Western blot analysis revealed that strong phosphorylation of P38 MAPK was detected in the DFO-treated cells, whereas no significant changes were observed in cells treated Fe alone compared with control. There were not statistical changes in the levels of P38 MAPK among the groups. The data represent the mean ± S.E. of three independent experiments. *p < 0.05, **p < 0.01 compared with the control; #p < 0.05, ##p < 0.01 with respect to the Fe treatment group. (C–E) APPsw cells were pretreated without or with SB203580 (10 μM) for 2 h & then treated without or with DFO for additional 22 h in the absence or presence of the inhibitor. Immunoblotting showed that DFO treatment significantly increased the levels of p-P38 MAPK compared with the control group, whereas the increase was significantly ameliorated by SB203580. Furthermore, the DFO-mediated up-regulation of HIF-1 alpha protein was greatly inhibited by SB203580. The data represent the mean ± S.E. (n = 3). **p < 0.01 compared with the control; ##p < 0.01 compared to the values of DFO treatment group (two-way ANOVA with Post hoc Fisher’s PLSD). Image collected & cropped by CiteAb from the following publication (https://pubmed.ncbi.nlm.nih.gov/26082716), licensed under a CC-BY license. Not internally tested by Novus Biologicals.
Western Blot: HIF-1 alpha Antibody - BSA Free [NB100-479] -
Western Blot: HIF-1 alpha Antibody - BSA Free [NB100-479] - Expression of hypoxia-inducible factor (HIF) proteins after bilateral renal ischemia or sham ischemia. Immunoblots for HIF-1 alpha (A–C) & HIF-2 alpha (D–F) of tissue extracts from the cortex & outer & inner medulla of the left kidneys of rats 24 h & 5 days following recovery from either sham ischemia (○) or bilateral renal ischemia (●); n = 6 per group. G: typical image of the gel following electrophoresis. H: typical image of the nitrocellulose membrane following transfer. Values are expressed as medians (25th percentile, 75th percentile). Paired comparisons were performed using the Mann-Whitney U-test. Because paired comparisons were made at two time points, P values were conservatively adjusted using the Dunn-Sidak method with k = 2. PTr, PT, & PTr*T are the outcomes of two-way analysis of variance on ranking with the factors treatment (Tr) & time (T). AU, arbitrary unit; I1, 24 h after ischemia; I5, 5 days after ischemia; S1, 24 h after sham ischemia; S5, 5 days after sham ischemia. Image collected & cropped by CiteAb from the following publication (https://pubmed.ncbi.nlm.nih.gov/30110566), licensed under a CC-BY license. Not internally tested by Novus Biologicals.
Western Blot: HIF-1 alpha Antibody - BSA Free [NB100-479] -
Western Blot: HIF-1 alpha Antibody - BSA Free [NB100-479] - DFO regulates the expression of HIF-1 alpha & HIF-1-related protein in the brains of APP/PS1 mice. (A) Western blots showing the expression levels of HIF-1 alpha protein in control & DFO-treated transgenic mice brains. (B) Immunoblot showed that DFO treatment significantly increased HIF-1 alpha protein levels, compared with controls. (C) The expression levels of HIF-1 alpha mRNA were detected by RT-PCR in the brains of APP/PS1 transgenic mice treated with DFO. (D) RT-PCR analysis showed that DFO treatment significantly increased the HIF-1 alpha mRNA levels in the transgenic mouse brain. GAPDH served as the internal control. (E) Immunohistochemically stains showed the distribution of HIF-1 alpha in the cortical & hippocampus sections of APP/PS1 mouse brain (Scale bar = 100 μm). (F) Western blots showing the expression levels of brain-derived neurotrophic factor (BDNF), DMT1, & TFR proteins in APP/PS1 transgenic mice brains 3 months after DFO administration. GAPDH was used as a loading control. (G–J) DFO treatment led to a marked increase in the BDNF, DMT1 + IRE, & TFR protein levels in the brains of transgenic mice compared with the control. There was no significant change in the expression levels of DMT1-IRE protein between the groups, compared with the control. Data represent the mean ± S.E. of 6 independent experiments. **P < 0.01 vs. control group. Image collected & cropped by CiteAb from the following publication (https://pubmed.ncbi.nlm.nih.gov/26082716), licensed under a CC-BY license. Not internally tested by Novus Biologicals.
Western Blot: HIF-1 alpha Antibody - BSA Free [NB100-479] -
Western Blot: HIF-1 alpha Antibody - BSA Free [NB100-479] - Phagocyte infiltration contributes to the respiratory burst & consequent EPO signalling activation during inflammation resolution.ZymA (i.p., 1 mg per mouse) was applied to induce peritonitis in male WT mice. (a–c) Mice were treated with either 0.5 mg per mice i.p. of anti-Ly6G antibody or control (isotype control rat IgG2a) 1.5 day before zymA injection, & exudate leucocytes, peritoneum & peritoneal fluid were collected for analysis of ROS (a, n=3), hypoxia, HIF-1 alpha (b, n=3) & EPO (c, n=3) at 6 24 h. (d–f) Mice were treated with either anti-Ly6G antibody (0.5 mg per mice) plus clodronate liposomes (0.2 ml per 10 g) or control (isotype antibody+empty liposome) before zymA injection, & exudate leucocytes, peritoneum & peritoneal fluid were collected for analysis of ROS (d, n=3), hypoxia, HIF-1 alpha (e, n=3) & EPO (f, n=3) at 24 h. Representative data from two independent experiments are shown. For flow cytometry data, black numbers refer to the percentage of positive cells & red numbers refer to the mean fluorescent intensity. Error bars represent the s.e.m. *P<0.05, two-tailed unpaired Student's t-test. Full-size images for b & e are shown in Supplementary Fig. 12. Image collected & cropped by CiteAb from the following publication (https://pubmed.ncbi.nlm.nih.gov/27397585), licensed under a CC-BY license. Not internally tested by Novus Biologicals.
Immunohistochemistry: HIF-1 alpha Antibody - BSA Free [NB100-479] -
Immunohistochemistry: HIF-1 alpha Antibody - BSA Free [NB100-479] - A “white-jade” muscle phenotype in EV-A71-infected mouse strain 129. aLeft panel: We coined a “white-jade” phenotype to describe the pathological changes in the color of the hindlimb muscle in EV-A71-infected mice (indicated by arrow). This phenotype showed characteristic muscle with locally whitened color in appearance & hardened tissue mass. In the saline control, tendons (not muscle) can be seen in white color. Right panel: An anatomical sketch of the hindlimb muscle. GM: gluteal muscle, QF: quadratus femoris muscle, BF: Biceps femoris muscle. b Both VP1 protein (upper) & myogenin protein (lower) were detected by IHC staining in the muscles, indicating EV-A71 infection, muscle injury & regeneration. The magnification is 200X. c Striking expression of HIF1A (hypoxia inducible factor 1-alpha ) protein (brown color) was detected by IHC staining in the white-jaded tissue, but not in the non-white-jaded tissue from the same mouse. d Specific association between HIF1A expression & white-jaded muscle Image collected & cropped by CiteAb from the following publication (https://pubmed.ncbi.nlm.nih.gov/31711481), licensed under a CC-BY license. Not internally tested by Novus Biologicals.
Western Blot: HIF-1 alpha Antibody - BSA Free [NB100-479] -
Western Blot: HIF-1 alpha Antibody - BSA Free [NB100-479] - Kidney-derived Sca-1+ cells produce Epo. (A) Epo protein levels in supernatants obtained from Sca-1+ cells cultured in normoxia or hypoxia (n = 3 biological replicates). (B) HIF-1 alpha & HIF-2 alpha protein levels in Sca-1+ kidney-derived cells after exposure to normoxia (20% O2) or hypoxia (1% O2). Numbers below the blots indicate the fold change of the ratio of HIF-1 alpha /Tubulin & HIF-2 alpha /Tubulin in 1% O2 to the respective 20% O2 control. (C) Epo RNA levels in Sca-1+ cells that were incubated either at 20% O2 of 1% O2 as indicated (n = 4 biological replicates). (D) Mesenchymal stem cell markers in renal Sca-1+ cells on day 21 of culture; reads per kilobase million (RPKM). (E) Volcano plot of 4592 significantly up- & 5376 significantly downregulated mRNAs in kidney-derived Sca-1+ cells on day 21 in culture compared to day 0. Mean values ± SEM are shown. * p < 0.05. Image collected & cropped by CiteAb from the following publication (https://pubmed.ncbi.nlm.nih.gov/35203399), licensed under a CC-BY license. Not internally tested by Novus Biologicals.
Western Blot: HIF-1 alpha Antibody - BSA Free [NB100-479] -
Western Blot: HIF-1 alpha Antibody - BSA Free [NB100-479] - Hif1 alpha expression in neonatal & adult testis.(A) Section of testis from 5-day old (P5) male new born pups showing Hif1 alpha expression in MVH+ gonocytes within the seminiferous tubules (top) & negative control images without primary antibodies (bottom). Scale bar: 50μm. (B) Western blot analysis of Hif1 alpha expression in P5 testes (left) compared to extract of the adult brain sub-ventricular zone (SVZ) (right). Loading control ( beta -Actin) is shown below. (C) Section of adult (3 month old) testis showing Hif1 alpha expression in spermatogonia. Scale bar: 30μm. (D) Western blot analysis of whole adult testis. HEK293 cells treated with DFX were used as a positive control & intestinal tissue was used as a negative control. Loading control ( beta -Actin) is shown below. Image collected & cropped by CiteAb from the following publication (https://pubmed.ncbi.nlm.nih.gov/27148974), licensed under a CC-BY license. Not internally tested by Novus Biologicals.
Western Blot: HIF-1 alpha Antibody - BSA Free [NB100-479] -
Western Blot: HIF-1 alpha Antibody - BSA Free [NB100-479] - Evidence that hypoxia induces nuclear entry of FIH. (A) Protein levels of HIF1 alpha, HIF2 alpha, FIH & PHD2 in U2OS cells during hypoxia (1% O2) treatment at the indicated time points. GAPDH was used as a loading control. (B) Immunofluorescence staining of FIH (green) in U2OS cells under hypoxic conditions (1% O2) at the indicated time points. TO-PRO-3 (blue) was used to stain nuclei. (C) Protein levels of FIH & HIF1 alpha from cytoplasmic or nuclear fractions in U2OS cells in normoxia or hypoxia (1% O2, 3 h). beta -tubulin & PARP were used as loading controls for the cytoplasmic & nuclear fractions, respectively. Figures beneath lanes 2 & 4 indicate relative intensities of nuclear FIH in normoxia & hypoxia. Note that different quantities of cytoplasmic & nuclear extracts were loaded. Scale bars: 20 µm. Image collected & cropped by CiteAb from the following publication (https://pubmed.ncbi.nlm.nih.gov/30333145), licensed under a CC-BY license. Not internally tested by Novus Biologicals.
Western Blot: HIF-1 alpha Antibody - BSA Free [NB100-479] -
Western Blot: HIF-1 alpha Antibody - BSA Free [NB100-479] - Respiratory burst contributes to the EPO signalling activation during inflammation resolution.ZymA (i.p., 1 mg per mouse) was applied to induce peritonitis in male WT mice or CGD mice. (a) Exudate leucocytes & peritoneum were collected at indicated intervals, & protein levels of HIF-1 alpha & HIF-2 alpha were measured by WB (n=3). (b) YC-1, 400083 or 400087 were intraperitoneally given to WT mice 3 h before zymA injection & the protein levels of related molecules were analysed by WB (n=2). (c) Mice were killed 1 h after injection of pimonidazole at indicated intervals & the protein adducts of reductively-activated pimonidazole were detected by WB with Hypoxiprobe-1-Mab-1 (HPI) (n=2). (d) Flow cytometry for ROS at indicated intervals (n=3). (e) Flow cytometry for cellular sources of ROS at indicated intervals (n=3). Representative data from at least two independent experiments are shown. For flow cytometry data from d, black numbers refer to the percentage of positive cells & red numbers refer to the mean fluorescent intensity. Error bars represent the s.e.m. *P<0.05, two-tailed unpaired Student's t-test. Full-size images for a–c are shown in Supplementary Figs 8–10, respectively. Image collected & cropped by CiteAb from the following publication (https://pubmed.ncbi.nlm.nih.gov/27397585), licensed under a CC-BY license. Not internally tested by Novus Biologicals.
Western Blot: HIF-1 alpha Antibody - BSA Free [NB100-479] -
Western Blot: HIF-1 alpha Antibody - BSA Free [NB100-479] - Effect of IKK2 inhibition on HUVEC, microvessel outgrowth from aortic rings, & VEGF-A expression. a Dose-dependent (10, 5 & 2.5 ng/ml) inhibitory effect of IMD0354 on HUVEC migration relative to control (DMSO 1 µl/ml). Living HUVEC were visualized with Calcein-AM (green). b Quantification of HUVEC migration distance (n = 8). One-way ANOVA test with Tukey multiple comparison was used to determine statistical significance. c HUVEC has grown on Geltrex to evaluate tube formation in the presence of IMD0354 compared to drug-free vehicle (DMSO). Vital HUVEC are stained with calcein-AM (green), & dead HUVEC are displayed in red (propidium iodide). Quantitative analysis of a number of junctions (d), & tubules (e) formed by HUVEC, & total tubule length (f) (n = 8). g Quantitative analysis of cell death induced by IMD0354 treatment (n = 8). h Effect of IMD0354 on cell proliferation in the aortic ring assay. Student t test was used to determine statistical significance. i Western blot analysis of VEGF-A expression in HUVEC treated with IMD0354 (10, 5, 2.5 ng/ml), with beta -actin as a loading control. j Western blot analysis of HIF-1 alpha expression in HUVEC treated with IMD0354 (10, 5, 2.5 ng/ml), with beta -actin as a loading control. k Immunofluorescent detection of VEGF-A (green) in HUVEC treated with IMD0354 (10, 5, 2.5 ng/ml). Cell nuclei visualized with DAPI staining (blue). n.s. p > 0.05; *p < 0.05; **p < 0.01; ***p < 0.001 Image collected & cropped by CiteAb from the following publication (http://link.springer.com/10.1007/s10456-018-9594-9), licensed under a CC-BY license. Not internally tested by Novus Biologicals.
Western Blot: HIF-1 alpha Antibody - BSA Free [NB100-479] -
Western Blot: HIF-1 alpha Antibody - BSA Free [NB100-479] - The duration of enhanced radiosensitivity after normoxic pretreatment of cells undergoing Rapid Acute Hypoxia.(A) The RAH protocol is shown with variable delays to radiation after normoxic pretreatment. In this protocol all cells are transiently (25 min) exposed to normoxia for 25 min (+) & then returned to severe hypoxia (1% O2) for 1, 3, or 6 hours prior to radiation. Continuously normoxic cells (NOx) were irradiated as a positive control. (B) Results from anchorage-independent colony forming assays indicate that the decay of enhanced radiosensitivity for cells in the RAH protocol is generally more rapid than that observed for cells in the GCH protocol. To allow for ease of comparisons among cell types, raw values are expressed as a percentage of the corresponding cell type’s negative (non-irradiated) control & the means & SEMs are plotted. Each result represents at least three independent samples, plated in triplicate. Holm-Sidak comparisons for multiple groups were used for statistical comparisons of raw values (*p<0.05, **p<0.01). Also shown are Western blots of nuclear HIF-1 alpha at the time of irradiation for each cell line. Corresponding Western blots of lamin A/C are shown as a loading control. Image collected & cropped by CiteAb from the following publication (https://pubmed.ncbi.nlm.nih.gov/25350400), licensed under a CC-BY license. Not internally tested by Novus Biologicals.
Western Blot: HIF-1 alpha Antibody - BSA Free [NB100-479] -
Western Blot: HIF-1 alpha Antibody - BSA Free [NB100-479] - HIF-1 alpha overexpression rescues oxygen-induced radioresistance in RAH-treated cells, but not GCH-treated cells.Results are shown for the anchorage-independent colony forming assays for U87 cells transfected with either an empty vector or HIF-1 alpha expression vector & then exposed to GCH or RAH protocols without (–) or with (+) reoxygenation. Continuously normoxic cells (NOx) were irradiated as a positive control. To allow for ease of comparisons among conditions, raw values are presented as a percentage of that cell type’s negative (non-irradiated) control & the means & SEMs are plotted. Each result represents at least three independent samples, plated in triplicate. Holm-Sidak comparisons for multiple groups were used for statistical comparisons of raw values (*p<0.05, **p<0.01). Western blotting analysis of nuclear HIF-1 alpha at the time of irradiation is shown for each cell type below clonogenic results. Corresponding Western blots of lamin A/C are shown as a loading control & blots for hemagglutinin (HA) are shown below HIF-1 alpha overexpression vector results to demonstrate transfection efficacy. All lanes shown that are non-adjacent to the negative control (NOx) are denoted with a separating black line. Image collected & cropped by CiteAb from the following publication (https://pubmed.ncbi.nlm.nih.gov/25350400), licensed under a CC-BY license. Not internally tested by Novus Biologicals.
Western Blot: HIF-1 alpha Antibody - BSA Free [NB100-479] -
Western Blot: HIF-1 alpha Antibody - BSA Free [NB100-479] - ONECUT2 modulates HIF1 alpha binding to chromatin in NE-like PC3 cells. a Western blot of HIF1 alpha & ONECUT2 in PC3 cells under normoxic & hypoxic conditions. Two different siRNAs targeting ONECUT2 were mixed together for knockdown experiments. b Left panel: heatmaps show HIF1 alpha ChIP-Seq signal in PC3 cells under hypoxic conditions with & without knockdown of ONECUT2; right panel: pileup of HIF1 alpha ChIP-Seq signals centered at HIF1 alpha ChIP-Seq peaks center. c Expression of ANGPTL4 & ADM, two hypoxia-regulated genes, with & without knockdown of ONECUT2 in PC3 cells. d Schematic illustration of the analysis identifying SMAD3 as an ONECUT2 regulated HIF1 alpha co-factor. Genes identified in motifs enriched in HIF1 alpha binding sites & ONECUT2 target genes were further filtered by HIF1 alpha interacting protein list from BioGRID. ONECUT2 target genes were defined as differentially expressed in ONECUT2 knockdown & control samples & with ONECUT2 binding sites nearby in PC3 cells under hypoxic conditions. e SMAD3 expression in response to ONECUT2 silencing in PC3 cells. f SMAD3 & HIF1 alpha binding sites with & without silencing of SMAD3. g The overlap of SMAD3 ChIP-Seq, HIF1 alpha ChIP-Seq & SMAD3-HIF1 alpha ChIP-re-ChIP-Seq peaks. h SMAD3 ChIP-Seq, HIF1 alpha ChIP-Seq & SMAD3-HIF1 alpha ChIP-re-ChIP-Seq signal near the promoter regions of hypoxia-induced genes ANGPTL4 & ADM. Error bars indicate s.d. from at least two technical replicates. P-value is calculated by one-way ANOVA. **: P < 0.01. Source data are provided as a Source Data file Image collected & cropped by CiteAb from the following publication (https://pubmed.ncbi.nlm.nih.gov/30655535), licensed under a CC-BY license. Not internally tested by Novus Biologicals.
Western Blot: HIF-1 alpha Antibody - BSA Free [NB100-479] -
Western Blot: HIF-1 alpha Antibody - BSA Free [NB100-479] - The duration of enhanced radiosensitivity after normoxic pretreatment differs among cell lines undergoing Graded Chronic Hypoxia.(A) The GCH protocol is shown with variable delays to radiation after normoxic pretreatment. After GCH, all cells are transiently (25 min) exposed to normoxia for 25 min (+) & are then returned to severe hypoxia (1% O2) for 1, 3, or 6 hours prior to radiation. Continuously normoxic cells (NOx) were irradiated as a positive control. (B) Results from anchorage-independent colony forming assays indicate that the decay of enhanced radiosensitivity differs among cell lines. To allow for ease of comparisons among cell types, raw values are expressed as a percentage of the corresponding cell type’s negative (non-irradiated) control & the means & SEMs are plotted. Each result represents at least three independent samples, plated in triplicate. Holm-Sidak comparisons for multiple groups were used for statistical comparisons of raw values (*p<0.05, **p<0.01). Also shown are Western blots of nuclear HIF-1 alpha at the time of irradiation for each cell line. Corresponding Western blots of lamin A/C are shown as a loading control. Image collected & cropped by CiteAb from the following publication (https://pubmed.ncbi.nlm.nih.gov/25350400), licensed under a CC-BY license. Not internally tested by Novus Biologicals.
Western Blot: HIF-1 alpha Antibody - BSA Free [NB100-479] -
Western Blot: HIF-1 alpha Antibody - BSA Free [NB100-479] - Expression of hypoxia-inducible factor (HIF) proteins after bilateral renal ischemia or sham ischemia. Immunoblots for HIF-1 alpha (A–C) & HIF-2 alpha (D–F) of tissue extracts from the cortex & outer & inner medulla of the left kidneys of rats 24 h & 5 days following recovery from either sham ischemia (○) or bilateral renal ischemia (●); n = 6 per group. G: typical image of the gel following electrophoresis. H: typical image of the nitrocellulose membrane following transfer. Values are expressed as medians (25th percentile, 75th percentile). Paired comparisons were performed using the Mann-Whitney U-test. Because paired comparisons were made at two time points, P values were conservatively adjusted using the Dunn-Sidak method with k = 2. PTr, PT, & PTr*T are the outcomes of two-way analysis of variance on ranking with the factors treatment (Tr) & time (T). AU, arbitrary unit; I1, 24 h after ischemia; I5, 5 days after ischemia; S1, 24 h after sham ischemia; S5, 5 days after sham ischemia. Image collected & cropped by CiteAb from the following publication (https://pubmed.ncbi.nlm.nih.gov/30110566), licensed under a CC-BY license. Not internally tested by Novus Biologicals.
Western Blot: HIF-1 alpha Antibody - BSA Free [NB100-479] -
Western Blot: HIF-1 alpha Antibody - BSA Free [NB100-479] - Respiratory burst contributes to the EPO signalling activation during inflammation resolution.ZymA (i.p., 1 mg per mouse) was applied to induce peritonitis in male WT mice or CGD mice. (a) Exudate leucocytes & peritoneum were collected at indicated intervals, & protein levels of HIF-1 alpha & HIF-2 alpha were measured by WB (n=3). (b) YC-1, 400083 or 400087 were intraperitoneally given to WT mice 3 h before zymA injection & the protein levels of related molecules were analysed by WB (n=2). (c) Mice were killed 1 h after injection of pimonidazole at indicated intervals & the protein adducts of reductively-activated pimonidazole were detected by WB with Hypoxiprobe-1-Mab-1 (HPI) (n=2). (d) Flow cytometry for ROS at indicated intervals (n=3). (e) Flow cytometry for cellular sources of ROS at indicated intervals (n=3). Representative data from at least two independent experiments are shown. For flow cytometry data from d, black numbers refer to the percentage of positive cells & red numbers refer to the mean fluorescent intensity. Error bars represent the s.e.m. *P<0.05, two-tailed unpaired Student's t-test. Full-size images for a–c are shown in Supplementary Figs 8–10, respectively. Image collected & cropped by CiteAb from the following publication (https://pubmed.ncbi.nlm.nih.gov/27397585), licensed under a CC-BY license. Not internally tested by Novus Biologicals.
Western Blot: HIF-1 alpha Antibody - BSA Free [NB100-479] -
Western Blot: HIF-1 alpha Antibody - BSA Free [NB100-479] - G9a inhibition reduces cell motility in breast cancer cell lines. G9a inhibition represses breast cancer cell motility in vitro. (A) Microarray analysis of differentially expressed genes comparing hypoxia-responsive genes from MCF7 cells expressing shNS & shG9a identifies a subset of 212 genes downregulated in hypoxia in a G9a-dependent manner. (B) Ingenuity Pathway Analysis results of the 212 G9a-dependent genes. (C) Evaluation of the migratory distance covered by MDA-MB-231 treated with UNC0642 (5 μM) or (D) transfected with either vector or shG9a. Results were evaluated through real-time imaging using the HoloMonitor M4, taking pictures every 10 minutes for 48 hours, in three independent experiments. An average of 20 cells per condition is shown for the representative circular displacement images. (E) Western blot analysis of G9a, H3K9me1 & H3K9me2 in MDA‑MB-231 transfected with vector or shG9a & incubated in hypoxia for 24 hours. HIF1 alpha was included as positive control for hypoxic conditions. H3 & Lamin A/C were used as loading control (F) Scratch wound assay for MDA-MB-231 breast cancer cells treated with 5 μM UNC0642, under both normoxic (21% O2) & hypoxic (1% O2) conditions. Results were evaluated by real-time imaging performed by the IncuCyte Zoom every 24 hours & wound closure was quantified using ImageJ. Scale bar represents 500 μm. (G) Scratch wound assay of MCF7 breast cancer cells following G9a KD & G9a reconstitution. Scale bar represents 500 μm. (H) Western blot analysis of MCF7 cells transfected with shG9a & reconstituted with WT G9a. Data are represented as mean ± SEM of three independent experiments (unpaired, non-parametric Student's t-test, **p<0.005, ****p<0.0001). Image collected & cropped by CiteAb from the following publication (https://pubmed.ncbi.nlm.nih.gov/32292512), licensed under a CC-BY license. Not internally tested by Novus Biologicals.
Chromatin Immunoprecipitation: HIF-1 alpha Antibody - BSA Free [NB100-479] -
Chromatin Immunoprecipitation: HIF-1 alpha Antibody - BSA Free [NB100-479] - Hypoxia reduces inflammatory signaling pathways & NLRP3 expression & induces autophagy in IECs. a HT-29 cells were subjected to normoxia & hypoxia at the indicated times in the absence or presence of 10 µg/ml LPS. Autophagy was measured by variations in the ratio of LC3-II/LC3-I & the total amount of LC3 (LC3-I plus LC3-II) relative to beta -actin. Results are representative of two independent experiments. b, c & d HT-29 cells were subjected to normoxia & hypoxia for the indicated periods in the absence or presence of 10 µg/ml LPS, followed by transcript analysis. Statistical analysis was performed using one-way ANOVA followed by Tukey’s post-test. Results represent mean + s.e.m. of two independent experiments done in triplicate, *P < 0.05; **P < 0.01; ***P < 0.001; ns not significant. e HT-29 cells were subjected to normoxia or hypoxia in the presence & absence of 10 µg/ml LPS & 20 µM of MG132. Results are representative of two independent experiments. f & g Putative binding sites for HIF-1 alpha & NF-kappa B were found in the p62 f & NLRP3 g promoters using Genomatix software tools. Numbers under the boxes indicate the distance from the transcription start site. HT-29 cells were subjected to normoxia (21% O2) or hypoxia (0.2% O2) for 6 h & 24 h. ChIP analysis was performed using antibodies against HIF-1 alpha & NF-kappa B for immunoprecipitation. PCR was performed using the promoter-specific primers for the p62 f & NLRP3 g promoter binding sites of HIF-1 alpha & NF-kappa B. Aliquots taken prior to immunoprecipitation were used as input control. PCR products were run on 2% agarose gel. The results are representative of three independent experiments. Image collected & cropped by CiteAb from the following publication (https://pubmed.ncbi.nlm.nih.gov/28740109), licensed under a CC-BY license. Not internally tested by Novus Biologicals.
Western Blot: HIF-1 alpha Antibody - BSA Free [NB100-479] -
Western Blot: HIF-1 alpha Antibody - BSA Free [NB100-479] - Deletion of Hif1 alpha decreases primary tumor growth. (A) Wild-type (WT) or knockout (KO) cells (n = 50,000) were transplanted into FVB/Nj mice. All tumors were harvested at day 56 to evaluate tumor weight, volume & burden (percentage tumor weight/total body weight, BW) (n = 10 recipients/genotype, P < 0.05, unpaired Student's t-test). (B) The growth rate of WT & KO tumors following transplant of 50,000 cells. Best-fit curves were established based on a polynomial fit algorithm using GraphPad Prism 4.0 software. Data in (A) & (B) are representative of seven independent experiments (> 60 recipients/genotype). (C) When 500 WT & KO cells were implanted into the mammary fat pad, the median time until 50% of recipients developed tumors > 500 mm3 was 64 days for WT mice & 127 days for KO mice (n = 14 recipients/genotype, P < 0.001, logrank test). (D) Western blot for HIF-1 alpha in three independent tumors (500 to 750 mm3) per genotype. WT & KO cells that were cultured for 6 hours under hypoxic conditions served as positive & negative controls, respectively. CRM, cross-reactive material. MTEC, mammary tumor epithelial cell. (E) Mean fold change ± SEM in expression of HIF-1 targets in KO tumors as determined by qRT-PCR (n = 5 tumors/genotype). Decreased gene expression in KO tumors is presented as a negative fold-change relative to WT tumors. (F) An increase in Ki67+ cells in KO tumors is balanced by an increase in caspase 3-positive cells (n = 5 tumors/genotype, *P < 0.05, Student's t-test). Representative immunostaining images are shown in Additional file 2 Figure S4. Image collected & cropped by CiteAb from the following publication (http://breast-cancer-research.biomedcentral.com/articles/10.1186/bcr3087), licensed under a CC-BY license. Not internally tested by Novus Biologicals.
Western Blot: HIF-1 alpha Antibody - BSA Free [NB100-479] -
Western Blot: HIF-1 alpha Antibody - BSA Free [NB100-479] - Effect of HIF-1 alpha silencing on alpha -MSH-induced apoptosis in B16-F10 melanoma cells during hypoxia.a Cells were transfected with shLacZ or shHIF-1 alpha plasmids for 48 h before harvest. HIF-1 alpha shRNA reduced the basal HIF-1 alpha mRNA & protein expression levels. b, c Relative mRNA expression levels were analyzed by real-time PCR. Data are expressed as fold change compared with control (means ± SD of triplicate experiments). d Cell lysates were analyzed by immunoblot using the indicated antibodies. beta -Actin was used as an internal control for loading & transfer. e The population of apoptotic cells was analyzed by flow cytometry & qualified as mean ± SD from triplicate experiments. *p < 0.05, **p < 0.01. Knockdown of HIF-1 alpha diminished alpha -MSH-induced apoptosis in B16-F10 melanoma cells during hypoxia Image collected & cropped by CiteAb from the following publication (https://pubmed.ncbi.nlm.nih.gov/30062060), licensed under a CC-BY license. Not internally tested by Novus Biologicals.
Immunohistochemistry: HIF-1 alpha Antibody - BSA Free [NB100-479] -
Immunohistochemistry: HIF-1 alpha Antibody - BSA Free [NB100-479] - Hif1 alpha expression in neonatal & adult testis.(A) Section of testis from 5-day old (P5) male new born pups showing Hif1 alpha expression in MVH+ gonocytes within the seminiferous tubules (top) & negative control images without primary antibodies (bottom). Scale bar: 50μm. (B) Western blot analysis of Hif1 alpha expression in P5 testes (left) compared to extract of the adult brain sub-ventricular zone (SVZ) (right). Loading control ( beta -Actin) is shown below. (C) Section of adult (3 month old) testis showing Hif1 alpha expression in spermatogonia. Scale bar: 30μm. (D) Western blot analysis of whole adult testis. HEK293 cells treated with DFX were used as a positive control & intestinal tissue was used as a negative control. Loading control ( beta -Actin) is shown below. Image collected & cropped by CiteAb from the following publication (https://pubmed.ncbi.nlm.nih.gov/27148974), licensed under a CC-BY license. Not internally tested by Novus Biologicals.
Western Blot: HIF-1 alpha Antibody - BSA Free [NB100-479] -
Western Blot: HIF-1 alpha Antibody - BSA Free [NB100-479] - Expression of hypoxia-inducible factor (HIF) proteins after bilateral renal ischemia or sham ischemia. Immunoblots for HIF-1 alpha (A–C) & HIF-2 alpha (D–F) of tissue extracts from the cortex & outer & inner medulla of the left kidneys of rats 24 h & 5 days following recovery from either sham ischemia (○) or bilateral renal ischemia (●); n = 6 per group. G: typical image of the gel following electrophoresis. H: typical image of the nitrocellulose membrane following transfer. Values are expressed as medians (25th percentile, 75th percentile). Paired comparisons were performed using the Mann-Whitney U-test. Because paired comparisons were made at two time points, P values were conservatively adjusted using the Dunn-Sidak method with k = 2. PTr, PT, & PTr*T are the outcomes of two-way analysis of variance on ranking with the factors treatment (Tr) & time (T). AU, arbitrary unit; I1, 24 h after ischemia; I5, 5 days after ischemia; S1, 24 h after sham ischemia; S5, 5 days after sham ischemia. Image collected & cropped by CiteAb from the following publication (https://pubmed.ncbi.nlm.nih.gov/30110566), licensed under a CC-BY license. Not internally tested by Novus Biologicals.
Western Blot: HIF-1 alpha Antibody - BSA Free [NB100-479] -
Western Blot: HIF-1 alpha Antibody - BSA Free [NB100-479] - Hypoxia reduces inflammatory signaling pathways & NLRP3 expression & induces autophagy in IECs. a HT-29 cells were subjected to normoxia & hypoxia at the indicated times in the absence or presence of 10 µg/ml LPS. Autophagy was measured by variations in the ratio of LC3-II/LC3-I & the total amount of LC3 (LC3-I plus LC3-II) relative to beta -actin. Results are representative of two independent experiments. b, c & d HT-29 cells were subjected to normoxia & hypoxia for the indicated periods in the absence or presence of 10 µg/ml LPS, followed by transcript analysis. Statistical analysis was performed using one-way ANOVA followed by Tukey’s post-test. Results represent mean + s.e.m. of two independent experiments done in triplicate, *P < 0.05; **P < 0.01; ***P < 0.001; ns not significant. e HT-29 cells were subjected to normoxia or hypoxia in the presence & absence of 10 µg/ml LPS & 20 µM of MG132. Results are representative of two independent experiments. f & g Putative binding sites for HIF-1 alpha & NF-kappa B were found in the p62 f & NLRP3 g promoters using Genomatix software tools. Numbers under the boxes indicate the distance from the transcription start site. HT-29 cells were subjected to normoxia (21% O2) or hypoxia (0.2% O2) for 6 h & 24 h. ChIP analysis was performed using antibodies against HIF-1 alpha & NF-kappa B for immunoprecipitation. PCR was performed using the promoter-specific primers for the p62 f & NLRP3 g promoter binding sites of HIF-1 alpha & NF-kappa B. Aliquots taken prior to immunoprecipitation were used as input control. PCR products were run on 2% agarose gel. The results are representative of three independent experiments. Image collected & cropped by CiteAb from the following publication (https://pubmed.ncbi.nlm.nih.gov/28740109), licensed under a CC-BY license. Not internally tested by Novus Biologicals.
Western Blot: HIF-1 alpha Antibody - BSA Free [NB100-479] -
Western Blot: HIF-1 alpha Antibody - BSA Free [NB100-479] - Transient hyperoxia does not sensitize normal human astrocytes to radiation.Results are shown for the colony forming assays for all previously assayed cell lines & a normal human astrocyte cell line (Astro). Cells were continuously maintained under normoxic conditions (NOx) or exposed to 25 min of hyperoxia (50% O2) & then returned to normoxic conditions for 25 min (HyperOx) before being treated with a 5 Gy dose of radiation. To allow for ease of comparisons among cell types, raw values are expressed as a percentage of the corresponding cells type’s negative (non-irradiated) control & the means & SEMs are plotted. Each result represents three independent samples, plated in triplicate (*p<0.05, Student’s t-test). Also shown are Western blots of nuclear HIF-1 alpha at the time of irradiation for each cell line. Corresponding Western blots of lamin A/C are shown as a loading control. Image collected & cropped by CiteAb from the following publication (https://pubmed.ncbi.nlm.nih.gov/25350400), licensed under a CC-BY license. Not internally tested by Novus Biologicals.
Western Blot: HIF-1 alpha Antibody - BSA Free [NB100-479] -
Western Blot: HIF-1 alpha Antibody - BSA Free [NB100-479] - YC-1 attenuates pro-inflammatory differentiation of macrophages. (a,b) qRT-PCR analyses, revealing mRNA expression of the pro-inflammatory M1-differentiation markers NOS2 (a) & IL-6 (b) in murine J774A.1 macrophages under normoxia (left bars) & hypoxia (right bars). LPS exposure was carried out to induce M1-polarization in presence of YC-1 or vehicle control (DMSO; **P ≤ 0.01, n = 9). (c,d) Western blots of nuclear extracts, revealing protein levels of HIF-1 alpha (c) & HIF-2 alpha (d) in J774.A1 macrophages treated with vehicle (DMSO) or YC-1 under normoxic (left) or hypoxic (right) culture conditions. Simultaneous LPS-treatment was performed to induce pro-inflammatory activation. Note LPS-induced stabilization of HIF-1 alpha - (c), but not HIF-2 alpha -levels (d), & reversal of LPS-induced HIF-1 alpha -stabilization by YC-1 (c). Histone H3 was used as a loading control. (e,f) qRT-PCR analyses, revealing mRNA expression of the pro-inflammatory M1-differentiation markers NOS2 (e) & IL-6 (f) in BMDMs under normoxia (left bars) & hypoxia (right bars). LPS exposure was carried out to induce M1-polarization in presence of YC-1 or vehicle control (DMSO; ***P ≤ 0.001, **P ≤ 0.01, n = 6). Image collected & cropped by CiteAb from the following publication (https://www.nature.com/articles/s41598-017-13638-z), licensed under a CC-BY license. Not internally tested by Novus Biologicals.Applications for HIF-1 alpha Antibody - BSA Free
Application
Recommended Usage
Chromatin Immunoprecipitation (ChIP)
1:10-1:500
Flow Cytometry
1:10 - 1:1000. Use reported in scientific literature (PMID 21917971)
Immunoblotting
reported in scientific literature (PMID 28506759)
Immunocytochemistry/ Immunofluorescence
1:100
Immunohistochemistry
5 - 10 ug/mL
Immunohistochemistry Whole-Mount
reported in scientific literature (PMID 27148974)
Immunohistochemistry-Frozen
5 - 10 ug/mL
Immunohistochemistry-Paraffin
5 - 10 ug/mL
Immunoprecipitation
1:10 - 1:500
Western Blot
1-2ug/ml
Application Notes
WB recognizes a band in hypoxic samples at ~115 kDa. HIF-1 alpha protein (NBC1-18422) has been successfully used for antibody preadsorption/blocking assay in IHC-P with HIF-1 alpha antibody NB100-479.
Reviewed Applications
Read 29 reviews rated 4.4 using NB100-479 in the following applications:
Flow Cytometry Panel Builder
Bio-Techne Knows Flow Cytometry
Save time and reduce costly mistakes by quickly finding compatible reagents using the Panel Builder Tool.
Advanced Features
- Spectra Viewer - Custom analysis of spectra from multiple fluorochromes
- Spillover Popups - Visualize the spectra of individual fluorochromes
- Antigen Density Selector - Match fluorochrome brightness with antigen density

Formulation, Preparation, and Storage
Purification
Immunogen affinity purified
Formulation
PBS
Format
BSA Free
Preservative
0.02% Sodium Azide
Concentration
1.0 mg/ml
Shipping
The product is shipped with polar packs. Upon receipt, store it immediately at the temperature recommended below.
Stability & Storage
Store at -20C.
Background: HIF-1 alpha/HIF1A
HIF-1 or hypoxia inducible factor 1 (predicted molecular weight 93kDa), is a transcription factor commonly referred to as a "master regulator of the hypoxic response" for its central role in the regulation of cellular adaptations to hypoxia. In its active form under hypoxic conditions, HIF-1 is stabilized by the formation of a heterodimer of HIF-1 alpha and ARNT/HIF-1 beta subunits. Nuclear HIF-1 engages p300/CBP for binding to hypoxic response elements (HREs). This process induces transcription and regulation of genes including EPO, VEGF, iNOS2, ANGPT1 and OCT4 (4,5).
Under normoxic conditions, the HIF-1 alpha subunit is rapidly targeted and degraded by the ubiquitin proteasome system. This process is mediated by prolyl hydroxylase domain enzymes (PHDs), which catalyze the hydroxylation of key proline residues (Pro-402 and Pro-564) within the oxygen-dependent degradation domain of HIF-1 alpha. Once hydroxylated, HIF-1 alpha binds the von Hippel-Lindau tumor suppressor protein (pVHL) for subsequent ubiquitination and proteasomal degradation (4). pVHL dependent regulation of HIF-1 alpha plays a role in normal physiology and disease states. Regulation of HIF-1 alpha by pVHL is critical for the suppressive function of FoxP3+ regulatory Tcells (6). Repression of pVHL expression in chronic lymphocytic leukemia (CLL) B cells leads to HIF-1 alpha stabilization and increased VEGF secretion (7).
References
1. Semenza, G. L., Agani, F., Feldser, D., Iyer, N., Kotch, L., Laughner, E., & Yu, A. (2000). Hypoxia, HIF-1, and the pathophysiology of common human diseases. Advances in Experimental Medicine and Biology.
2. Muz, B., de la Puente, P., Azab, F., & Azab, A. K. (2015). The role of hypoxia in cancer progression, angiogenesis, metastasis, and resistance to therapy. Hypoxia. https://doi.org/10.2147/hp.s93413
3. Huang, Y., Lin, D., & Taniguchi, C. M. (2017). Hypoxia inducible factor (HIF) in the tumor microenvironment: friend or foe? Science China Life Sciences. https://doi.org/10.1007/s11427-017-9178-y
4. Koyasu, S., Kobayashi, M., Goto, Y., Hiraoka, M., & Harada, H. (2018). Regulatory mechanisms of hypoxia-inducible factor 1 activity: Two decades of knowledge. Cancer Science. https://doi.org/10.1111/cas.13483
5. Dengler, V. L., Galbraith, M. D., & Espinosa, J. M. (2014). Transcriptional regulation by hypoxia inducible factors. Critical Reviews in Biochemistry and Molecular Biology. https://doi.org/10.3109/10409238.2013.838205
6. Lee, J. H., Elly, C., Park, Y., & Liu, Y. C. (2015). E3Ubiquitin Ligase VHL Regulates Hypoxia-Inducible Factor-1 alpha to Maintain Regulatory T Cell Stability and Suppressive Capacity. Immunity. https://doi.org/10.1016/j.immuni.2015.05.016
7. Ghosh, A. K., Shanafelt, T. D., Cimmino, A., Taccioli, C., Volinia, S., Liu, C. G.,... Kay, N. E. (2009). Aberrant regulation of pVHL levels by microRNA promotes the HIF/VEGF axis in CLL B cells. Blood. https://doi.org/10.1182/blood-2008-10-185686
Long Name
Hypoxia Inducible Factor 1 Subunit Alpha
Alternate Names
BHLHE78, HIF 1A, HIF-1a, HIF1 alpha, HIF1A, MOP1, PASD8
Gene Symbol
HIF1A
UniProt
Additional HIF-1 alpha/HIF1A Products
Product Documents for HIF-1 alpha Antibody - BSA Free
Certificate of Analysis
To download a Certificate of Analysis, please enter a lot or batch number in the search box below.
Product Specific Notices for HIF-1 alpha Antibody - BSA Free
This product is for research use only and is not approved for use in humans or in clinical diagnosis. Primary Antibodies are guaranteed for 1 year from date of receipt.
Citations for HIF-1 alpha Antibody - BSA Free
 Powered by Bioz
Customer Reviews for HIF-1 alpha Antibody - BSA Free (29)
4.4 out of 5
29 Customer Ratings
Have you used HIF-1 alpha Antibody - BSA Free?
Submit a review and receive an Amazon gift card!
$25/€18/£15/$25CAN/¥2500 Yen for a review with an image
$10/€7/£6/$10CAN/¥1110 Yen for a review without an image
Submit a review
Customer Images

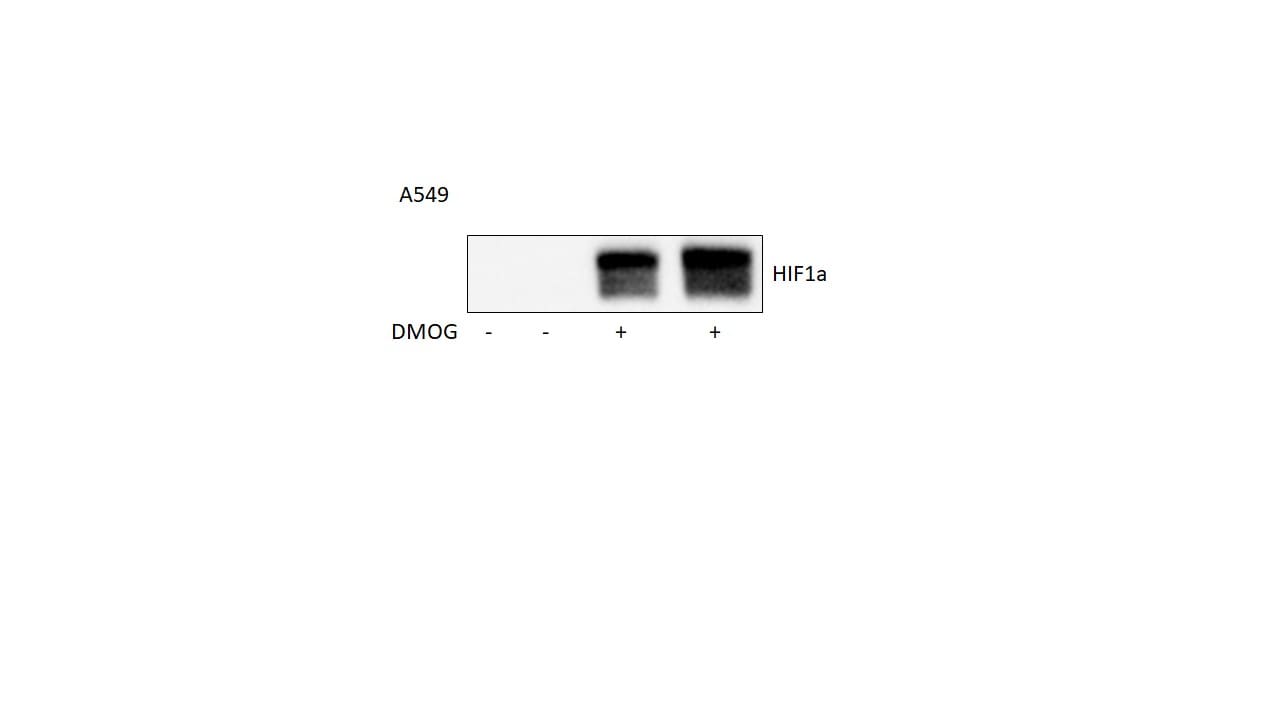
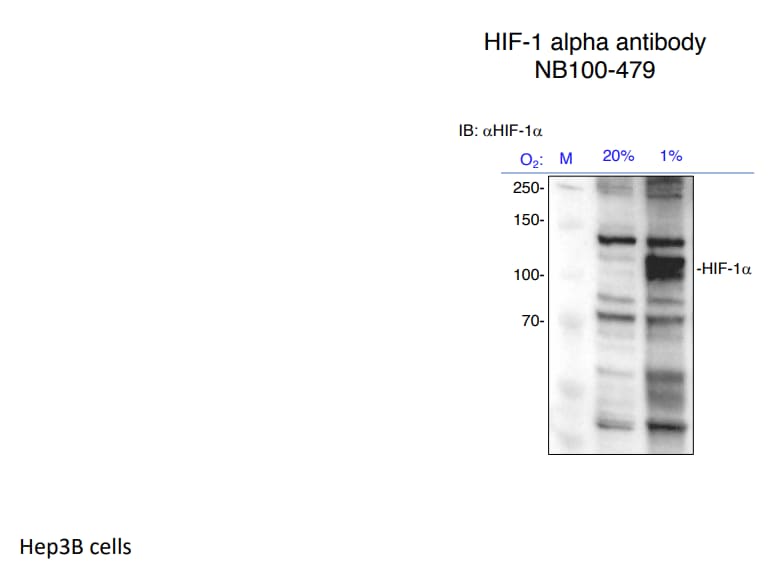
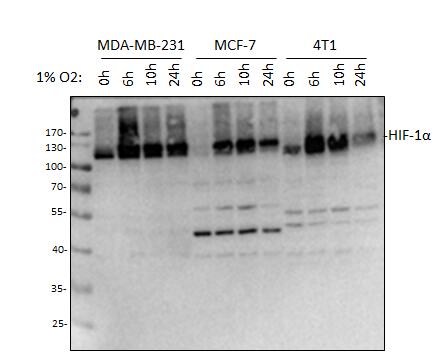
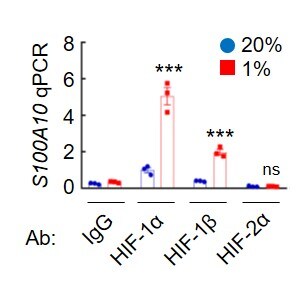
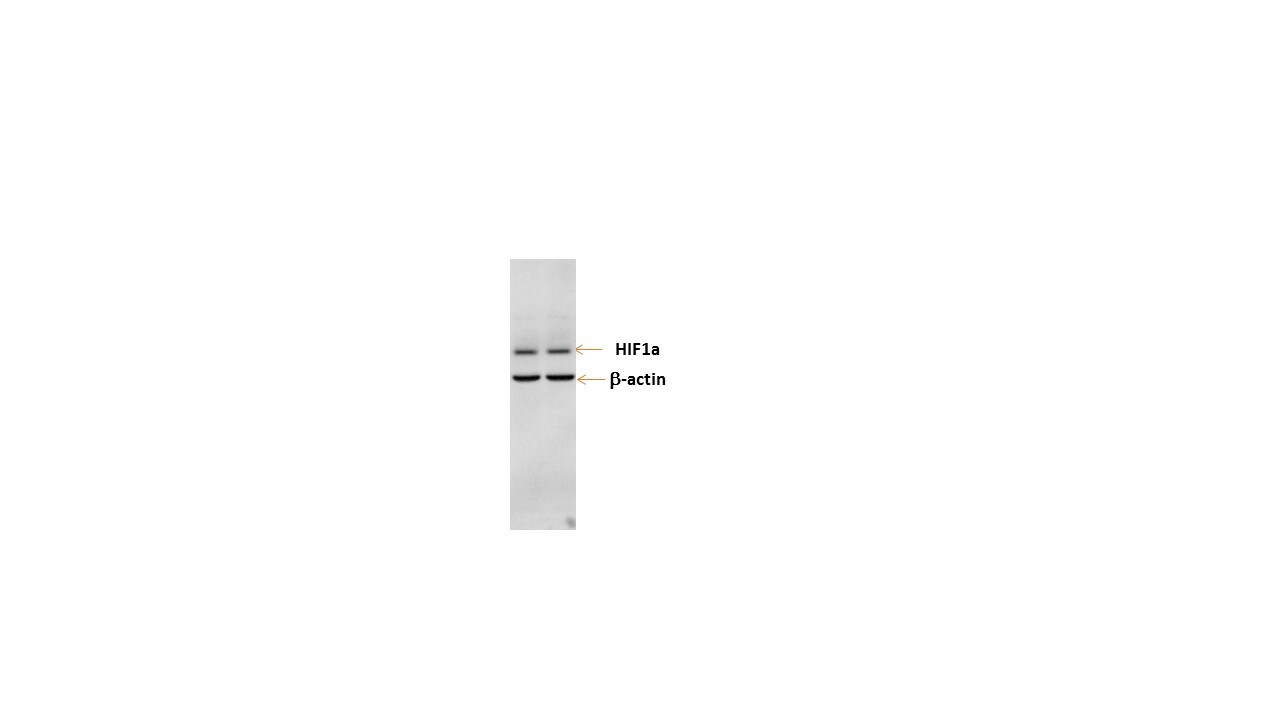
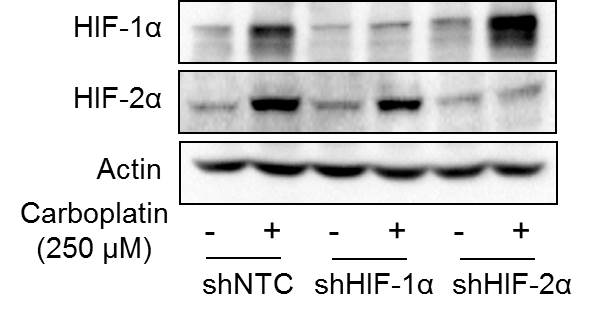
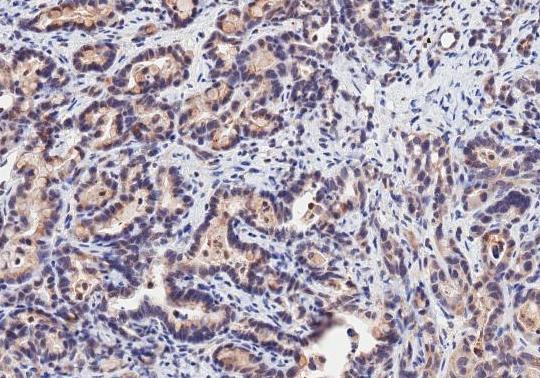
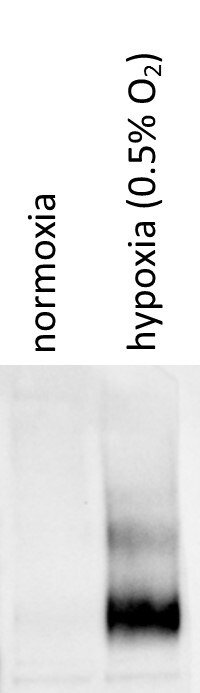
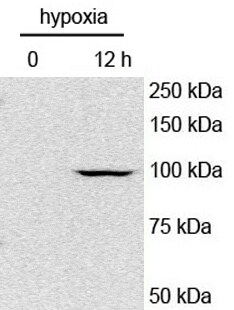
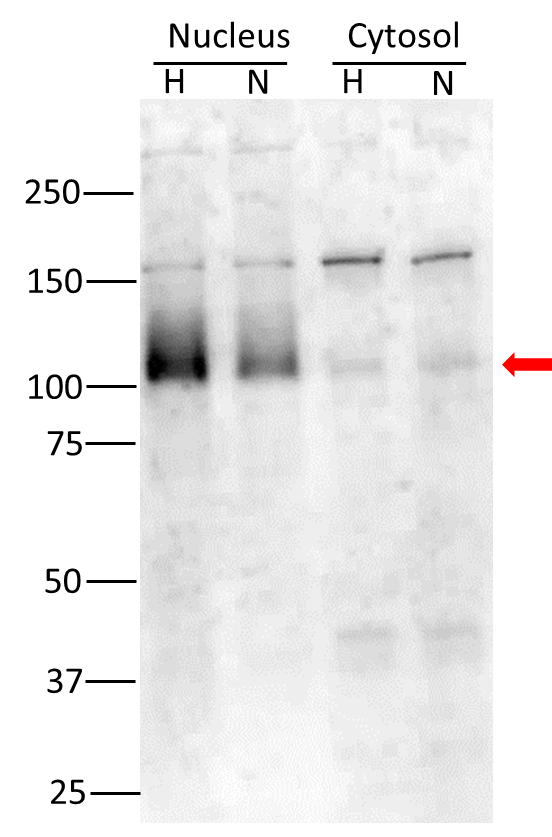
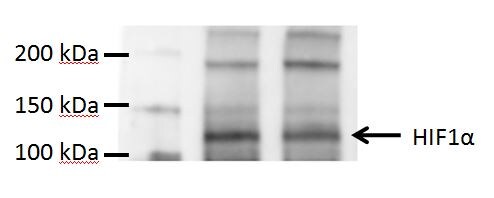
-(01-ml)_NB100-479_10081.gif)
-(01-ml)_NB100-479_9371.jpg)
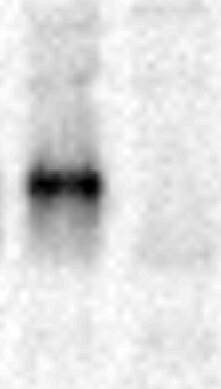
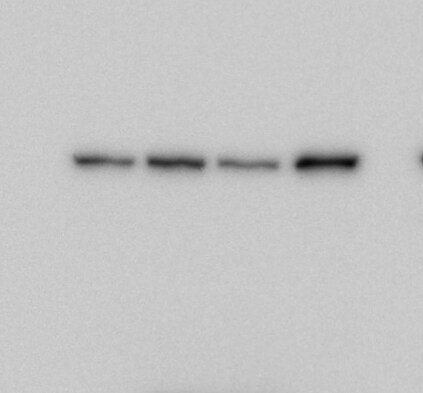
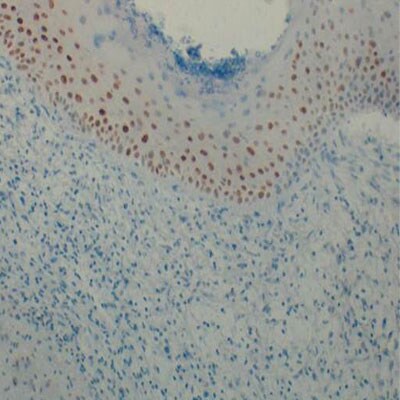
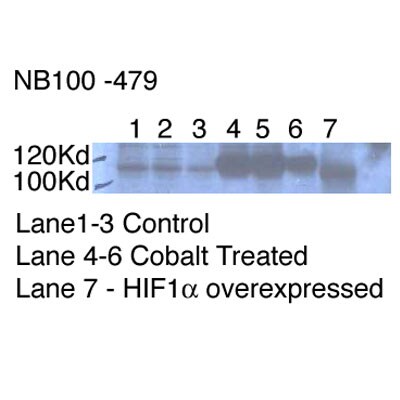
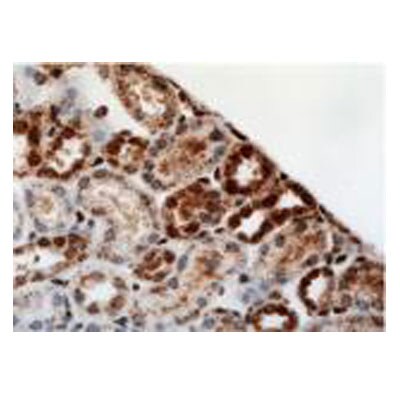
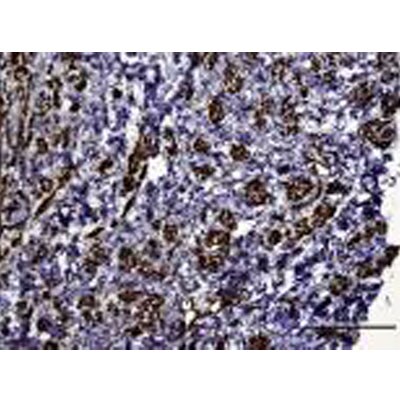
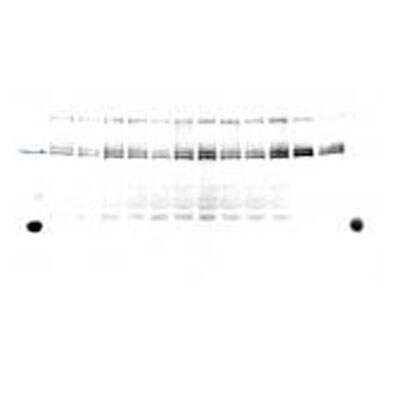
Showing
1
-
5 of
29 reviews
Showing All
Filter By:
-
Application: Chromatin ImmunoprecipitationSample Tested: HEK293Species: HumanVerified Customer | Posted 05/01/2024WB HIF1AChIP, IP

-
Application: Western BlotSample Tested: A549 cellsSpecies: HumanVerified Customer | Posted 05/28/2021HIF1a
-
Application: Western BlotSample Tested: Hep3B human hepatocellular carcinoma cell lineSpecies: HumanVerified Customer | Posted 03/15/2021HIF-1alpha expression in Hep3B cells exposed to 8 hours of hypoxia
-
Application: Western BlotSample Tested: cell line, whole cell lysateSpecies: Human and MouseVerified Customer | Posted 10/10/2020Western Blot: MDA-MB-231. MCF-7, 4T1 cells exposed to 1% O2 for 0, 6, 10, 24 hours. Whole cell lysates were loaded with 50 ug/lane. 10% SDS-PAGE. HIF-1 alpha (NB100-479) primary antibody: 1:2000, 4℃, overnight.
-
Application: Chromatin ImmunoprecipitationSample Tested: Breast cancer cellsSpecies: Human Breast Cancer Cell Lines and HumanVerified Customer | Posted 05/17/2020MDA-MB-231 cells were exposed to 20% or 1% O2 for 16 hours, and chromatin immunoprecipitation (ChIP) was performed with the indicated antibody (Ab). Primers flanking the HIF binding site in the S100A10 gene were used for qPCR.
-
Application: Western BlotSample Tested: 16-HBESpecies: HumanVerified Customer | Posted 04/16/2019HIF1a
-
Application: Western BlotSample Tested: Human Cancer CellsSpecies: HumanVerified Customer | Posted 09/18/2018This antibody was used to detect HIF-1alpha expression in control (NTC) and HIF-1alpha knockdown subclone in response to carboplatin treatment in human breast cancer cell line by western blot.
-
Application: Immunohistochemistry-ParaffinSample Tested: IHC on parrafin sections (mouse)Species: MouseVerified Customer | Posted 10/25/2017Staining of HIF1 alpha in mouse pancreatic cancer.
-
Application: Western BlotSample Tested: U251 glioma cell line; whole cell lysateSpecies: HumanVerified Customer | Posted 02/23/2017U251 cells exposed to hypoxia4 hour hypoxia (0.5% oxygen) incubation
-
Application: Western BlotSample Tested: Mouse kidneySpecies: MouseVerified Customer | Posted 09/21/2016
-
Application: Western BlotSample Tested:Species: MouseVerified Customer | Posted 08/06/2016
-
Application: Western BlotSample Tested: mouse retinaSpecies: MouseVerified Customer | Posted 10/05/2015Hif1a expression in normaxia (N) and hypoxia(H) mouse retinas from nucleus and cytosol lysis
-
Application: Western BlotSample Tested: Human cancer cell whole cell lysateSpecies: HumanVerified Customer | Posted 08/23/2015
-
Application: Western BlotSample Tested: Hela lysates treated with MG132Species: HumanVerified Customer | Posted 03/27/2015
-
Application: Western BlotSample Tested: Mouse heartSpecies: MouseVerified Customer | Posted 02/18/2015mouse heart
-
Application: Chromatin ImmunoprecipitationSample Tested: HEK293Species: HumanVerified Customer | Posted 12/15/2014
-
Application: Western BlotSample Tested: See PMID 23232625Species: MouseVerified Customer | Posted 12/12/2014
-
Application: Western BlotSample Tested: SK-N-BE(2) whole cell lysateSpecies: OtherVerified Customer | Posted 09/15/2014
-
Application: Western BlotSample Tested: HEK293 cell lysateSpecies: HumanVerified Customer | Posted 09/12/2014HEK293
-
Application: Western BlotSample Tested: PC12 whole cell lysateSpecies: OtherVerified Customer | Posted 08/18/2014
-
Application: Western BlotSample Tested: Human Pancreatic Cancer Cell lineSpecies: HumanVerified Customer | Posted 08/15/2014HIF1a NB100-479
-
Application: Western BlotSample Tested: Nuclear fraction, Human cell lineSpecies: HumanVerified Customer | Posted 07/18/2014
-
Application: Western BlotSample Tested: Human MCF7 breast epithelial cellsSpecies: HumanVerified Customer | Posted 10/29/2013
-
Application: Immunohistochemistry-ParaffinSample Tested: paraffin section of skin woundSpecies: MouseVerified Customer | Posted 06/27/2013
-
Application: Western BlotSample Tested: PC12 nuclear extract, Sample Amount: 50ugSpecies: RatVerified Customer | Posted 02/05/2012
-
Application: Western BlotSample Tested: PC12 cell whole lysate, Sample Amount: 25ugSpecies: RatVerified Customer | Posted 01/03/2012
-
Application: Immunohistochemistry-ParaffinSample Tested: normal mouse kidneySpecies: MouseVerified Customer | Posted 07/30/2011
-
Application: Immunohistochemistry-ParaffinSample Tested: Human Kidney tumorSpecies: HumanVerified Customer | Posted 03/01/2011
-
Application: Western BlotSample Tested: 4T1 cells whole cell lysateSpecies: MouseVerified Customer | Posted 02/01/2011
There are no reviews that match your criteria.
Protocols
View specific protocols for HIF-1 alpha Antibody - BSA Free (NB100-479):
Immunohistochemistry-Paraffin Embedded Sections
Antigen Unmasking:
Bring slides to a boil in 10 mM sodium citrate buffer (pH 6.0) then maintain at a sub-boiling temperature for 10 minutes. Cool slides on bench-top for 30 minutes (keep slides in the sodium citrate buffer at all times).
Staining:
1. Wash sections in deionized water three times for 5 minutes each.
2. Wash sections in PBS for 5 minutes.
3. Block each section with 100-400 ul blocking solution (1% BSA in PBS) for 1 hour at room temperature.
4. Remove blocking solution and add 100-400 ul diluted primary antibody. Incubate overnight at 4 C.
5. Remove antibody solution and wash sections in wash buffer three times for 5 minutes each.
6. Add 100-400 ul HRP polymer conjugated secondary antibody. Incubate 30 minutes at room temperature.
7. Wash sections three times in wash buffer for 5 minutes each.
8. Add 100-400 ul DAB substrate to each section and monitor staining closely.
9. As soon as the sections develop, immerse slides in deionized water.
10. Counterstain sections in hematoxylin.
11. Wash sections in deionized water two times for 5 minutes each.
12. Dehydrate sections.
13. Mount coverslips.
Western Blot Protocol I
1. Perform SDS-PAGE on samples to be analyzed, loading 10ug of total protein per lane.
2. Transfer proteins to Nitrocellulose membrane according to the instructions provided by the manufacturer of the transfer apparatus.
3. Stain the blot using ponceau S for 1-2 minutes to access the transfer of proteins onto the nitrocellulose membrane. Rinse the blot in water to remove excess stain and mark the lane locations and locations of molecular weight markers using a pencil.
4. Rinse the blot in TBS for approximately 5 minutes.
5. Block the membrane using 5% non-fat dry milk in TBS for 1.5 hours.
6. Dilute the rabbit anti-HIF-1 alpha primary antibody (NB 100-479) 1:500 in blocking buffer and incubate overnight at 4C.
7. Wash the membrane in water for 5 minutes and apply the diluted rabbit-IgG HRP-conjugated secondary antibody in blocking buffer (as per manufacturer's instructions) and incubate 1.5 hours at room temperature.
8. Wash the blot in TBS containing 0.05-0.1% Tween-20 for 10-20 minutes.
9. Wash the blot in type I water for an additional 10-20 minutes (this step can be repeated as required to reduce background).
10. Apply the detection reagent of choice in accordance with the manufacturer's instructions (Amersham ECL is the standard reagent used at Novus Biologicals).
Note: Tween-20 can be added to the blocking buffer at a final concentration of 0.05-0.2%, provided it does not interfere with antibody-antigen binding.
Western Blot Protocol II (MEF Nuclear Extracts) Nuclear Extract Preparation for HIF 1 alpha
1. Wild type and HIF1a -/- MEF cells, (initially plated at 6X10 6 cells/plate), are grown to near confluence in two 15-cm plates in 20 ml of media appropriate to cell type.
2. For hypoxic induction, 20 ml of fresh medium is added to all plates. One plate is sealed in modulator incubator chamber, flushed with 1% 02 gas for 2-3 min. at 2 psi, and incubated at 37C for 6 hrs.
3. The cells are washed once with ice cold PBS (10 mls/plate) and scraped with a rubber policeman into 5 mls of PBS. Work as quickly as possible. Cells are collected by centrifugation at 4°C for 5 minutes at 1500 X g. Control cells were incubated at 37C at 20% 02 are harvested in the same way.
4. At this point, cells may be frozen at - 80C after removing PBS.
5. For nuclear extract preparation, the cells are resuspended in 4 PCV of Buffer A. Cells are kept on ice for 10 minutes.
6. Cell suspension is homogenized with 25 strokes in a glass douncer with type b pestle (loose) and transferred to 1.5 ml Eppendorf tube.
7. Nuclei are pelleted by centrifugation for 10 minutes at 12,000 X g and resuspended in 3.5 packed cell volumes of Buffer C, and rotated for 45 minutes in the cold room.
8. The samples are centrifuged for 10 minutes at 20,000 X g, (or full speed for 90 min. in a refrigerated tabletop microfuge) aliquotted, and stored at - 80C.
Buffer A: 10 mM Tris (pH 7.5) 1.5 mM MgCl2 10 mM KCl freshly supplemented with 1:500 (v/v) of 1M DTT, 0.2M PMSF, 1 mg/ml Leupeptin, 1 mg/ml Aprotinin, 1 mg/ml Pepstatin, and 0.5M Na3VO4. Buffer C: 0.42M KCl 20 mM Tris (pH 7.5) 20% glycerol 1.5 mM Mg Cl2 freshly supplemented with 1:500 (v/v) of 1M DTT, 0.2M PMSF, 1 mg/ml Leupeptin, 1 mg/ml Aprotinin, 1 mg/ml Pepstatin, and 0.5M Na3VO4. Buffer A and C may be supplemented with Complete Protease Inhibitor Tablets (Roche) in lieu of individual inhibitors. However, DTT and sodium vanadate must still be added separately
Western Blotting
1.Cast 7.5 % SDS-PAGE gel and separate 50 ug nuclear protein and transfer to nitrocellulose membrane.
2. Block the membrane with 5% skim milk for 1 hour at room temperature.
3. Incubate with HIF1a antibody (NB 100-479, Novus Biologicals) 1:2000 for 2 hours at RT.
4. Wash 3 times with 1X TBST (Tween 0.1%) for 15 min. each
5. Incubate with Rabbit secondary antibody (HRP) 1:10000 (sc-2004, Santacruz Biotech) for 1hour at RT.
6. Wash 3 times with 1X TBST (Tween 0.1%) for 15 min. each
7. Use Amersham ECL kit for detection.
I. Deparaffinization:
A. Treat slides with Xylene: 3 changes for 5 minutes each. Drain slides for 10 seconds between changes.
B. Treat slides with 100% Reagent Alcohol: 3 changes for 5 minutes each. Drain slides for 10 seconds between changes.
II. Quench Endogenous Peroxidase:
A. Place slides in peroxidase quenching solution: 15-30 minutes.
To Prepare 200 ml of Quenching Solution:
Add 3 ml of 30% Hydrogen Peroxide to 200 ml of Methanol. Use within 4 hours of preparation
B. Place slides in distilled water: 2 changes for 2 minutes each.
III. Retrieve Epitopes:
A. Preheat Citrate Buffer. Place 200 ml of Citrate Buffer Working Solution into container, cover and place into steamer. Heat to 90-96C.
B. Place rack of slides into hot Citrate Buffer for 20 minutes. Cover.
C. Carefully remove container with slides from steamer and cool on bench, uncovered, for 20 minutes.
D. Slowly add distilled water to further cool for 5 minutes.
E. Rinse slides with distilled water. 2 changes for 2 minutes each.
IV. Immunostaining Procedure:
A. Remove each slide from rack and circle tissue section with a hydrophobic barrier pen (e.g. Liquid Blocker-Super Pap Pen).
B. Flood slide with Wash Solution.
Do not allow tissue sections to dry for the rest of the procedure.
C. Drain wash solution and apply 4 drops of Blocking Reagent to each slide and incubate for 15 minutes.
D. Drain Blocking Reagent (do not wash off the Blocking Reagent), apply 200 ul of Primary Antibody solution to each slide, and incubate for 1 hour.
E. Wash slides with Wash Solution: 3 changes for 5 minutes each.
F. Drain wash solution, apply 4 drops of Secondary antibody to each slide and incubate for 1 hour.
G. Wash slides with Wash Solution: 3 changes for 5 minutes each.
H. Drain wash solution, apply 4 drops of DAB Substrate to each slide and develop for 5-10 minutes.
Check development with microscope.
I. Wash slides with Wash Solution: 3 changes for 5 minutes each.
J. Drain wash solution, apply 4 drops of Hematoxylin to each slide and stain for 1-3 minutes.
Increase time if darker counterstaining is desired.
K. Wash slides with Wash Solution: 2-3 changes for 2 minutes each.
L. Drain wash solution and apply 4 drops of Bluing Solution to each slide for 1-2 minutes.
M. Rinse slides in distilled water.
N. Soak slides in 70% reagent alcohol: 3 minutes with intermittent agitation.
O. Soak slides in 95% reagent alcohol: 2 changes for 3 minutes each with intermittent agitation.
P. Soak slides in 100% reagent alcohol: 3 changes for 3 minutes each with intermittent agitation. Drain slides for 10 seconds between each change.
Q. Soak slides in Xylene: 3 changes for 3 minutes each with intermittent agitation. Drain slides for 10 seconds between each change.
R. Apply 2-3 drops of non-aqueous mounting media to each slide and mount coverslip.
S. Lay slides on a flat surface to dry prior to viewing under microscope.
NOTES:
-Use treated slides (e.g. HistoBond) to assure adherence of FFPE sections to slide.
-Prior to deparaffinization, heat slides overnight in a 60 degrees celcius oven.
-All steps in which Xylene is used should be performed in a fume hood.
-For Epitope Retrieval, a microwave or pressure cooker may be substituted for the steamer method. Adjust times as necessary depending on conditions.
-For the initial IHC run with a new primary antibody, test tissues with and without Epitope Retrieval. In some instances, Epitope Retrieval may not be necessary.
-200 ul is the recommended maximum volume to apply to a slide for full coverage. Using more than 200 ul may allow solutions to wick off the slide and create drying artifacts. For small tissue sections less than 200 ul may be used.
-5 minutes of development with DAB Substrate should be sufficient. Do not develop for more than 10 minutes. If 5 minutes of development causes background staining, further dilution of the primary antibody may be necessary.
-Hematoxylin should produce a light nuclear counterstain so as not to obscure the DAB staining.
Counterstain for 1-1 ½ minutes for nuclear antigens. Counterstain for 2-3 minutes for cytoplasmic and membranous antigens. If darker counterstaining is desired increase time (up to 10 minutes).
HIF-1alpha blots with normox and hypoxed Hepa 1-6 cells
1. Urea buffer for Protocol I -
2. Homogenization Buffer A: 20 mM HEPES (pH 7.5), 1.5 mM MgCl, 0.2 mM EDTA, 100 mM NaCl
3. 4 M NaCl
4. Dilution buffer B: 20mM HEPES (pH 7.5), 1.5 mM MgCl, 0.2 mM EDTA, 0.45M NaCl, 40% vol/vol glycerol, 2mM DTT, 0.4mM PMSF and 1mM sodium vanadate
5. 1 M DTT
6. Protease inhibitor cocktail tablets (Complete Mini, EDTA free) from Roche
7. 250 mM sodium orthovanadate (45.98 mg/ml in water) - Sigma
8. 13 mM deferoxamine (8.54 mg/ml – freshly made) - Sigma (cat# D9533)
9. Nonfat dry milk
10. PBST
11. SDS-PAGE gel, running buffer, sample loading buffer, markers
12. Hybond-P membrane (Amersham)
13. Electrophoresis and transfer buffers (NuPAGE/Invitrogen
14. Primary antibodies HIF-1alpha (mouse and human Novus) and beta-actin (Sigma)
15. Secondary antibody HRP conjugated goat anti-rabbit IgG (Pierce)
16. Amersham ECL Plus reagent
Cell Culture:
1. Plate Hepa cells (4 X 100 mm plates) one day before the experiment.
2. Culture O/N at 37C in 20% O2+ 5% CO2 incubator.
3. On the morning of the experiment, aspirate media and add 10ml fresh media (DMEM-HG + 10% FCS) equilibrated O/N at 1% O2 to two plates. Add 100 ul of 13 mM deferoxamine freshly resuspended in sterile water (final conc = 130 uM)
4. Leave the other two plates at 20% O2+ 5% CO2 incubator with fresh media.
5. Make the urea and HEPES buffers 15 min before the 4 h are up.
6. After 4h, take the plates out and work quickly.
7. Aspirate media.
8. Wash plate with PBS and aspirate. Add the lysis buffers at per protocol.
Protein extraction - Protocol I (urea):
Buffer prep just prior to use:
1. To 10 ml urea buffer add 1 protease inhibitor tablet.
2. Remove 1.5 ml 8M urea, 10mM Tris pH 6.8, 1% SDS + protease cocktail into a new tube.
3. Add 7.5 ul of 1M solution - 5 mM DTT final
Processing of cells.
1. Process one plate at a time as quickly as possible.
2. Add 500 ul of the above buffer to hypoxed (1%) and normox (20%) plate.
3. Scrape cells, collect to end side of the plate by tilted and transfer to a 1.7 ml microfuge tube. Pass the lysate 6-7X through a 1 ml syringe with 27 gauge needle to shear genomic DNA.
4. Remove a 50 ul aliquot and dilute it 1:10 to measure protein by Bradford reagent (BioRad).
5. Freeze the extract on dry ice and keep at -80C till the following day
Protein extraction - Protocol II (HEPES buffer)
1. Add 1 protease inhibitor tablet to 10 ml of buffer A and 1 tablet to 10 ml Buffer B.
2. Add 20 ul of 1 M DTT (final conc 2 mM) to each tube.
3. Add 40 ul of 0.25M sodium vanadate (final 1 mM) to each tube.
4. Add 250 ul of buffer A (20 mM HEPES (pH 7.5), 1.5 mM MgCl2, 0.2 mM EDTA, 100 mM NaCl), 2 mM DTT, protease cocktail and 1 mM Na vanadate
5. Add 21.87 ul of 4M NaCl (final conc of 0.45M).
6. Spin at 10,000g for 30 min at 4C.
7. Mix supernatant with an equal volume (270 ul) of 20mM HEPES (pH 7.5), 1.5 mM MgCl2, 0.2 mM EDTA, 0.45M NaCl, 40% vol/vol glycerol, 2mM DTT, 0.4mM PMSF and 1mM sodium orthovanadate.
8. Remove a 50 ul aliquot and dilute it 1:10 to measure protein by Bradford reagent (BioRad).
9. Freeze 450 ul supernatant at -80C.
10. Run 50 ug of protein on a 7% Tris acetate gel (NuPAGE/Invitrogen).
Gel and Blot:
1. Run 50 ug of protein on a 7 % Tris acetate gel (NuPAGE/Invitrogen).
2. Transfer to Hybond-P membrane (Amersham).
3. Block with 5% non-fat milk in PBST for O/N at 4C.
4. Incubate with HIF1alpha antibody 1:1000 for 1 h at RT.
5. Wash 3X with 1X PBST (Tween 0.1%) for 15 min each.
6. Incubate with HRP coupled goat anti-rabbit secondary antibody (Pierce cat# 1858415) 1:10,000 for 1h at RT.
7. Wash 3X with 1X PBST (Tween 0.1%) for 15 min each.
8. Use Amersham ECL Plus kit for detection. (from Kong, et al. JBC. 282: 15498-15505, 2008; with modifications by Rashmi Chandra, Duke University)
Find general support by application which include: protocols, troubleshooting, illustrated assays, videos and webinars.
- 7-Amino Actinomycin D (7-AAD) Cell Viability Flow Cytometry Protocol
- Antigen Retrieval Protocol (PIER)
- Antigen Retrieval for Frozen Sections Protocol
- Appropriate Fixation of IHC/ICC Samples
- Cellular Response to Hypoxia Protocols
- ChIP Protocol Video
- Chromatin Immunoprecipitation (ChIP) Protocol
- Chromatin Immunoprecipitation Protocol
- Chromogenic IHC Staining of Formalin-Fixed Paraffin-Embedded (FFPE) Tissue Protocol
- Chromogenic Immunohistochemistry Staining of Frozen Tissue
- ClariTSA™ Fluorophore Kits
- Detection & Visualization of Antibody Binding
- Extracellular Membrane Flow Cytometry Protocol
- Flow Cytometry Protocol for Cell Surface Markers
- Flow Cytometry Protocol for Staining Membrane Associated Proteins
- Flow Cytometry Staining Protocols
- Flow Cytometry Troubleshooting Guide
- Fluorescent IHC Staining of Frozen Tissue Protocol
- Graphic Protocol for Heat-induced Epitope Retrieval
- Graphic Protocol for the Preparation and Fluorescent IHC Staining of Frozen Tissue Sections
- Graphic Protocol for the Preparation and Fluorescent IHC Staining of Paraffin-embedded Tissue Sections
- Graphic Protocol for the Preparation of Gelatin-coated Slides for Histological Tissue Sections
- ICC Cell Smear Protocol for Suspension Cells
- ICC Immunocytochemistry Protocol Videos
- ICC for Adherent Cells
- IHC Sample Preparation (Frozen sections vs Paraffin)
- Immunocytochemistry (ICC) Protocol
- Immunocytochemistry Troubleshooting
- Immunofluorescence of Organoids Embedded in Cultrex Basement Membrane Extract
- Immunofluorescent IHC Staining of Formalin-Fixed Paraffin-Embedded (FFPE) Tissue Protocol
- Immunohistochemistry (IHC) and Immunocytochemistry (ICC) Protocols
- Immunohistochemistry Frozen Troubleshooting
- Immunohistochemistry Paraffin Troubleshooting
- Immunoprecipitation Protocol
- Intracellular Flow Cytometry Protocol Using Alcohol (Methanol)
- Intracellular Flow Cytometry Protocol Using Detergents
- Intracellular Nuclear Staining Flow Cytometry Protocol Using Detergents
- Intracellular Staining Flow Cytometry Protocol Using Alcohol Permeabilization
- Intracellular Staining Flow Cytometry Protocol Using Detergents to Permeabilize Cells
- Preparing Samples for IHC/ICC Experiments
- Preventing Non-Specific Staining (Non-Specific Binding)
- Primary Antibody Selection & Optimization
- Propidium Iodide Cell Viability Flow Cytometry Protocol
- Protocol for Heat-Induced Epitope Retrieval (HIER)
- Protocol for Liperfluo
- Protocol for Making a 4% Formaldehyde Solution in PBS
- Protocol for VisUCyte™ HRP Polymer Detection Reagent
- Protocol for the Characterization of Human Th22 Cells
- Protocol for the Characterization of Human Th9 Cells
- Protocol for the Fluorescent ICC Staining of Cell Smears - Graphic
- Protocol for the Fluorescent ICC Staining of Cultured Cells on Coverslips - Graphic
- Protocol for the Preparation & Fixation of Cells on Coverslips
- Protocol for the Preparation and Chromogenic IHC Staining of Frozen Tissue Sections
- Protocol for the Preparation and Chromogenic IHC Staining of Frozen Tissue Sections - Graphic
- Protocol for the Preparation and Chromogenic IHC Staining of Paraffin-embedded Tissue Sections
- Protocol for the Preparation and Chromogenic IHC Staining of Paraffin-embedded Tissue Sections - Graphic
- Protocol for the Preparation and Fluorescent ICC Staining of Cells on Coverslips
- Protocol for the Preparation and Fluorescent ICC Staining of Non-adherent Cells
- Protocol for the Preparation and Fluorescent ICC Staining of Stem Cells on Coverslips
- Protocol for the Preparation and Fluorescent IHC Staining of Frozen Tissue Sections
- Protocol for the Preparation and Fluorescent IHC Staining of Paraffin-embedded Tissue Sections
- Protocol for the Preparation of Gelatin-coated Slides for Histological Tissue Sections
- Protocol for the Preparation of a Cell Smear for Non-adherent Cell ICC - Graphic
- Protocol: Annexin V and PI Staining by Flow Cytometry
- Protocol: Annexin V and PI Staining for Apoptosis by Flow Cytometry
- R&D Systems Quality Control Western Blot Protocol
- TUNEL and Active Caspase-3 Detection by IHC/ICC Protocol
- The Importance of IHC/ICC Controls
- Troubleshooting Guide: Fluorokine Flow Cytometry Kits
- Troubleshooting Guide: Immunohistochemistry
- Troubleshooting Guide: Western Blot Figures
- Western Blot Conditions
- Western Blot Protocol
- Western Blot Protocol for Cell Lysates
- Western Blot Troubleshooting
- Western Blot Troubleshooting Guide
- View all Protocols, Troubleshooting, Illustrated assays and Webinars
FAQs for HIF-1 alpha Antibody - BSA Free
Showing
1
-
5 of
21 FAQs
Showing All
-
Q: Can HIF-1 alpha Antibody (Dylight 488), product NB100-479G, react with goat species? Does this product have preservatives in it?
A:
NB100-479G has not been tested in goat species. Only the listed species on the product page and datasheet will be guaranteed.
Reactivity: Hu, Mu, Rt, Ca, Fi, Ha, Pm, Rb
The immunogen for this antibody corresponds to amino acids 530-825 of mouse Hifa. Running a sequence alignment of this sequence with the goat sequence found on UniProt yields around 81% homology.Mouse Hif1a: https://www.uniprot.org/uniprot/Q61221#sequences
Goat Hif1a: https://www.uniprot.org/uniprot/A0A023R978#sequencesLastly, there is 0.05% Sodium Azide present in the formulation of the product. This is also listed on the product page and datasheet.
Buffer: 50mM Sodium Borate
Preservative: 0.05% Sodium Azide -
Q: Could you clarify if Yeast is a reactive species for HIF1a product #NB100-105?
A: This HIF-1 alpha antibody has not been tested in yeast. The homology is not significantly homologous so we do not believe there will be cross reactivity to the yeast protein.
-
Q: Do you sell a positive and negative control for the HIF-1 alpha antibody (NB100-479)?
A: For Western blot, the best positive control that we have is a CoCl2-treated Cos-7 cell lysate, catalog # NB800-PC26. The kit comes with a negative control as well. If you are doing ICC, then you could treat your cells with CoCl2 or expose them to hypoxic conditions.
-
Q: Does HIF-1 alpha antibody NB100-479 cross react with HIF-2?
A: None of the QC experiments conducted by the lab showed substantial background/band similar to HIF-2a. Additionally, a BLAST search comparing the immunogen of NB100-479 and the amino acid sequence of human HIF-1 alpha shows the homology between the two is low.
-
Q: I am curious to know the biochemical reactions of CoCl2 that mimic hypoxia. Is it that CoCl2 can bind any ubiquitin enzyme which regulates their degradation?
A:
CoCl2 inhibits PHD enzymes (the body’s “oxygen sensors”) by replacing the Fe ion with Co, preventing these enzymes from marking HIF-1 alpha for degradation. CoCl2-based hypoxia mimetic samples are often used as positive control in HIF analysis. For more troubleshooting tips and frequently asked questions regarding hypoxia/HIFs, you can refer to our hypoxia-related FAQs.
-
Q: I am doing HIF1 westerns in HIF-overexpressing mouse liver and adipose tissue using Novus antirabbit HIF1a antibody with overnight incubation. I am getting strong bands around 90kDa. I am aware that HIF theoretical molecular weight is 93kDa, but in westerns, the HIF band is usually around 120kDa according to my internet research. Can someone let me know if I’m getting the right HIF band or just some non-specific bands? Thanks.
A:
(1) HIF-1 alpha’s theoretical molecular weight is 93kDa. The post translationally modified/ubiquitinated form of HIF-1 alpha protein (fails to undergo proteasomal degradation) shows up as a band in the 110-130 kDa range on a Western blot.
(2) The dimeric protein may appear at a position above 200 kDa on non-reducing gels.
(3) Importantly, HIFs are among the most rapidly degradable proteins; therefore, sample preparation is highly important when analyzing HIF1 alpha or HIF2 alpha. When degraded, HIF-1 alpha may show up between 40-80 kDa position on Western blot. Degradation may be avoided by preparing the samples as soon as possible after collection of cells/tissues in hypoxic chamber. Notably, the tissues/cells should be kept on ice during lysate preparation and the lysates should be analyzed as soon as possible.
(4) For troubleshooting suggestions/feedback on more than 25 similar frequently asked questions, I would recommend visiting Novus page: FAQs - Hypoxia and HIFs
(5) Last but not the least, Novus technical support team may be contacted via email -
Q: I have Hif1a nuclear protein extract at -80C. I am wondering if anyone knows how long it would be good for at that temperature since HIf1a is known to be degraded easily.
Thank you!A: You could try a few things to further inhibit the degradation.
1) Use the protease inhibitors (if you are not already using them).
2) Lyse cells into a buffer that contains SDS or LDS (eg: Laemmli's buffer), since SDS and LDS denature and inhibit proteases. Lysis may even be performed with reducing agents in the buffer (eg. DTT), but this will make your lysates unsuitable for BCA assay.
3) Lysing samples rapidly ensures that the samples are instantly homogenized (it also shears DNA released by the SDS).
5) Flash-freezing samples in liquid nitrogen rather than freezing at -80*C reduces the window of time for protease activity.
6) Freeze samples in individual aliquots, instead of thawing the same vial multiple times. -
Q: I performed several Western Blots of HIF-1 alpha with different lysis buffers, whole lysates, and cytoplasm/nuclei extractions. I can’t seem to get a good western blot (poor signal, band much lower than expected, etc.). Can someone suggest some technical considerations/tricks I should consider using?
A:
A major issue that researchers working with HIF-1 alpha is degradation due to exposure to oxygen. In western blot, this results in a weaker band and/or the appearance of multiple low molecular weight bands (40-80 kDa). We recommend preparing the lysates after collection of cells/tissues as quickly as possible (on ice), preferably in a hypoxic chamber. We also recommend including a true hypoxia mimetic control (eg: cells treated with CoCl2, DMOG… etc.). The controls help distinguish your band of interest from potential degradation/dimer bands.
For more troubleshooting tips and frequently asked questions regarding hypoxia/HIFs, you can refer to our hypoxia-related FAQs. -
Q: I would like to know, does a path exist for detection of HIF 1 in venous blood before and after revascularization of the leg?
A: We are not entirely sure if HIF-1 alpha will be present in the leg after revascularization. It may be present, but you may want to search the literature to see if this has been looked at before. If not, then this would certainly be an experiment worth doing.
-
Q: Is cross-reactivity with HIF-2 alpha tested/predicted?
A: Although we don’t have cross-reactivity data with regards to HIF-2 alpha, we predict minimal cross-reactivity based on low sequence similarity observed from BLAST analysis between HIF-1 alpha and HIF-2 alpha.
-
Q: Is there a WB image for this antibody?
A: We do have a WB image for the antibody base product. It looks like they ordered an HRP conjugated format, and that specific format page does not have the image. We do all of our testing on the base product.
-
Q: Our lab recently ordered NB100-449, HIF-1 alpha antibody. Unfortunately an inexperienced technician stored it at -20C rather than 4C for approximately 2 days. Have you done any tests to determine antibody functionality if frozen?
A: The recommended storage condition of HIF-1 alpha antibody NB100-449 is 4C and we highly recommended not storing the product lower than the freezing point, as it may potentially disrupt the protein folding and destroy the antigen binding site of the antibody. Since we likely have not tested a storage condition of -20C for this antibody, we cannot really say if this antibody has been impaired by the storage condition. Our recommendation would be to test the antibody in a small portion of your treated cell line and see if the antibody is still reactive to the HIF-1 alpha protein.
-
Q: We got the Hif1a (NB100-105) antibody from you guys. I used the concentration that is mentioned on your website, but I am getting a band of a completely different size (~70kDa) and not the 120 kDa mentioned.
A:
HIF-1 alpha is a notoriously difficult protein to work with due to its rapid degradation. Therefore, the ~70kDa bands are most likely degradation products. It is very important to lyse the cells in hypoxic conditions. We strongly recommend lysing the cells directly into the Laemmli buffer and doing that quickly, so that the exposure to oxygen is minimized.
Please go through our hypoxia related FAQs, you should find them very informative.Also, running a positive control may help confirm the band specificity in your samples. You may prepare them yourself or choose some from our catalog, for example:
1) HeLa Hypoxic / Normoxic Cell Lysate (NBP2-36452)
2) HeLa Hypoxic (CoCl2) / Normoxic Cell Lysate (NBP2-36450) -
Q: We need to examine tissue-specific knockout of HIF-1a in mouse lungs. We have generated smooth muscle specific knockout of HIF-1a, and would like to demonstrate the knockdown in lung tissue sections by IHC or immunofluorescence. The problem is that all the antibodies for the mouse seem to have too much non-specific staining. Can you recommend an antibody that would be good for mouse lung tissue IHC or immunofluorescence?
A: The antibody with Catalog # NB100-479 is one of our best sellers and has 5 star rating in customer reviews. Please view the product datasheet to see the publications in which researchers have cited this product, over 10 of which are involved in mouse models.
-
Q: We ordered and received the HIF-1 alpha antibody NB100-449 and on the packing slip it says that is prepared in TBS+0.1% BSA. I will be using it for western blots. DO you think my choice of blocking buffer (milk or Blotto) could interfere with the activity of this antibody or should it be necessarily BSA based?
A:
Choice of blocking buffer is entirely within your discretion; it will not affect the antibody binding activity. Please note, some blocking buffers may work better than others and sometimes optimization is needed.
When working with hypoxia there are other important factors to consider, as HIF-alpha is very easily degraded. The lysates should be freshly prepared. Also lysate preparation should be as quick as possible to avoid any exposure to oxygen - we recommend lysing cells directly into the SDS sample loading buffer (Laemmli buffer). We also highly recommend using positive control (you can prepare them yourself or choose some of those we have for sale).
I have attached some additional information that you may find quite useful. Also here are some hypoxia related FAQ addressing common concerns. -
Q: What do think the blocking buffer should be?
A: We recommend 5% non-fat dry milk in TBS.
-
Q: What is the molecular weight (kDa) of protein HIF 1 alpha in western blot?
A: The theoretical molecular weight of HIF 1-alpha is ~93kDa. However, you will likely see a band between 100-120kDa due to phosphorylation.
-
Q: What's the difference between NBP2-75977 vs NBP2-75978?
A: While the same immunogen was used to make both HIF-1 alpha antibodies, they are different clones, meaning they recognize a different epitope on the immunogen.
-
Q: Which antibody(ies) do you recommend for the detection of HIF-1a by immunohistochemistry in the sections of paraffin-embedded mouse liver samples? I would appreciate if you can give me several choices and rank them in the order of performance. My goal is to distinguish HIF upregulation by prolyl hydroxylase inhibitor in different liver cells.
A: All of our antibodies are of high quality and are well tested/validated in species/applications we list on the datasheet. However, we suggest the following four HIF-1 alpha antibodies based upon customer reviews, as well as the number of peer reviewed publications in which these products have been cited by researchers from reputed institutes. (1) HIF-1 alpha Antibody (H1alpha67) (cat# NB100-105) (cited in at least 218 peer reviewed publications) (2) HIF-1 alpha Antibody (cat# NB100-479) (cited in at least 51 peer reviewed publications) (3) HIF-1 alpha Antibody (H1alpha67) (cat# NB100-123 ) (cited in at least 38 peer reviewed publications) (4) HIF-1 alpha Antibody (cat# NB100-449) (cited in at least 31 peer reviewed publications).
-
Q: Why is there a difference between the theoretical MW for HIF1A and the observed MW for HIF-1 alpha?
A: HIF1A, like many other proteins, has post-translational modifications. Depending on the size, amount and nature of the post-translational modifications, it can cause subtle to very large changes in molecular weight.
-
Q: Will this antibody detect HIF-1 alpha protein by WB on a breast cancer cell line in normal condition (without hypoxia)?
A:
If the breast cancer gene turned on the HIF1 alpha gene, there should be some expression of the protein, even without hypoxic induction. However, this expression may be very low, and depending on the length of time it took to lyse and/or fix the cells, may have degraded in the presence of oxygen. This may also be affected by the presence or lack of any HIF stabilizers in the lysate buffer. We talk about these stabilizers and other testing protocols in our white paper here. I would recommend trying to detect HIF expression in cancer cell lines that you run both positive and negative controls along side the cell lines to ensure that any bands detected are in fact HIF1 alpha.
-
Q: Can HIF-1 alpha Antibody (Dylight 488), product NB100-479G, react with goat species? Does this product have preservatives in it?
A:
NB100-479G has not been tested in goat species. Only the listed species on the product page and datasheet will be guaranteed.
Reactivity: Hu, Mu, Rt, Ca, Fi, Ha, Pm, Rb
The immunogen for this antibody corresponds to amino acids 530-825 of mouse Hifa. Running a sequence alignment of this sequence with the goat sequence found on UniProt yields around 81% homology.Mouse Hif1a: https://www.uniprot.org/uniprot/Q61221#sequences
Goat Hif1a: https://www.uniprot.org/uniprot/A0A023R978#sequencesLastly, there is 0.05% Sodium Azide present in the formulation of the product. This is also listed on the product page and datasheet.
Buffer: 50mM Sodium Borate
Preservative: 0.05% Sodium Azide -
Q: Could you clarify if Yeast is a reactive species for HIF1a product #NB100-105?
A: This HIF-1 alpha antibody has not been tested in yeast. The homology is not significantly homologous so we do not believe there will be cross reactivity to the yeast protein.
-
Q: Do you sell a positive and negative control for the HIF-1 alpha antibody (NB100-479)?
A: For Western blot, the best positive control that we have is a CoCl2-treated Cos-7 cell lysate, catalog # NB800-PC26. The kit comes with a negative control as well. If you are doing ICC, then you could treat your cells with CoCl2 or expose them to hypoxic conditions.
-
Q: Does HIF-1 alpha antibody NB100-479 cross react with HIF-2?
A: None of the QC experiments conducted by the lab showed substantial background/band similar to HIF-2a. Additionally, a BLAST search comparing the immunogen of NB100-479 and the amino acid sequence of human HIF-1 alpha shows the homology between the two is low.
-
Q: I am curious to know the biochemical reactions of CoCl2 that mimic hypoxia. Is it that CoCl2 can bind any ubiquitin enzyme which regulates their degradation?
A:
CoCl2 inhibits PHD enzymes (the body’s “oxygen sensors”) by replacing the Fe ion with Co, preventing these enzymes from marking HIF-1 alpha for degradation. CoCl2-based hypoxia mimetic samples are often used as positive control in HIF analysis. For more troubleshooting tips and frequently asked questions regarding hypoxia/HIFs, you can refer to our hypoxia-related FAQs.
-
Q: I am doing HIF1 westerns in HIF-overexpressing mouse liver and adipose tissue using Novus antirabbit HIF1a antibody with overnight incubation. I am getting strong bands around 90kDa. I am aware that HIF theoretical molecular weight is 93kDa, but in westerns, the HIF band is usually around 120kDa according to my internet research. Can someone let me know if I’m getting the right HIF band or just some non-specific bands? Thanks.
A:
(1) HIF-1 alpha’s theoretical molecular weight is 93kDa. The post translationally modified/ubiquitinated form of HIF-1 alpha protein (fails to undergo proteasomal degradation) shows up as a band in the 110-130 kDa range on a Western blot.
(2) The dimeric protein may appear at a position above 200 kDa on non-reducing gels.
(3) Importantly, HIFs are among the most rapidly degradable proteins; therefore, sample preparation is highly important when analyzing HIF1 alpha or HIF2 alpha. When degraded, HIF-1 alpha may show up between 40-80 kDa position on Western blot. Degradation may be avoided by preparing the samples as soon as possible after collection of cells/tissues in hypoxic chamber. Notably, the tissues/cells should be kept on ice during lysate preparation and the lysates should be analyzed as soon as possible.
(4) For troubleshooting suggestions/feedback on more than 25 similar frequently asked questions, I would recommend visiting Novus page: FAQs - Hypoxia and HIFs
(5) Last but not the least, Novus technical support team may be contacted via email -
Q: I have Hif1a nuclear protein extract at -80C. I am wondering if anyone knows how long it would be good for at that temperature since HIf1a is known to be degraded easily.
Thank you!A: You could try a few things to further inhibit the degradation.
1) Use the protease inhibitors (if you are not already using them).
2) Lyse cells into a buffer that contains SDS or LDS (eg: Laemmli's buffer), since SDS and LDS denature and inhibit proteases. Lysis may even be performed with reducing agents in the buffer (eg. DTT), but this will make your lysates unsuitable for BCA assay.
3) Lysing samples rapidly ensures that the samples are instantly homogenized (it also shears DNA released by the SDS).
5) Flash-freezing samples in liquid nitrogen rather than freezing at -80*C reduces the window of time for protease activity.
6) Freeze samples in individual aliquots, instead of thawing the same vial multiple times. -
Q: I performed several Western Blots of HIF-1 alpha with different lysis buffers, whole lysates, and cytoplasm/nuclei extractions. I can’t seem to get a good western blot (poor signal, band much lower than expected, etc.). Can someone suggest some technical considerations/tricks I should consider using?
A:
A major issue that researchers working with HIF-1 alpha is degradation due to exposure to oxygen. In western blot, this results in a weaker band and/or the appearance of multiple low molecular weight bands (40-80 kDa). We recommend preparing the lysates after collection of cells/tissues as quickly as possible (on ice), preferably in a hypoxic chamber. We also recommend including a true hypoxia mimetic control (eg: cells treated with CoCl2, DMOG… etc.). The controls help distinguish your band of interest from potential degradation/dimer bands.
For more troubleshooting tips and frequently asked questions regarding hypoxia/HIFs, you can refer to our hypoxia-related FAQs. -
Q: I would like to know, does a path exist for detection of HIF 1 in venous blood before and after revascularization of the leg?
A: We are not entirely sure if HIF-1 alpha will be present in the leg after revascularization. It may be present, but you may want to search the literature to see if this has been looked at before. If not, then this would certainly be an experiment worth doing.
-
Q: Is cross-reactivity with HIF-2 alpha tested/predicted?
A: Although we don’t have cross-reactivity data with regards to HIF-2 alpha, we predict minimal cross-reactivity based on low sequence similarity observed from BLAST analysis between HIF-1 alpha and HIF-2 alpha.
-
Q: Is there a WB image for this antibody?
A: We do have a WB image for the antibody base product. It looks like they ordered an HRP conjugated format, and that specific format page does not have the image. We do all of our testing on the base product.
-
Q: Our lab recently ordered NB100-449, HIF-1 alpha antibody. Unfortunately an inexperienced technician stored it at -20C rather than 4C for approximately 2 days. Have you done any tests to determine antibody functionality if frozen?
A: The recommended storage condition of HIF-1 alpha antibody NB100-449 is 4C and we highly recommended not storing the product lower than the freezing point, as it may potentially disrupt the protein folding and destroy the antigen binding site of the antibody. Since we likely have not tested a storage condition of -20C for this antibody, we cannot really say if this antibody has been impaired by the storage condition. Our recommendation would be to test the antibody in a small portion of your treated cell line and see if the antibody is still reactive to the HIF-1 alpha protein.
-
Q: We got the Hif1a (NB100-105) antibody from you guys. I used the concentration that is mentioned on your website, but I am getting a band of a completely different size (~70kDa) and not the 120 kDa mentioned.
A:
HIF-1 alpha is a notoriously difficult protein to work with due to its rapid degradation. Therefore, the ~70kDa bands are most likely degradation products. It is very important to lyse the cells in hypoxic conditions. We strongly recommend lysing the cells directly into the Laemmli buffer and doing that quickly, so that the exposure to oxygen is minimized.
Please go through our hypoxia related FAQs, you should find them very informative.Also, running a positive control may help confirm the band specificity in your samples. You may prepare them yourself or choose some from our catalog, for example:
1) HeLa Hypoxic / Normoxic Cell Lysate (NBP2-36452)
2) HeLa Hypoxic (CoCl2) / Normoxic Cell Lysate (NBP2-36450) -
Q: We need to examine tissue-specific knockout of HIF-1a in mouse lungs. We have generated smooth muscle specific knockout of HIF-1a, and would like to demonstrate the knockdown in lung tissue sections by IHC or immunofluorescence. The problem is that all the antibodies for the mouse seem to have too much non-specific staining. Can you recommend an antibody that would be good for mouse lung tissue IHC or immunofluorescence?
A: The antibody with Catalog # NB100-479 is one of our best sellers and has 5 star rating in customer reviews. Please view the product datasheet to see the publications in which researchers have cited this product, over 10 of which are involved in mouse models.
-
Q: We ordered and received the HIF-1 alpha antibody NB100-449 and on the packing slip it says that is prepared in TBS+0.1% BSA. I will be using it for western blots. DO you think my choice of blocking buffer (milk or Blotto) could interfere with the activity of this antibody or should it be necessarily BSA based?
A:
Choice of blocking buffer is entirely within your discretion; it will not affect the antibody binding activity. Please note, some blocking buffers may work better than others and sometimes optimization is needed.
When working with hypoxia there are other important factors to consider, as HIF-alpha is very easily degraded. The lysates should be freshly prepared. Also lysate preparation should be as quick as possible to avoid any exposure to oxygen - we recommend lysing cells directly into the SDS sample loading buffer (Laemmli buffer). We also highly recommend using positive control (you can prepare them yourself or choose some of those we have for sale).
I have attached some additional information that you may find quite useful. Also here are some hypoxia related FAQ addressing common concerns. -
Q: What do think the blocking buffer should be?
A: We recommend 5% non-fat dry milk in TBS.
-
Q: What is the molecular weight (kDa) of protein HIF 1 alpha in western blot?
A: The theoretical molecular weight of HIF 1-alpha is ~93kDa. However, you will likely see a band between 100-120kDa due to phosphorylation.
-
Q: What's the difference between NBP2-75977 vs NBP2-75978?
A: While the same immunogen was used to make both HIF-1 alpha antibodies, they are different clones, meaning they recognize a different epitope on the immunogen.
-
Q: Which antibody(ies) do you recommend for the detection of HIF-1a by immunohistochemistry in the sections of paraffin-embedded mouse liver samples? I would appreciate if you can give me several choices and rank them in the order of performance. My goal is to distinguish HIF upregulation by prolyl hydroxylase inhibitor in different liver cells.
A: All of our antibodies are of high quality and are well tested/validated in species/applications we list on the datasheet. However, we suggest the following four HIF-1 alpha antibodies based upon customer reviews, as well as the number of peer reviewed publications in which these products have been cited by researchers from reputed institutes. (1) HIF-1 alpha Antibody (H1alpha67) (cat# NB100-105) (cited in at least 218 peer reviewed publications) (2) HIF-1 alpha Antibody (cat# NB100-479) (cited in at least 51 peer reviewed publications) (3) HIF-1 alpha Antibody (H1alpha67) (cat# NB100-123 ) (cited in at least 38 peer reviewed publications) (4) HIF-1 alpha Antibody (cat# NB100-449) (cited in at least 31 peer reviewed publications).
-
Q: Why is there a difference between the theoretical MW for HIF1A and the observed MW for HIF-1 alpha?
A: HIF1A, like many other proteins, has post-translational modifications. Depending on the size, amount and nature of the post-translational modifications, it can cause subtle to very large changes in molecular weight.
-
Q: Will this antibody detect HIF-1 alpha protein by WB on a breast cancer cell line in normal condition (without hypoxia)?
A:
If the breast cancer gene turned on the HIF1 alpha gene, there should be some expression of the protein, even without hypoxic induction. However, this expression may be very low, and depending on the length of time it took to lyse and/or fix the cells, may have degraded in the presence of oxygen. This may also be affected by the presence or lack of any HIF stabilizers in the lysate buffer. We talk about these stabilizers and other testing protocols in our white paper here. I would recommend trying to detect HIF expression in cancer cell lines that you run both positive and negative controls along side the cell lines to ensure that any bands detected are in fact HIF1 alpha.
Loading...
Associated Pathways


