Cathepsin D is a lysosomal aspartic protease of the pepsin family (4). Mouse Cathepsin D is synthesized as a precursor protein, consisting of a signal peptide (residues 1-20), a propeptide (residues 21-64), and a mature chain (residues 65-410) (1-3). It is expressed in most cells and over-expressed in breast cancer cells (5). It is a major enzyme in protein degradation in lysosomes, and also involved in the presentation of antigenic peptides. Mice deficient in this enzyme showed a progressive atrophy of the intestinal mucosa, a massive destruction of lymphoid organs, and a profound neuronal ceroid lipofucinosis, indicating that Cathepsin D is essential for proteolysis of proteins regulating cell growth and tissue homeostasis (6). Cathepsin D secreted from human prostate carcinoma cells is responsible for the generation of angiostatin, a potent endogeneous inhibitor of angiogenesis (6).

Key Product Details
Validated by
Biological Validation
Species Reactivity
Validated:
Mouse
Cited:
Human, Mouse, Rat, Transgenic Mouse
Applications
Validated:
Immunohistochemistry, Western Blot, Immunocytochemistry, Immunoprecipitation
Cited:
Immunohistochemistry, Immunohistochemistry-Paraffin, Immunohistochemistry-Frozen, Western Blot, Immunocytochemistry, Immunocytochemistry/ Immunofluorescence, Immunoprecipitation, Functional Assay
Label
Unconjugated
Antibody Source
Polyclonal Goat IgG
Loading...
Product Specifications
Immunogen
Mouse myeloma cell line NS0-derived recombinant mouse Cathepsin D
Ile21-Leu410
Accession # Q3UCD9
Ile21-Leu410
Accession # Q3UCD9
Specificity
Detects mouse Cathepsin D in direct ELISAs and Western blots.
Clonality
Polyclonal
Host
Goat
Isotype
IgG
Scientific Data Images for Mouse Cathepsin D Antibody
Detection of Mouse Cathepsin D by Western Blot.
Western blot shows lysate of mouse intestine tissue. PVDF membrane was probed with 1 µg/mL of Goat Anti-Mouse Cathepsin D Antigen Affinity-purified Polyclonal Antibody (Catalog # AF1029) followed by HRP-conjugated Anti-Goat IgG Secondary Antibody (HAF017). Specific bands were detected for Cathepsin D at approximately 28 and 45 kDa (as indicated). This experiment was conducted under reducing conditions and using Immunoblot Buffer Group 1.
Cathepsin D in RAW 264.7 Mouse Cell Line.
Cathepsin D was detected in immersion fixed RAW 264.7 mouse monocyte/macrophage cell line using Goat Anti-Mouse Cathepsin D Antigen Affinity-purified Polyclonal Antibody (Catalog # AF1029) at 5 µg/mL for 3 hours at room temperature. Cells were stained using the NorthernLights™ 557-conjugated Anti-Goat IgG Secondary Antibody (red; NL001) and counterstained with DAPI (blue). Specific staining was localized to lysosomes. View our protocol for Fluorescent ICC Staining of Cells on Coverslips.
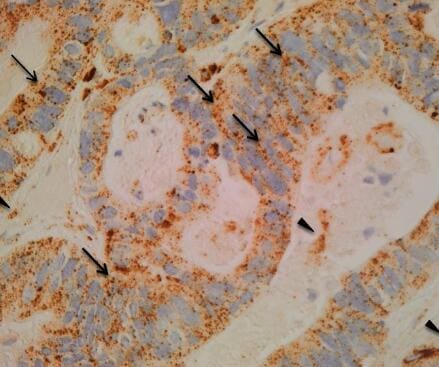
Cathepsin D in Mouse Intestine.
Cathepsin D was detected in perfusion fixed frozen sections of mouse intestine using 15 µg/mL Goat Anti-Mouse Cathepsin D Antigen Affinity-purified Polyclonal Antibody (Catalog # AF1029) overnight at 4 °C. Tissue was stained with the Anti-Goat HRP-DAB Cell & Tissue Staining Kit (brown; CTS008) and counter-stained with hematoxylin (blue). Specific labeling was localized to epithelial cells in intestinal villi. View our protocol for Chromogenic IHC Staining of Frozen Tissue Sections.
Detection of Human Cathepsin D by Western Blot
Chronic treatment with BACE1 inhibitors causes accumulation of CatD.(a) Representative western blot of brain homogenates prepared from mice dosed daily for 30 days with PF-9283 (80 mg kg−1) showed increased levels of CatD heavy and light chains, but not the CatD single chain, compared with a vehicle control. Data are presented as mean (normalized to actin)±s.e.m.; n=5 (PF-9283) and n=6 (veh) per group. (b) ELISA of live ARPE-19 cells incubated with BACE1 inhibitors for 7 days showed accumulation of CatD; the extent of accumulation was consistent with cellular CatD IC50 values (Supplementary Table 4). Data are presented as mean±s.e.m. for three independent experiments. (c) Proteomic analysis of RPE tissue prepared from rats dosed daily for 14 days with 80 mg kg−1 PF-9283. Peptide spectral matches (PSM) of 11 of 391 identified proteins were changed more than 1.5-fold (P<0.01, red symbols, see also Supplementary Table 5) compared with vehicle controls including a 1.7-fold increase in CatD (***P=0.0002). Average PSM were calculated from six LC-MS runs consisting of two technical replicates of n=3 RPE tissues per group. For a–c, significant differences were determined using a two-tailed t-test; *P<0.05, **P<0.01, ***P<0.001. Image collected and cropped by CiteAb from the following open publication (https://pubmed.ncbi.nlm.nih.gov/27727204), licensed under a CC-BY license. Not internally tested by R&D Systems.
Detection of Cathepsin D by Immunocytochemistry/ Immunofluorescence
sPLA2 inhibitor treatment rescues PGRN deficiency phenotypes in mice. 5-week-old Pla2g2a+/+Grn+/+ and Pla2g2a+/+Grn−/− mice in FVB/B6 mixed background were treated with corn oil control or sPLA2 inhibitors, LY333013 or KH064 for 3 weeks. (a) Measurement of total sPLA2 activity in the serum and cortical lysates from untreated and LY333013 or KH064-treated mice. Data are presented as mean ± SEM from five mice per group (n = 5). *, p < 0.05; **, p < 0.01, Student’s t-test. (b) Brain sections were immunostained with anti-GFAP, CD68, and IBA1 antibodies, and representative images from the cortex region were shown (Scale bar = 100 μm). Another set of brain sections was stained with Hoechst and auto-fluorescent lipofuscin signals (red) in the thalamus region were imaged (scale bar = 10 μm). (c) Quantification of GFAP, CD68, and IBA1 levels and auto-fluorescent lipofuscin signals for the experiment in (b). Data are presented as mean ± SEM from five mice per group (n = 5). 3 sections were analyzed for each mouse brain. *, p < 0.05; **, p < 0.01, Student’s t-test. (d) Brain sections were immunostained with anti-CathD, NeuN, and IBA1 antibodies, and representative images from the cortex region were shown (Scale bar = 10 μm). (e) CathD signals in IBA1-positive microglia and NeuN-positive neurons were quantified. 10–20 confocal images were randomly captured from each brain section. Ten to twenty microglia and fifty to sixty neurons were quantified per section. 3 sections were analyzed for each mouse brain. Data are presented as mean ± SEM from 3–4 mice per group (n = 3–4). *, p < 0.05; **, p < 0.01, Student’s t-test Image collected and cropped by CiteAb from the following open publication (https://pubmed.ncbi.nlm.nih.gov/40528203), licensed under a CC-BY license. Not internally tested by R&D Systems.
Detection of Cathepsin D by Immunocytochemistry/ Immunofluorescence
AAV9-mediated overexpression of sPLA2-IIA leads to lipofuscin accumulation and lysosomal enlargement in microglia in 2-month-old B6 Grn−/− mice. B6 WT (Pla2g2−/−Grn+/+) and Grn−/− (Pla2g2a−/−Grn−/−) pups at postnatal day (P0) were injected with AAV9-sPLA2-IIA or the buffer control, and the mice were collected at 2 months old. (a) Brain sections were stained with NeuN and IBA1, and auto-fluorescent lipofuscin signals (blue) in the cortex region were imaged (scale bar = 10 μm). (b) Quantification of autofluorescent lipofuscin signals in the cortex. Data are presented as mean ± SEM from three to five mice per group (n = 3–5). Three sections were analyzed for each mouse brain. *, p < 0.05; **, p < 0.01; ****, p < 0.0001, Student’s t-test. (c) Brain sections were immunostained with anti-CathD, NeuN, and IBA1 antibodies, and representative images from the cortex region were shown (Scale bar = 10 μm). (d) CathD signals in IBA1-positive microglia and NeuN-positive neurons were quantified. 10–20 confocal images were randomly captured from each brain section. Fifteen to thirty microglia and fifty to sixty neurons were quantified per Sect. 3 sections were analyzed for each mouse brain. Data are presented as mean ± SEM from 3–5 mice per group (n = 3–5). *, p < 0.05; **, p < 0.01; ****, p < 0.0001, Student’s t-test Image collected and cropped by CiteAb from the following open publication (https://pubmed.ncbi.nlm.nih.gov/40528203), licensed under a CC-BY license. Not internally tested by R&D Systems.Applications for Mouse Cathepsin D Antibody
Application
Recommended Usage
Immunocytochemistry
5-15 µg/mL
Sample: Immersion fixed RAW264.7 mouse monocyte/macrophage cell line
Sample: Immersion fixed RAW264.7 mouse monocyte/macrophage cell line
Immunohistochemistry
5-15 µg/mL
Sample: Perfusion fixed frozen sections of mouse intestine
Sample: Perfusion fixed frozen sections of mouse intestine
Immunoprecipitation
25 µg/mL
Sample: Conditioned cell culture medium spiked with Recombinant Mouse Cathepsin D (Catalog # 1029-AS), see our available Western blot detection antibodies
Sample: Conditioned cell culture medium spiked with Recombinant Mouse Cathepsin D (Catalog # 1029-AS), see our available Western blot detection antibodies
Western Blot
1 µg/mL
Sample: Mouse intestine tissue
Sample: Mouse intestine tissue
Reviewed Applications
Read 2 reviews rated 5 using AF1029 in the following applications:
Formulation, Preparation, and Storage
Purification
Antigen Affinity-purified
Reconstitution
Reconstitute at 0.2 mg/mL in sterile PBS. For liquid material, refer to CoA for concentration.
Loading...
Formulation
Lyophilized from a 0.2 μm filtered solution in PBS with Trehalose. *Small pack size (SP) is supplied either lyophilized or as a 0.2 µm filtered solution in PBS.
Shipping
Lyophilized product is shipped at ambient temperature. Liquid small pack size (-SP) is shipped with polar packs. Upon receipt, store immediately at the temperature recommended below.
Stability & Storage
Use a manual defrost freezer and avoid repeated freeze-thaw cycles.
- 12 months from date of receipt, -20 to -70 °C as supplied.
- 1 month, 2 to 8 °C under sterile conditions after reconstitution.
- 6 months, -20 to -70 °C under sterile conditions after reconstitution.
Calculators
Background: Cathepsin D
References
- Diedrich, et al. (1990) Nucl. Acid Res. 18:7184.
- Grusby, et al. (1990) Nucl. Acid Res. 18:4008.
- Hetman, et al. (1994) DNA Cell Biol. 13:419.
- Conner, (2004) in Handbook of Proteolytic Enzymes (Barrett, et al. eds) Elsevier Academic Press, San Diego, p. 43.
- Rochefort, et al. (2000) Clin. Chim. Acta. 291:157.
- Tsukuba, et al. (2000) Mol. Cells 10:601.
Alternate Names
CTSD
Gene Symbol
CTSD
UniProt
Additional Cathepsin D Products
Product Documents for Mouse Cathepsin D Antibody
Certificate of Analysis
To download a Certificate of Analysis, please enter a lot or batch number in the search box below.
Note: Certificate of Analysis not available for kit components.
Product Specific Notices for Mouse Cathepsin D Antibody
For research use only
Citations for Mouse Cathepsin D Antibody
 Powered by Bioz
Customer Reviews for Mouse Cathepsin D Antibody (2)
5 out of 5
2 Customer Ratings
Have you used Mouse Cathepsin D Antibody?
Submit a review and receive an Amazon gift card!
$25/€18/£15/$25CAN/¥2500 Yen for a review with an image
$10/€7/£6/$10CAN/¥1110 Yen for a review without an image
Submit a review
Customer Images
Showing
1
-
2 of
2 reviews
Showing All
Filter By:
-
Application: ImmunohistochemistrySample Tested: Colon tissueSpecies: MouseVerified Customer | Posted 08/05/20201:200 dilution

-
Application: Flow CytometrySample Tested: Bladder tissueSpecies: HumanVerified Customer | Posted 10/31/2017
There are no reviews that match your criteria.
Protocols
Find general support by application which include: protocols, troubleshooting, illustrated assays, videos and webinars.
- Antigen Retrieval Protocol (PIER)
- Antigen Retrieval for Frozen Sections Protocol
- Appropriate Fixation of IHC/ICC Samples
- Cellular Response to Hypoxia Protocols
- Chromogenic IHC Staining of Formalin-Fixed Paraffin-Embedded (FFPE) Tissue Protocol
- Chromogenic Immunohistochemistry Staining of Frozen Tissue
- ClariTSA™ Fluorophore Kits
- Detection & Visualization of Antibody Binding
- Fluorescent IHC Staining of Frozen Tissue Protocol
- Graphic Protocol for Heat-induced Epitope Retrieval
- Graphic Protocol for the Preparation and Fluorescent IHC Staining of Frozen Tissue Sections
- Graphic Protocol for the Preparation and Fluorescent IHC Staining of Paraffin-embedded Tissue Sections
- Graphic Protocol for the Preparation of Gelatin-coated Slides for Histological Tissue Sections
- ICC Cell Smear Protocol for Suspension Cells
- ICC Immunocytochemistry Protocol Videos
- ICC for Adherent Cells
- IHC Sample Preparation (Frozen sections vs Paraffin)
- Immunocytochemistry (ICC) Protocol
- Immunocytochemistry Troubleshooting
- Immunofluorescence of Organoids Embedded in Cultrex Basement Membrane Extract
- Immunofluorescent IHC Staining of Formalin-Fixed Paraffin-Embedded (FFPE) Tissue Protocol
- Immunohistochemistry (IHC) and Immunocytochemistry (ICC) Protocols
- Immunohistochemistry Frozen Troubleshooting
- Immunohistochemistry Paraffin Troubleshooting
- Immunoprecipitation Protocol
- Preparing Samples for IHC/ICC Experiments
- Preventing Non-Specific Staining (Non-Specific Binding)
- Primary Antibody Selection & Optimization
- Protocol for Heat-Induced Epitope Retrieval (HIER)
- Protocol for Making a 4% Formaldehyde Solution in PBS
- Protocol for VisUCyte™ HRP Polymer Detection Reagent
- Protocol for the Fluorescent ICC Staining of Cell Smears - Graphic
- Protocol for the Fluorescent ICC Staining of Cultured Cells on Coverslips - Graphic
- Protocol for the Preparation & Fixation of Cells on Coverslips
- Protocol for the Preparation and Chromogenic IHC Staining of Frozen Tissue Sections
- Protocol for the Preparation and Chromogenic IHC Staining of Frozen Tissue Sections - Graphic
- Protocol for the Preparation and Chromogenic IHC Staining of Paraffin-embedded Tissue Sections
- Protocol for the Preparation and Chromogenic IHC Staining of Paraffin-embedded Tissue Sections - Graphic
- Protocol for the Preparation and Fluorescent ICC Staining of Cells on Coverslips
- Protocol for the Preparation and Fluorescent ICC Staining of Non-adherent Cells
- Protocol for the Preparation and Fluorescent ICC Staining of Stem Cells on Coverslips
- Protocol for the Preparation and Fluorescent IHC Staining of Frozen Tissue Sections
- Protocol for the Preparation and Fluorescent IHC Staining of Paraffin-embedded Tissue Sections
- Protocol for the Preparation of Gelatin-coated Slides for Histological Tissue Sections
- Protocol for the Preparation of a Cell Smear for Non-adherent Cell ICC - Graphic
- R&D Systems Quality Control Western Blot Protocol
- TUNEL and Active Caspase-3 Detection by IHC/ICC Protocol
- The Importance of IHC/ICC Controls
- Troubleshooting Guide: Immunohistochemistry
- Troubleshooting Guide: Western Blot Figures
- Western Blot Conditions
- Western Blot Protocol
- Western Blot Protocol for Cell Lysates
- Western Blot Troubleshooting
- Western Blot Troubleshooting Guide
- View all Protocols, Troubleshooting, Illustrated assays and Webinars
Loading...
Associated Pathways
