
Key Product Details
Species Reactivity
Validated:
Mouse
Cited:
Mouse
Applications
Validated:
Immunohistochemistry, Flow Cytometry, CyTOF-ready
Cited:
Immunohistochemistry, Immunohistochemistry-Frozen, Neutralization, Flow Cytometry, Immunocytochemistry, ELISA Development (Capture)
Label
Unconjugated
Antibody Source
Monoclonal Rat IgG2A Clone # 140706
Loading...
Product Specifications
Immunogen
RBL-1 rat basophilic leukemia cell line transfected with mouse CCR6
Met1-Met367
Accession # O54689
Met1-Met367
Accession # O54689
Specificity
Detects mouse CCR6-transfected rat RBL cells but not the parent cell line or cells transfected with mouse CCR5.
Clonality
Monoclonal
Host
Rat
Isotype
IgG2A
Scientific Data Images for Mouse CCR6 Antibody (140706)
Detection of CCR6 in Mouse Splenocytes by Flow Cytometry.
Mouse splenocytes were stained with (A) Rat Anti-Mouse CCR6 Monoclonal Antibody (Catalog # MAB590) or (B) Rat IgG2A control antibody (Catalog # MAB006) followed by Goat anti-Rat IgG APC-conjugated Secondary Antibody (Catalog # F0113) and Rat Anti-Mouse B220/CD45R Fluorescein-conjugated Monoclonal Antibody (Catalog # FAB1217F). View our protocol for Staining Membrane-associated Proteins.
CCR6 in Mouse Thymus.
CCR6 was detected in perfusion fixed frozen sections of mouse thymus using Mouse CCR6 Monoclonal Antibody (Catalog # MAB590) at 8 µg/mL overnight at 4 °C. Tissue was stained using the Anti-Rat HRP-DAB Cell & Tissue Staining Kit (brown; Catalog # CTS017) and counterstained with hematoxylin (blue). Specific labeling was localized to the plasma membrane of lymphocytes. View our protocol for Chromogenic IHC Staining of Frozen Tissue Sections.
CCR6 in Mouse Spleen.
CCR6 was detected in immersion fixed frozen sections of mouse spleen using Rat Anti-Mouse CCR6 Monoclonal Antibody (Catalog # MAB590) at 0.3 µg/mL overnight at 4 °C. Tissue was stained using the Anti-Rat HRP-DAB Cell & Tissue Staining Kit (brown; Catalog # CTS017) and counterstained with hematoxylin (blue). Specific staining was localized to plasma membranes in lymphocytes. View our protocol for Chromogenic IHC Staining of Frozen Tissue Sections.
Detection of Mouse CCR6 by Flow Cytometry
Priming of pik3cg−/− CD4+ T cells is reduced during EAE.(A) Frequencies of CD4+ cells in draining LN that are CD69+ on day 9 post-immunisation for EAE as determined by flow cytometry. A representative histogram overlay gating on CD4+ cells is shown (filled = isotype control on WT, solid line = anti-CD69 on WT, dotted line = anti-CD69 on pik3cg−/−) (B) In vivo proliferation of CD4+ cells, measured by BrdU incorporation, is reduced in pik3cg−/− mice at day 9 post-immunization for EAE. (n = 6 mice per group). Representative dot plots gating on CD4+ cells are shown. (C) Expression of chemokine receptors by CD4+ T cells indicative of T cell activation was determined by flow cytometry. Representative histogram overlays showing expression of CCR7, CCR6 and CXCR3 are shown (filled = isotype control, solid line = WT, dotted line = pik3cg−/−). (D) Expression of CD62L, CD49d and PSGL-1 by CD4+ cells from spleen of day 9 immunised mice (n = 3 mice per group). All data shown are mean ± s.e.m. (*, p<0.05). Image collected and cropped by CiteAb from the following publication (https://dx.plos.org/10.1371/journal.pone.0045095), licensed under a CC-BY license. Not internally tested by R&D Systems.
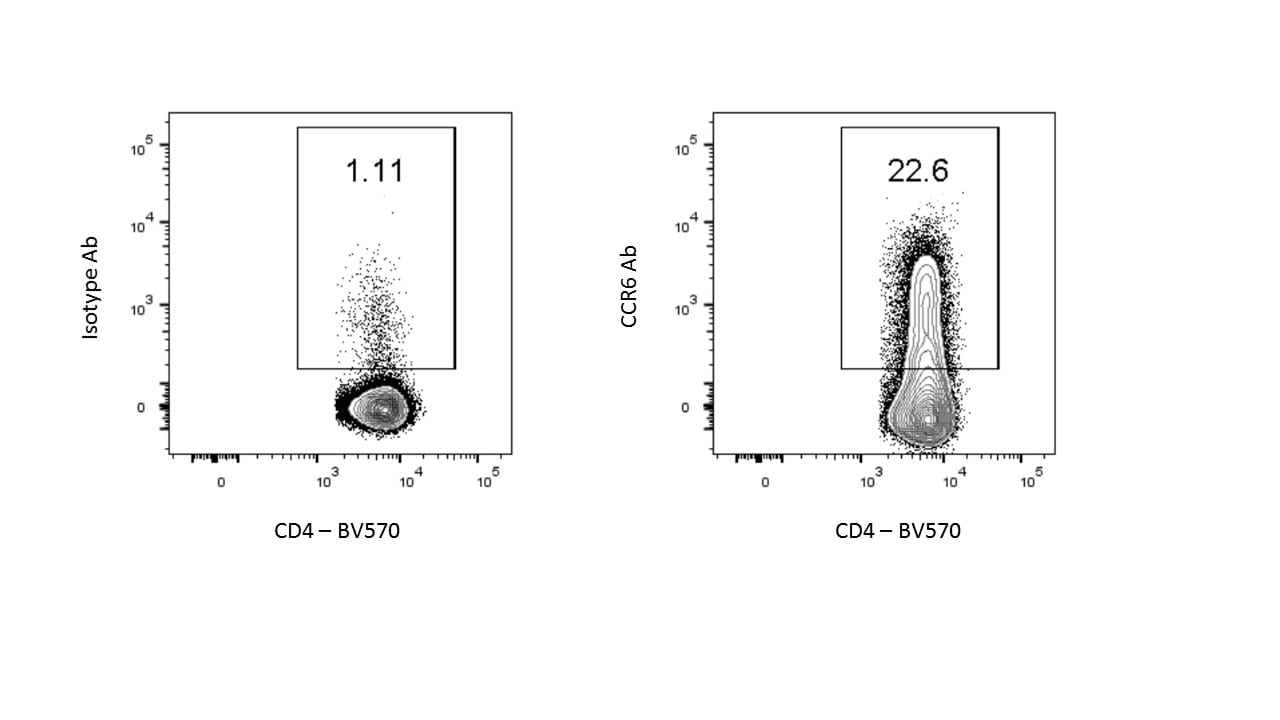
Detection of CCR6 by Flow Cytometry
Endogenous T cells accumulate in K14E7 skin with an enrichment for CCR6-expressing CD4 T cells.(A) Ear skin tissue was taken from K14E7 mice in addition to control mice expressing the SIY epitope under the K14 promoter. CD4 and CD8 expression was measured on gated CD45+CD3+ cells. Data is representative of at least 4 mice/group (B) The numbers of CD4+ and CD8+ T cells in K14E7 skin or control C57 skin were enumerated per square centimetre of ear skin using flow count beads in flow cytometry. Data represents pooled mice from at least two independent experiments. (C) Gated CD3+ CD4+ T cells from the lymph node or skin of K14E7 mice were analysed for expression of the chemokine receptors, CCR6 and CCR4. The left hand panels show representative plots of isotype and CCR6 antibody staining for CD4+ T cells while the graph summarises chemokine receptor staining representative of 6 mice/group from 3 independent experiments. (D) Both K14E7 mice and C57 mice were analysed for the proliferative marker, Ki67, using intracellular staining of lymphocytes derived from the skin and inguinal lymph nodes (iLN). Naive C57 spleen cells (negative control) or C57 spleen cells treated for 3 days with PMA/Ionomycin (positive control) were also analysed. The K14E7 and C57 data represent 7 mice/group derived from 3 independent experiments while controls are spleen cells from a single mouse in 3 independent experiments. The lower right hand panels are representative plots showing isotype and Ki67 staining in K14E7 or C57 mouse skin. Image collected and cropped by CiteAb from the following open publication (https://pubmed.ncbi.nlm.nih.gov/23469070), licensed under a CC0-1.0 license. Not internally tested by R&D Systems.
Detection of CCR6 by Flow Cytometry
CCR6 expression is highest in TFR cells amongst follicular T cell populations. (A, B) Representative gating strategy for CCR6+ TFH cells (CD4+B220-CXCR5hiPD-1hiFoxp3-), TFR cells (CD4+B220-CXCR5hiPD-1hiFoxp3+), naïve CD4 T cells (CD4+B220-CD44loFoxp3-) and natural T-regulatory cells (nTreg: CD4+B220-CD44midFoxp3+Nrp-1+) 6 days after SRBC immunization. (C) Geometrical mean fluorescence intensity (gMFI) of CCR6 and, (D) percentage of CCR6+ cells within populations from (A) and (B). (E) Representative gating strategy for TFH (Foxp3-) and TFR cells (Foxp3+) within CCR6+ follicular T cells (CD4+B220-CXCR5hiPD-1hiCCR6+). (F) Ratio of TFH : TFR cells within gating strategies from (A, E). (G) Frequency of CCR6+ TFH and TFR cells at indicated time points after i.p. NP-KLH/Alum immunization. (A–C, E, F) Data representative of two independent experiments, n=4 mice ± SEM, one-way ANOVA with Tukey’s multiple comparisons test, (G) n=4-5 mice per time-point ± SEM, two-way ANOVA with Sidak’s multiple comparison test. NS, Not significant, *p < 0.05, ***p < 0.001, ****p < 0.0001. Image collected and cropped by CiteAb from the following open publication (https://pubmed.ncbi.nlm.nih.gov/35812408), licensed under a CC-BY license. Not internally tested by R&D Systems.
Detection of CCR6 by Flow Cytometry
CCR6 expression is highest in TFR cells amongst follicular T cell populations. (A, B) Representative gating strategy for CCR6+ TFH cells (CD4+B220-CXCR5hiPD-1hiFoxp3-), TFR cells (CD4+B220-CXCR5hiPD-1hiFoxp3+), naïve CD4 T cells (CD4+B220-CD44loFoxp3-) and natural T-regulatory cells (nTreg: CD4+B220-CD44midFoxp3+Nrp-1+) 6 days after SRBC immunization. (C) Geometrical mean fluorescence intensity (gMFI) of CCR6 and, (D) percentage of CCR6+ cells within populations from (A) and (B). (E) Representative gating strategy for TFH (Foxp3-) and TFR cells (Foxp3+) within CCR6+ follicular T cells (CD4+B220-CXCR5hiPD-1hiCCR6+). (F) Ratio of TFH : TFR cells within gating strategies from (A, E). (G) Frequency of CCR6+ TFH and TFR cells at indicated time points after i.p. NP-KLH/Alum immunization. (A–C, E, F) Data representative of two independent experiments, n=4 mice ± SEM, one-way ANOVA with Tukey’s multiple comparisons test, (G) n=4-5 mice per time-point ± SEM, two-way ANOVA with Sidak’s multiple comparison test. NS, Not significant, *p < 0.05, ***p < 0.001, ****p < 0.0001. Image collected and cropped by CiteAb from the following open publication (https://pubmed.ncbi.nlm.nih.gov/35812408), licensed under a CC-BY license. Not internally tested by R&D Systems.Applications for Mouse CCR6 Antibody (140706)
Application
Recommended Usage
CyTOF-ready
Ready to be labeled using established conjugation methods. No BSA or other carrier proteins that could interfere with conjugation.
Flow Cytometry
0.25 µg/106 cells
Sample: Mouse splenocytes
Sample: Mouse splenocytes
Immunohistochemistry
8-25 µg/mL
Sample: Perfusion fixed frozen sections of mouse thymus, and immersion fixed frozen sections of mouse spleen
Sample: Perfusion fixed frozen sections of mouse thymus, and immersion fixed frozen sections of mouse spleen
Reviewed Applications
Read 1 review rated 5 using MAB590 in the following applications:
Flow Cytometry Panel Builder
Bio-Techne Knows Flow Cytometry
Save time and reduce costly mistakes by quickly finding compatible reagents using the Panel Builder Tool.
Advanced Features
- Spectra Viewer - Custom analysis of spectra from multiple fluorochromes
- Spillover Popups - Visualize the spectra of individual fluorochromes
- Antigen Density Selector - Match fluorochrome brightness with antigen density

Formulation, Preparation, and Storage
Purification
Protein A or G purified from hybridoma culture supernatant
Reconstitution
Reconstitute at 0.5 mg/mL in sterile PBS. For liquid material, refer to CoA for concentration.
Loading...
Formulation
Lyophilized from a 0.2 μm filtered solution in PBS with Trehalose. *Small pack size (SP) is supplied either lyophilized or as a 0.2 µm filtered solution in PBS.
Shipping
Lyophilized product is shipped at ambient temperature. Liquid small pack size (-SP) is shipped with polar packs. Upon receipt, store immediately at the temperature recommended below.
Stability & Storage
Use a manual defrost freezer and avoid repeated freeze-thaw cycles.
- 12 months from date of receipt, -20 to -70 °C as supplied.
- 1 month, 2 to 8 °C under sterile conditions after reconstitution.
- 6 months, -20 to -70 °C under sterile conditions after reconstitution.
Calculators
Background: CCR6
Alternate Names
CC-CKR-6, CCR6, CD196, CKR-L3, CKRL3, CMKBR6, DRY6, GPR-CY4, GPR29, GPRCY4, STRL22
Gene Symbol
CCR6
UniProt
Additional CCR6 Products
Product Documents for Mouse CCR6 Antibody (140706)
Certificate of Analysis
To download a Certificate of Analysis, please enter a lot or batch number in the search box below.
Note: Certificate of Analysis not available for kit components.
Product Specific Notices for Mouse CCR6 Antibody (140706)
For research use only
Citations for Mouse CCR6 Antibody (140706)
 Powered by Bioz
Customer Reviews for Mouse CCR6 Antibody (140706) (1)
5 out of 5
1 Customer Rating
Have you used Mouse CCR6 Antibody (140706)?
Submit a review and receive an Amazon gift card!
$25/€18/£15/$25CAN/¥2500 Yen for a review with an image
$10/€7/£6/$10CAN/¥1110 Yen for a review without an image
Submit a review
Customer Images
Showing
1
-
1 of
1 review
Showing All
Filter By:
-
Application: Flow CytometrySample Tested: T cellsSpecies: MouseVerified Customer | Posted 08/04/2016murine splenic CD4 T cells were stained.

There are no reviews that match your criteria.
Protocols
Find general support by application which include: protocols, troubleshooting, illustrated assays, videos and webinars.
- 7-Amino Actinomycin D (7-AAD) Cell Viability Flow Cytometry Protocol
- Antigen Retrieval Protocol (PIER)
- Antigen Retrieval for Frozen Sections Protocol
- Appropriate Fixation of IHC/ICC Samples
- Cellular Response to Hypoxia Protocols
- Chromogenic IHC Staining of Formalin-Fixed Paraffin-Embedded (FFPE) Tissue Protocol
- Chromogenic Immunohistochemistry Staining of Frozen Tissue
- ClariTSA™ Fluorophore Kits
- Detection & Visualization of Antibody Binding
- Extracellular Membrane Flow Cytometry Protocol
- Flow Cytometry Protocol for Cell Surface Markers
- Flow Cytometry Protocol for Staining Membrane Associated Proteins
- Flow Cytometry Staining Protocols
- Flow Cytometry Troubleshooting Guide
- Fluorescent IHC Staining of Frozen Tissue Protocol
- Graphic Protocol for Heat-induced Epitope Retrieval
- Graphic Protocol for the Preparation and Fluorescent IHC Staining of Frozen Tissue Sections
- Graphic Protocol for the Preparation and Fluorescent IHC Staining of Paraffin-embedded Tissue Sections
- Graphic Protocol for the Preparation of Gelatin-coated Slides for Histological Tissue Sections
- IHC Sample Preparation (Frozen sections vs Paraffin)
- Immunofluorescent IHC Staining of Formalin-Fixed Paraffin-Embedded (FFPE) Tissue Protocol
- Immunohistochemistry (IHC) and Immunocytochemistry (ICC) Protocols
- Immunohistochemistry Frozen Troubleshooting
- Immunohistochemistry Paraffin Troubleshooting
- Intracellular Flow Cytometry Protocol Using Alcohol (Methanol)
- Intracellular Flow Cytometry Protocol Using Detergents
- Intracellular Nuclear Staining Flow Cytometry Protocol Using Detergents
- Intracellular Staining Flow Cytometry Protocol Using Alcohol Permeabilization
- Intracellular Staining Flow Cytometry Protocol Using Detergents to Permeabilize Cells
- Preparing Samples for IHC/ICC Experiments
- Preventing Non-Specific Staining (Non-Specific Binding)
- Primary Antibody Selection & Optimization
- Propidium Iodide Cell Viability Flow Cytometry Protocol
- Protocol for Heat-Induced Epitope Retrieval (HIER)
- Protocol for Liperfluo
- Protocol for Making a 4% Formaldehyde Solution in PBS
- Protocol for VisUCyte™ HRP Polymer Detection Reagent
- Protocol for the Characterization of Human Th22 Cells
- Protocol for the Characterization of Human Th9 Cells
- Protocol for the Preparation & Fixation of Cells on Coverslips
- Protocol for the Preparation and Chromogenic IHC Staining of Frozen Tissue Sections
- Protocol for the Preparation and Chromogenic IHC Staining of Frozen Tissue Sections - Graphic
- Protocol for the Preparation and Chromogenic IHC Staining of Paraffin-embedded Tissue Sections
- Protocol for the Preparation and Chromogenic IHC Staining of Paraffin-embedded Tissue Sections - Graphic
- Protocol for the Preparation and Fluorescent IHC Staining of Frozen Tissue Sections
- Protocol for the Preparation and Fluorescent IHC Staining of Paraffin-embedded Tissue Sections
- Protocol for the Preparation of Gelatin-coated Slides for Histological Tissue Sections
- Protocol: Annexin V and PI Staining by Flow Cytometry
- Protocol: Annexin V and PI Staining for Apoptosis by Flow Cytometry
- TUNEL and Active Caspase-3 Detection by IHC/ICC Protocol
- The Importance of IHC/ICC Controls
- Troubleshooting Guide: Fluorokine Flow Cytometry Kits
- Troubleshooting Guide: Immunohistochemistry
- View all Protocols, Troubleshooting, Illustrated assays and Webinars
Loading...
Associated Pathways

