Osteopontin (OPN, previously also referred to as transformation-associated secreted phosphoprotein, bone sialoprotein I, 2ar, 2B7, early T lymphocyte activation 1 protein, minopotin, calcium oxalate crystal growth inhibitor protein), is a secreted, highly acidic, calcium-binding, RGD-containing, phosphorylated glycoprotein originally isolated from bone matrix. Subsequently, OPN has been found in kidney, placenta, blood vessels and various tumor tissues. Many cell types (including macrophages, osteoclasts, activated T cells, fibroblasts, epithelial cells, vascular smooth muscle cells, and natural killer cells) can express OPN in response to activation by cytokines, growth factors or inflammatory mediators. Elevated expression of OPN has also been associated with numerous pathobiological conditions such as atherosclerotic plaques, renal tubulointerstitial fibrosis, granuloma formations in tuberculosis and silicosis, neointimal formation associated with balloon catheterization, metastasizing tumors, and cerebral ischemia. Mouse OPN cDNA encodes a 294 amino acid (aa) residue precursor protein with a 16 aa residue predicted signal peptide that is cleaved to yield a 278 aa residue mature protein with an integrin binding sequence (RGD), and N- and O-glycosylation sites. OPN has been shown to bind to different cell types through RGD-mediated interaction with the integrins alpha v beta 1, alpha v beta 3, alpha v beta 5, and non-RGD-mediated interaction with CD44 and the integrins alpha 8 beta 1 or alpha 9 beta 1. Functionally, OPN is chemotactic for macrophages, smooth muscle cells, endothelial cells and glial cells. OPN has also been shown to inhibit nitric oxide production and cytotoxicity by activated macrophages. Human, mouse, rat, pig and bovine OPN share from approximately 40-80% amino acid sequence identity. Osteopontin is a substrate for proteolytic cleavage by thrombin, enterokinase, MMP-3 and MMP-7. The functions of OPN in a variety of cell types were shown to be modified as a result of proteolytic cleavage (2, 3).
Mouse Osteopontin/OPN Antibody
R&D Systems | Catalog # AF808

Key Product Details
Validated by
Biological Validation
Species Reactivity
Validated:
Mouse
Cited:
Human, Mouse, Rat, Transgenic Mouse, Xenograft
Applications
Validated:
Immunohistochemistry, Western Blot, ELISA Capture (Matched Antibody Pair), Neutralization, Immunocytochemistry
Cited:
Immunohistochemistry, Immunohistochemistry-Paraffin, Immunohistochemistry-Frozen, Western Blot, Neutralization, Flow Cytometry, Immunofluorescence, Immunocytochemistry, Immunocytochemistry/ Immunofluorescence, Bioassay, Cell Culture, ELISA Capture, ELISA Development, ELISA Development (Capture), In vivo assay, RNAscope compatible
Label
Unconjugated
Antibody Source
Polyclonal Goat IgG
Loading...
Product Specifications
Immunogen
Mouse myeloma cell line NS0-derived recombinant mouse Osteopontin/OPN (R&D Systems, Catalog # 441-OP)
Leu17-Asn294 (Glu99Gly)
Accession # Q547B5
Leu17-Asn294 (Glu99Gly)
Accession # Q547B5
Specificity
Detects mouse Osteopontin (OPN) in ELISAs and Western blots.
Clonality
Polyclonal
Host
Goat
Isotype
IgG
Endotoxin Level
<0.30 EU per 1 μg of the antibody by the LAL method.
Scientific Data Images for Mouse Osteopontin/OPN Antibody
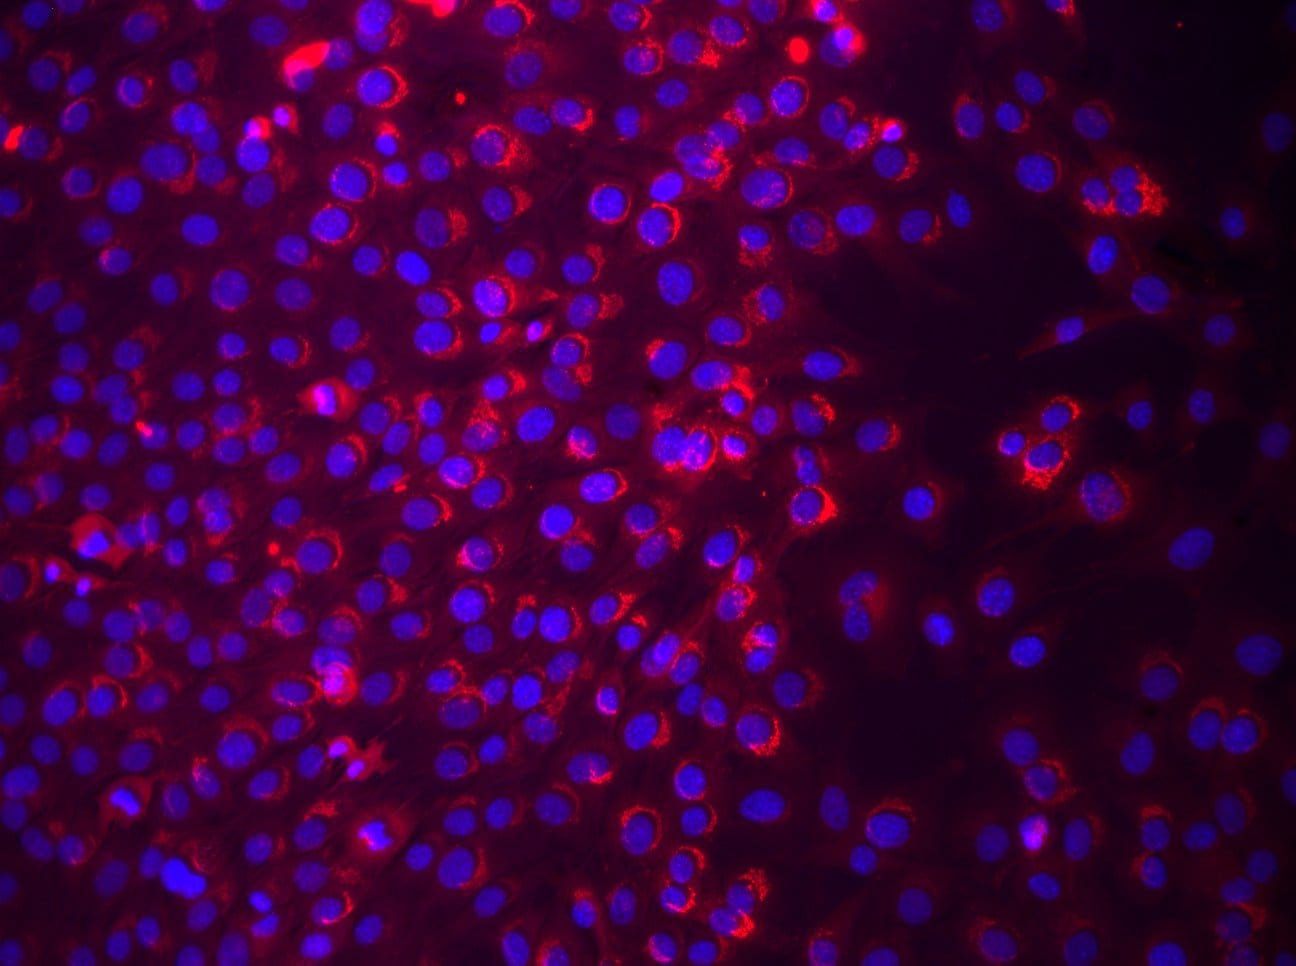
Osteopontin/OPN in C2C12 Mouse Cell Line and Mouse Splenocytes.
Osteopontin/OPN was detected in immersion fixed C2C12 mouse myoblast cell line (left panel, positive stain) and mouse splenocytes (right panel, negative stain) using Goat Anti-Mouse Osteopontin/OPN Antigen Affinity-purified Polyclonal Antibody (Catalog # AF808) at 5 µg/mL for 3 hours at room temperature. Cells were stained using the NorthernLights™ 557-conjugated Anti-Goat IgG Secondary Antibody (red; NL001) and counterstained with DAPI (blue). Specific staining was localized to cytoplasm and secreted molecule. View our protocol for Fluorescent ICC Staining of Cells on Coverslips.
Osteopontin/OPN in Mouse Thymus.
Osteopontin/OPN was detected in perfusion fixed frozen sections of mouse thymus using Mouse Osteopontin/OPN Antigen Affinity-purified Polyclonal Antibody (Catalog # AF808) at 15 µg/mL overnight at 4 °C. Tissue was stained using the Anti-Goat HRP-DAB Cell & Tissue Staining Kit (brown; CTS008) and counterstained with hematoxylin (blue). View our protocol for Chromogenic IHC Staining of Frozen Tissue Sections.
Cell Adhesion Mediated by Osteopontin/OPN and Neutralization by Mouse Osteopontin/OPN Antibody.
Recombinant Mouse Osteopontin/OPN (441-OP), immobilized onto a microplate, supports the adhesion of the HEK293 human embryonic kidney cell line in a dose-dependent manner (orange line). Adhesion elicited by Recombinant Mouse Osteopontin/OPN (2 µg/mL) is neutralized (green line) by increasing concentrations of Mouse Osteopontin/OPN Antigen Affinity-purified Polyclonal Antibody (Catalog # AF808). The ND50 is typically 1-3 µg/mL.
Detection of Mouse Osteopontin/OPN by Immunocytochemistry/Immunofluorescence
Notch ligands Jag1 and Dll1 are both required for segregation of hepatocytic fate centrally and biliary fate peripherally.(A) Immunolabeling for OPN and HNF4A of BMEL cells presented with DLL4 on 30 kPa substrates. Control cells were transduced with an shRNA vector coding for a non-mammalian target. shJag1 and shDll1 cells were transduced with shRNA vectors targeting Jag1 and Dll1, respectively. Scale bar is 150 µm. (B) Confocal imaging of immunolabeled SOX9 and HNF4A in control, shJag1, and shDll1 cells presented with DLL4 on 30 kPa substrates. Scale bar is 75 µm. (C) Quantification of OPN+ cell counts of control, shJag1, and shDll1 cells presented with DLL4 on 30 kPa substrates. (D) Quantification of SOX9 and HNF4A intensity of control, shJag1, and shDll1 cells presented with DLL4 on 30 kPa substrates. (C, D) Mean ± 95% CI.10.7554/eLife.38536.024Figure 7—source data 1.Summary table for OPN data in Figure 7C.10.7554/eLife.38536.025Figure 7—source data 2.Summary table for SOX9 and HNF4A data in Figure 7D.Summary table for OPN data in Figure 7C.Summary table for SOX9 and HNF4A data in Figure 7D.Regression analysis of OPN+ cell counts.Data in Figure 7B were separated into peripheral and central subsets for which dimensionless radius was greater than 0.75 (R>0.75) and less than 0.75 (R<0.75). Separate multiple regression models were generated for each data subset for which coefficient estimates (corresponding to mean change in cell counts) and 95% CI were plotted. For each factor, 95% CI that do not intersect with the dashed line indicate regression coefficient estimates for which P<0.05. Control, shJag1, and shDll1 cells were presented with DLL4 on 30 kPa substrates. Image collected and cropped by CiteAb from the following publication (https://pubmed.ncbi.nlm.nih.gov/30589410), licensed under a CC-BY license. Not internally tested by R&D Systems.
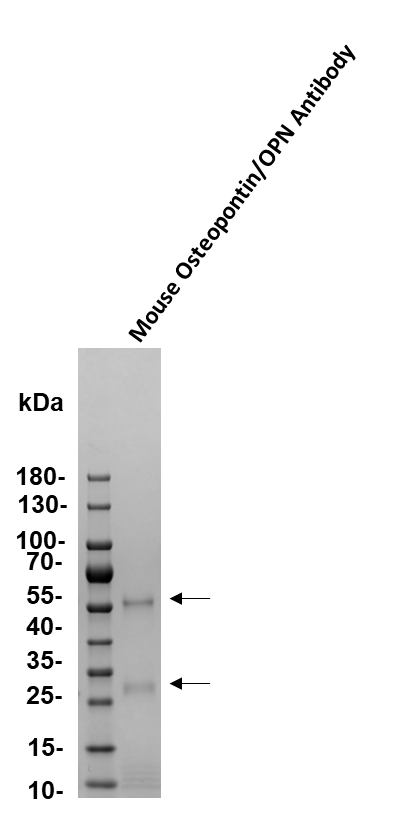
Detection of Mouse Osteopontin/OPN by Western Blot
Altered expression of ECM proteins in Cyp1b1-/- LSEC.Western blot analysis of ECM proteins in the conditioned medium (CM) and cell lysates from LSEC was performed. (A) The levels of SPARC, Tenascin-C, TSP2, and Osteopontin were below the level of detection. Cyp1b1 LSEC produced TSP1, periostin, and fibronectin. (B) The quantitative assessment of the data. TSP1 level was significantly decreased in lysates from Cyp1b1-/- LSEC (***P< 0.001; n = 3), while periostin level was increased in lysates from Cyp1b1-/- LSEC. The level of fibronectin secreted into the conditioned medium was decreased in Cyp1b1-/- LSEC. These experiments were repeated with two isolation of LSEC with similar results. Image collected and cropped by CiteAb from the following publication (https://pubmed.ncbi.nlm.nih.gov/30372497), licensed under a CC-BY license. Not internally tested by R&D Systems.
Detection of Mouse Osteopontin/OPN by Immunocytochemistry/Immunofluorescence
Peripheral biliary differentiation is dependent on both Notch signaling and substrate stiffness.(A) Immunolabeling for OPN of BMEL cells presented with DLL4 on 30 kPa and 4 kPa substrates. Cells were treated with vehicle control (DMSO) or an inhibitor of Notch signaling ( gamma -secretase inhibitor X, GSI, 5 µM). (B) Quantification of OPN+ cell counts on 30 kPa and 4 kPa substrates after treatment with DMSO or GSI. (C) Immunolabeling for SOX9 and HNF4A of BMEL cells on 30 kPa and 4 kPa substrates. (D) Quantification of SOX9 and HNF4A intensity on 30 kPa and 4 kPa substrates. (E) RNA in situ hybridization for Jag1, Dll1, and Notch2 on 30 kPa and 4 kPa substrates. Cells were exogenously presented with IgG or DLL4. (A, C, E) Scale bars indicate 150 µm. (B, D) Mean ± 95% CI.10.7554/eLife.38536.013Figure 2—source data 1.Summary table for OPN data in Figure 2B and Figure 2—figure supplement 1.10.7554/eLife.38536.014Figure 2—source data 2.Summary table for SOX9 and HNF4A data in Figure 2D.Summary table for OPN data in Figure 2B and Figure 2—figure supplement 1.Summary table for SOX9 and HNF4A data in Figure 2D.Quantification of OPN+ cell counts in arrayed patterns.Cells were cultured on 30 kPa and 4 kPa substrates and presented with IgG, DLL1, DLL4, and JAG1. Treatments included vehicle control (DMSO) or an inhibitor of Notch signaling ( gamma -secretase inhibitor X, GSI, 5 µM).Regression analysis of OPN+ and ALB+ cell counts.Data in Figure 2B were separated into peripheral and central subsets for which dimensionless radius was greater than 0.75 (R>0.75) and less than 0.75 (R<0.75). Separate multiple regression models were generated for each data subset for which coefficient estimates (corresponding to mean change in cell counts) and 95% CI were plotted for OPN+ (A) and ALB+ (B) cells. For each factor, 95% CI that do not intersect with the dashed line indicate regression coefficient estimates for which P<0.05. Cells were cultured on 30 kPa and 4 kPa substrates and presented with IgG,
Detection of Mouse Osteopontin/OPN by Immunocytochemistry/Immunofluorescence
Characterisation of mouse liver progenitor cell lines.(A) Mouse liver progenitor cell (LPC) lines (BMOL1.2, BMOL-TAT) were stained using immunofluorescence to determine expression of LPC marker Osteopontin (OPN) (red). IgG isotype control images obtained using identical imaging conditions. DAPI, blue. (B) LPCs (BMOL1.2) were shown to express full-length primary cilium (Pc) structures by immunofluorescence detection of axoneme ( alpha -acetylated tubulin, green) and basal body ( gamma -tubulin, red) markers. This was also confirmed by scanning electron microscopy (SEM). BMOL-TAT cells were also confirmed to express Pc via immunofluorescence and EM studies (data not shown). (C) Nuclear GLI2 (red) expression in LPC lines (BMOL1.2, BMOL-TAT) via immunofluorescence staining. DAPI, blue. Confocal microscopy, 63x objective. Image collected and cropped by CiteAb from the following publication (https://dx.plos.org/10.1371/journal.pone.0171480), licensed under a CC-BY license. Not internally tested by R&D Systems.
Detection of Mouse Osteopontin/OPN by Western Blot
Osteopontin (OPN) drives enhancement in macrophage (Mφ) M2 polarization and angiogenic capacity. (A) Representative images of protein expression profiles obtained by comprehensive protein array in each Mφ subset. Red arrowheads indicate OPN. (B) The mRNA expression level of Spp1 relative to glyceraldehyde-3-phosphate dehydrogenase (Gapdh) was analyzed by real-time reverse transcription polymerase chain reaction in each Mφ subset and was normalized to Mφ (–), n = 6 [***p < 0.001 vs. untreated, #p < 0.05 vs. interleukin (IL)-10 alone]. (C) The protein expression level of OPN relative to GAPDH was measured by western blotting and was normalized to Mφ (–), n = 10. Lower panels are typical images of each protein (***p < 0.001 vs. untreated, #p < 0.05 vs. IL-10 alone). (D) Representative confocal laser scanning immunofluorescence overlay images of OPN (red) and DAPI (blue) in each Mφ subset. Scale bar represents 20 µm. Images in the right row are magnified regions from white or yellow rectangles in the panels of corresponding groups. Scale bar represents 10 µm. (E) Relative mean fluorescence intensity (MFI) of CD163 was measured by FACS analysis in each Mφ subset. An anti-OPN antibody (Ab) and its isotype-matched control Ab were used at 3 µg/mL, n = 4 (***p < 0.001 vs. untreated, ##p < 0.01, #p < 0.05 vs. IL-10 alone, †††p < 0.001 vs. IL-10 + IL-18). (F) The total areas and lengths of tube-like structures were determined by the Matrigel tube formation assay where b.End5 was cocultured with each Mφ subset, n = 12 (***p < 0.001, **p < 0.01, *p < 0.05 vs. untreated, #p < 0.05 vs. IL-10 alone, †††p < 0.001 vs. IL-10 + IL-18). All data are expressed as means ± SEM and were analyzed by a one-way ANOVA followed by Tukey’s test. Image collected and cropped by CiteAb from the following publication (https://pubmed.ncbi.nlm.nih.gov/29559970), licensed under a CC-BY license. Not internally tested by R&D Systems.
Detection of Mouse Osteopontin/OPN by Immunocytochemistry/Immunofluorescence
Thrombin contributes to macrophage (Mφ) M2 polarization and angiogenic capacity through proteolytic modification for osteopontin (OPN). (A) The mRNA expression level of Prothrombin relative to glyceraldehyde-3-phosphate dehydrogenase (Gapdh) was analyzed by reverse transcription polymerase chain reaction in each Mφ subset and were normalized to Mφ (–), n = 7 [***p < 0.001, **p < 0.01 vs. untreated, ##p < 0.01 vs. interleukin (IL)-10 alone]. (B,C) The protein expression levels of (B) thrombin or (C) OPN N-Half relative to GAPDH were measured by western blotting in each Mφ subset and were normalized to Mφ (–). Lower panels are typical images of each protein. (B)n = 8 (***p < 0.001, *p < 0.05 vs. untreated, #p < 0.05 vs. IL-10 alone). (C)n = 16 (***p < 0.001, *p < 0.05 vs. untreated, ##p < 0.01, #p < 0.05 vs. IL-10 alone, †††p < 0.001 vs. IL-10 + IL-18). (D) Representative confocal laser scanning immunofluorescence images of OPN (red), thrombin (green), and their merge with DAPI (blue) in each Mφ subset. Scale bar represents 20 µm. Higher magnification images are from the white rectangle region in merged panel of Mφ (IL-10 + IL-18). Scale bar represents 10 µm. (E) Relative mean fluorescence intensity (MFI) of CD163 was measured by FACS analysis in each Mφ subset. Hirudin, a specific thrombin inhibitor, was used at 1 µg/mL, n = 3 (***p < 0.001 vs. untreated, ###p < 0.001 vs. IL-10 alone, †††p < 0.001 vs. IL-10 + IL-18). (F) The total areas and lengths of tube-like structures were determined by the Matrigel tube formation assay where b.End5 were cocultured with each Mφ subset. Hirudin was used at 1 µg/mL, n = 6 (***p < 0.001, **p < 0.01 vs. untreated, ##p < 0.01, #p < 0.05 vs. IL-10 alone, †††p < 0.001 vs. IL-10 + IL-18). All data are expressed as means ± SEM and were analyzed by a one-way ANOVA followed by Tukey’s test. Image collected and cropped by CiteAb from the following publication (https://pubmed.ncbi.nlm.nih.gov/29559970), licensed under a CC-BY license. Not int
Detection of Mouse Osteopontin/OPN by Immunocytochemistry/Immunofluorescence
Osteopontin (OPN) drives enhancement in macrophage (Mφ) M2 polarization and angiogenic capacity. (A) Representative images of protein expression profiles obtained by comprehensive protein array in each Mφ subset. Red arrowheads indicate OPN. (B) The mRNA expression level of Spp1 relative to glyceraldehyde-3-phosphate dehydrogenase (Gapdh) was analyzed by real-time reverse transcription polymerase chain reaction in each Mφ subset and was normalized to Mφ (–), n = 6 [***p < 0.001 vs. untreated, #p < 0.05 vs. interleukin (IL)-10 alone]. (C) The protein expression level of OPN relative to GAPDH was measured by western blotting and was normalized to Mφ (–), n = 10. Lower panels are typical images of each protein (***p < 0.001 vs. untreated, #p < 0.05 vs. IL-10 alone). (D) Representative confocal laser scanning immunofluorescence overlay images of OPN (red) and DAPI (blue) in each Mφ subset. Scale bar represents 20 µm. Images in the right row are magnified regions from white or yellow rectangles in the panels of corresponding groups. Scale bar represents 10 µm. (E) Relative mean fluorescence intensity (MFI) of CD163 was measured by FACS analysis in each Mφ subset. An anti-OPN antibody (Ab) and its isotype-matched control Ab were used at 3 µg/mL, n = 4 (***p < 0.001 vs. untreated, ##p < 0.01, #p < 0.05 vs. IL-10 alone, †††p < 0.001 vs. IL-10 + IL-18). (F) The total areas and lengths of tube-like structures were determined by the Matrigel tube formation assay where b.End5 was cocultured with each Mφ subset, n = 12 (***p < 0.001, **p < 0.01, *p < 0.05 vs. untreated, #p < 0.05 vs. IL-10 alone, †††p < 0.001 vs. IL-10 + IL-18). All data are expressed as means ± SEM and were analyzed by a one-way ANOVA followed by Tukey’s test. Image collected and cropped by CiteAb from the following publication (https://pubmed.ncbi.nlm.nih.gov/29559970), licensed under a CC-BY license. Not internally tested by R&D Systems.
Detection of Mouse Osteopontin/OPN by Immunocytochemistry/Immunofluorescence
Localized differentiation of liver progenitors in arrayed patterns.(A) Immunolabeling of BMEL cells for the biliary marker OPN and hepatocyte marker ALB on arrayed collagen I patterns with control IgG or Fc-recombinant Notch ligands DLL1, DLL4, and JAG1. (B) Quantification of OPN+ cell counts as a function of radial distance from the centroid of each island. (C) Quantification of ALB+ cell counts as a function of radial distance from the centroid of each island. (D) Immunolabeling of BMEL cells presented with DLL4 for the biliary transcription factor SOX9 and hepatocyte transcription factor HNF4A. Arrow in each image indicates the same SOX9+/HNF4A− cell. Scale bar indicates 75 µm. (E, F) Regression analysis of OPN+ and ALB+ cell counts. Data in Figure 1B and Figure 1C were separated into peripheral and central subsets for which dimensionless radius was greater than 0.75 (R>0.75) and less than 0.75 (R<0.75). Separate multiple regression models were generated for each data subset for which coefficient estimates (corresponding to mean change in cell counts) and 95% CI were plotted for OPN+ (E) and ALB+ (F) cells. For each factor, 95% CI that do not intersect with the dashed line indicate regression coefficient estimates for which P<0.05. (A, E) Scale bars indicate 150 µm.10.7554/eLife.38536.007Figure 1—source data 1.Summary table for OPN data in Figure 1B.10.7554/eLife.38536.008Figure 1—source data 2.Summary table for ALB data in Figure 1C.Summary table for OPN data in Figure 1B.Summary table for ALB data in Figure 1C.Immunolabeling and quantification of CK19.(A) Immunolabeling of BMEL cells presented with IgG for the biliary marker CK19. (B) Quantification of CK19 intensity in BMEL cells presented with IgG as a function of radial distance from the centroid of each island. Asterisk (*) indicates P<0.001 for peak intensity (R>0.9) compared with central intensity (R<0.1) using Welch’s t-test.Immunolabeling of OPN and CK19 at t=24h and cell density with radius at t=72h.(A
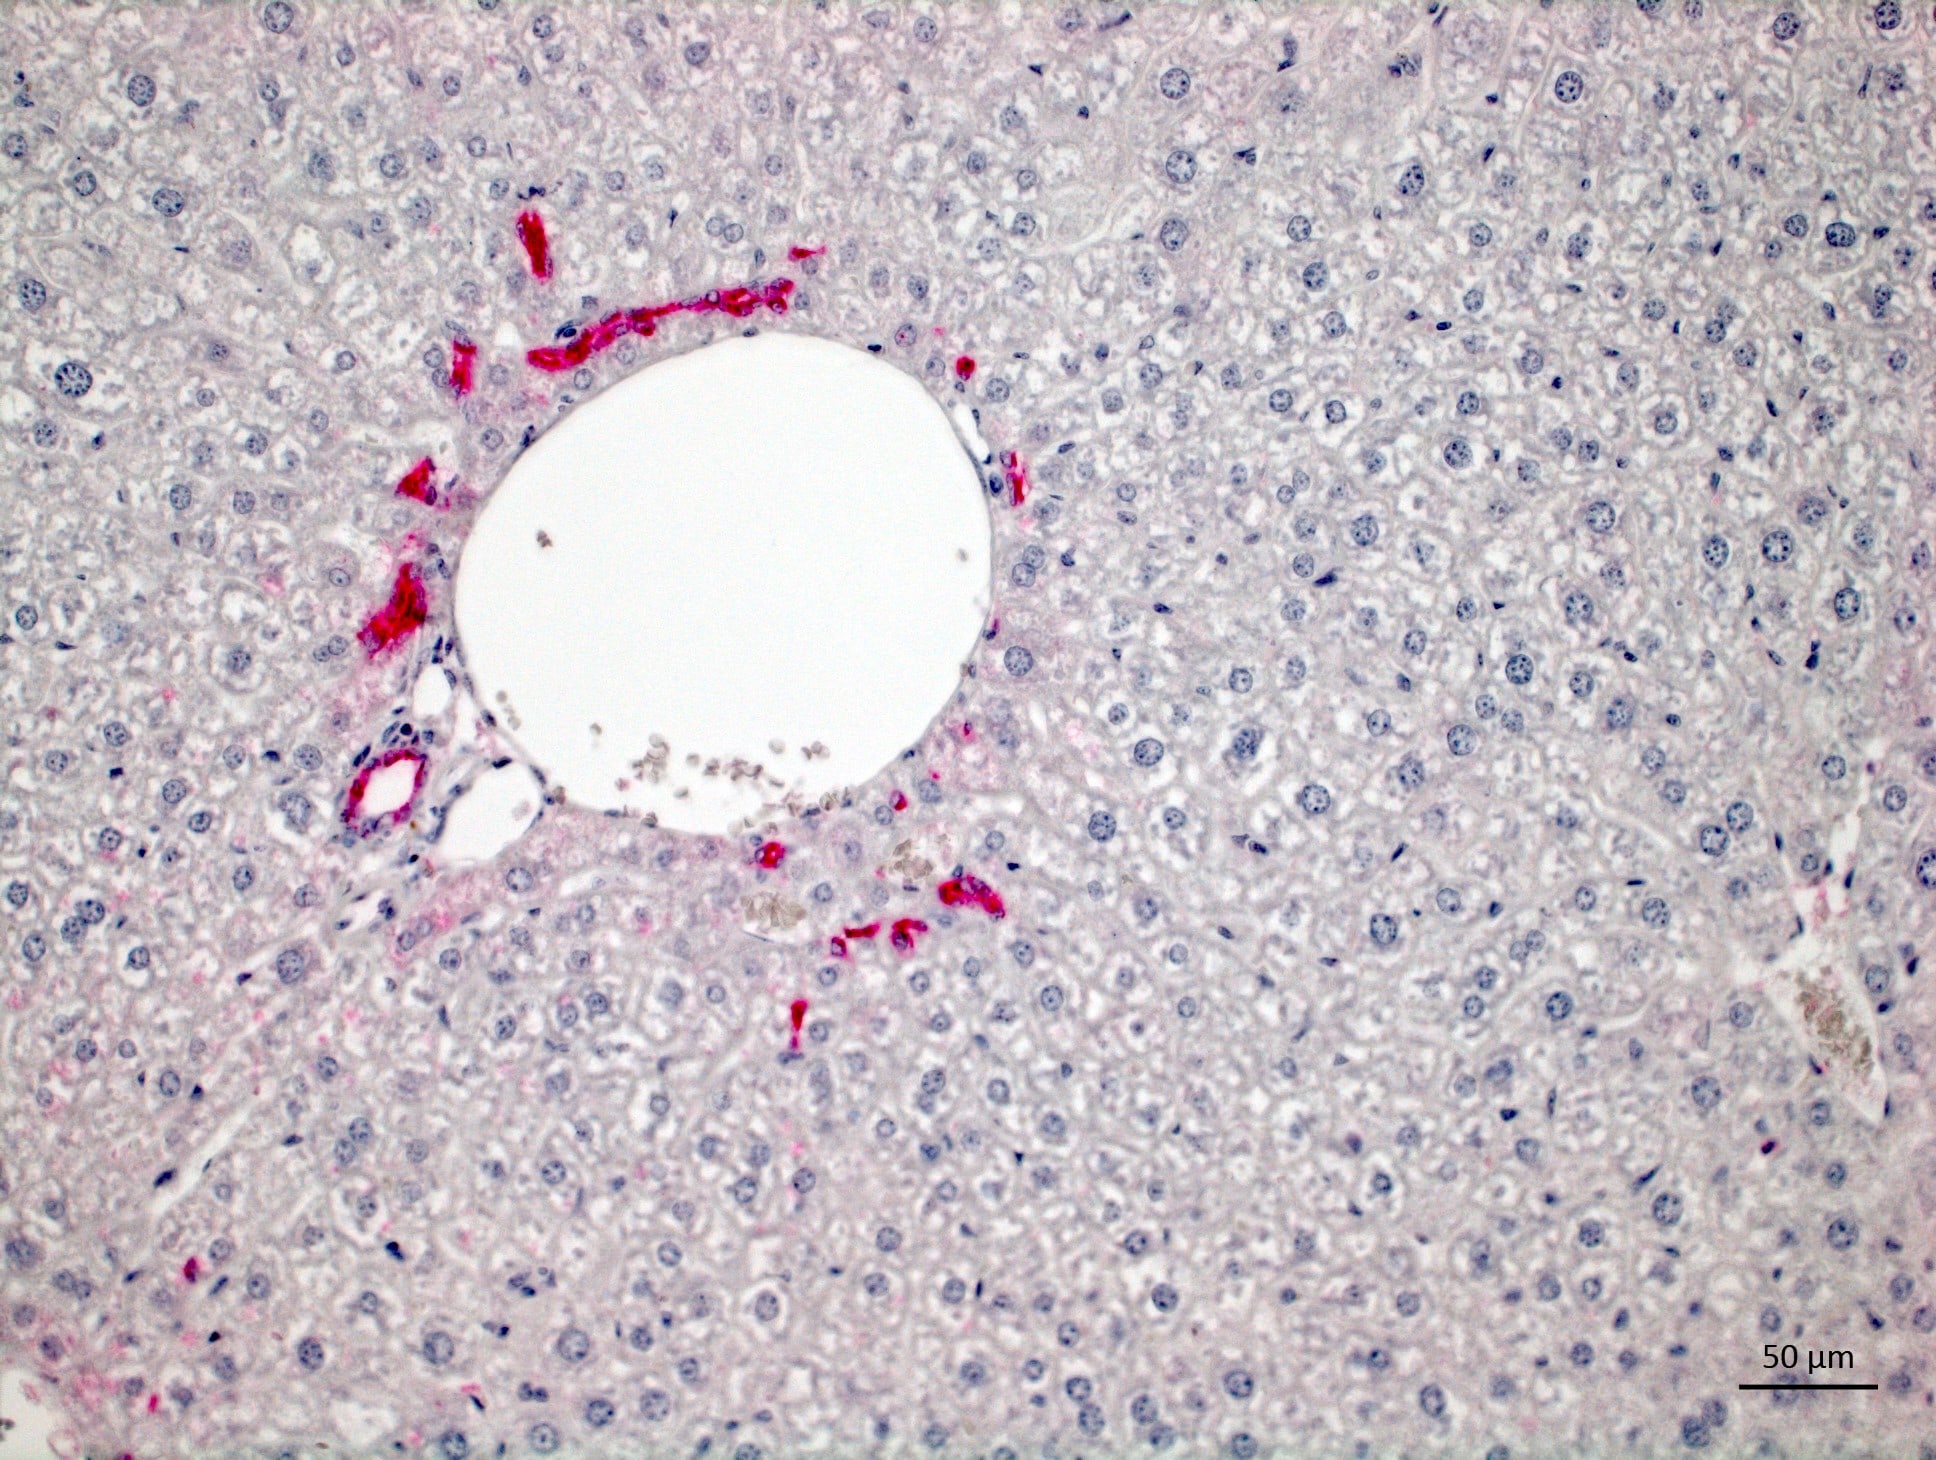
Detection of Osteopontin/OPN by Immunohistochemistry
Aging results in diminished OPN production in response to 2-20 RSV infection.Young and aged BALB/c mice (n = 4/group) were intranasally infected with a dose of 106 pfu/mouse of A2 or 105 pfu/mouse of 2-20) and total lung RNA was collected on time points indicated. (A-B) RNA transcripts of OPN were analyzed with qRT-PCR and represented as a relative ratio of target gene expression to endogenous mouse HPRT and examined with rA2-L19F, 2-20, or A2. (B) 5 µm lung sections obtained at 4, 5 and 8 dpi with either rA2-L19F, 2-20, or A2 infected young and aged mice. Lung sections were immunostained for anti-mouse OPN and nickel-DAB reagent before counterstaining with hematoxylin and eosin. Representative images shown are at 100x magnification with inset [400x] displaying nickel-DAB (dark brown/black staining) positive cells and contrast the hematoxylin (light blue) nuclear stain. Representative images are shown with scale bar indicating 100 µm. (C) Enumeration of OPN-positive cells was performed with ImmunoRatio ImageJ analysis on 200X magnified lung sections from 8 dpi and values are shown as a percentage of total hematoxylin-stained cells in an individual box plot with mean interval bars. Within a single frame, at least 5 frames per mouse (n = 4/group) were collected and individual dot plots are shown of either aged or young mice with interval bars and significance, determined with ANOVA and Fisher's test (p<0.05). (D) qRT-PCR was performed on total lung RNA from young and aged 2–20 RSV infected mice for mRNA expression of OPN receptor CD44. Statistical significance was determine with ANOVA 2-way analysis with p<0.05. All experiments were performed in triplicate. Image collected and cropped by CiteAb from the following open publication (https://pubmed.ncbi.nlm.nih.gov/24558422), licensed under a CC-BY license. Not internally tested by R&D Systems.
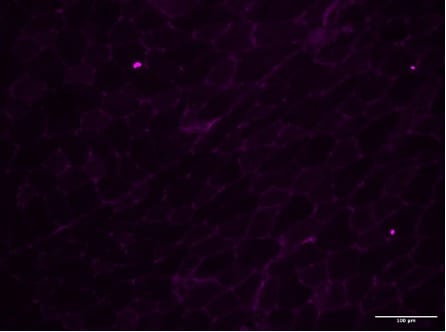
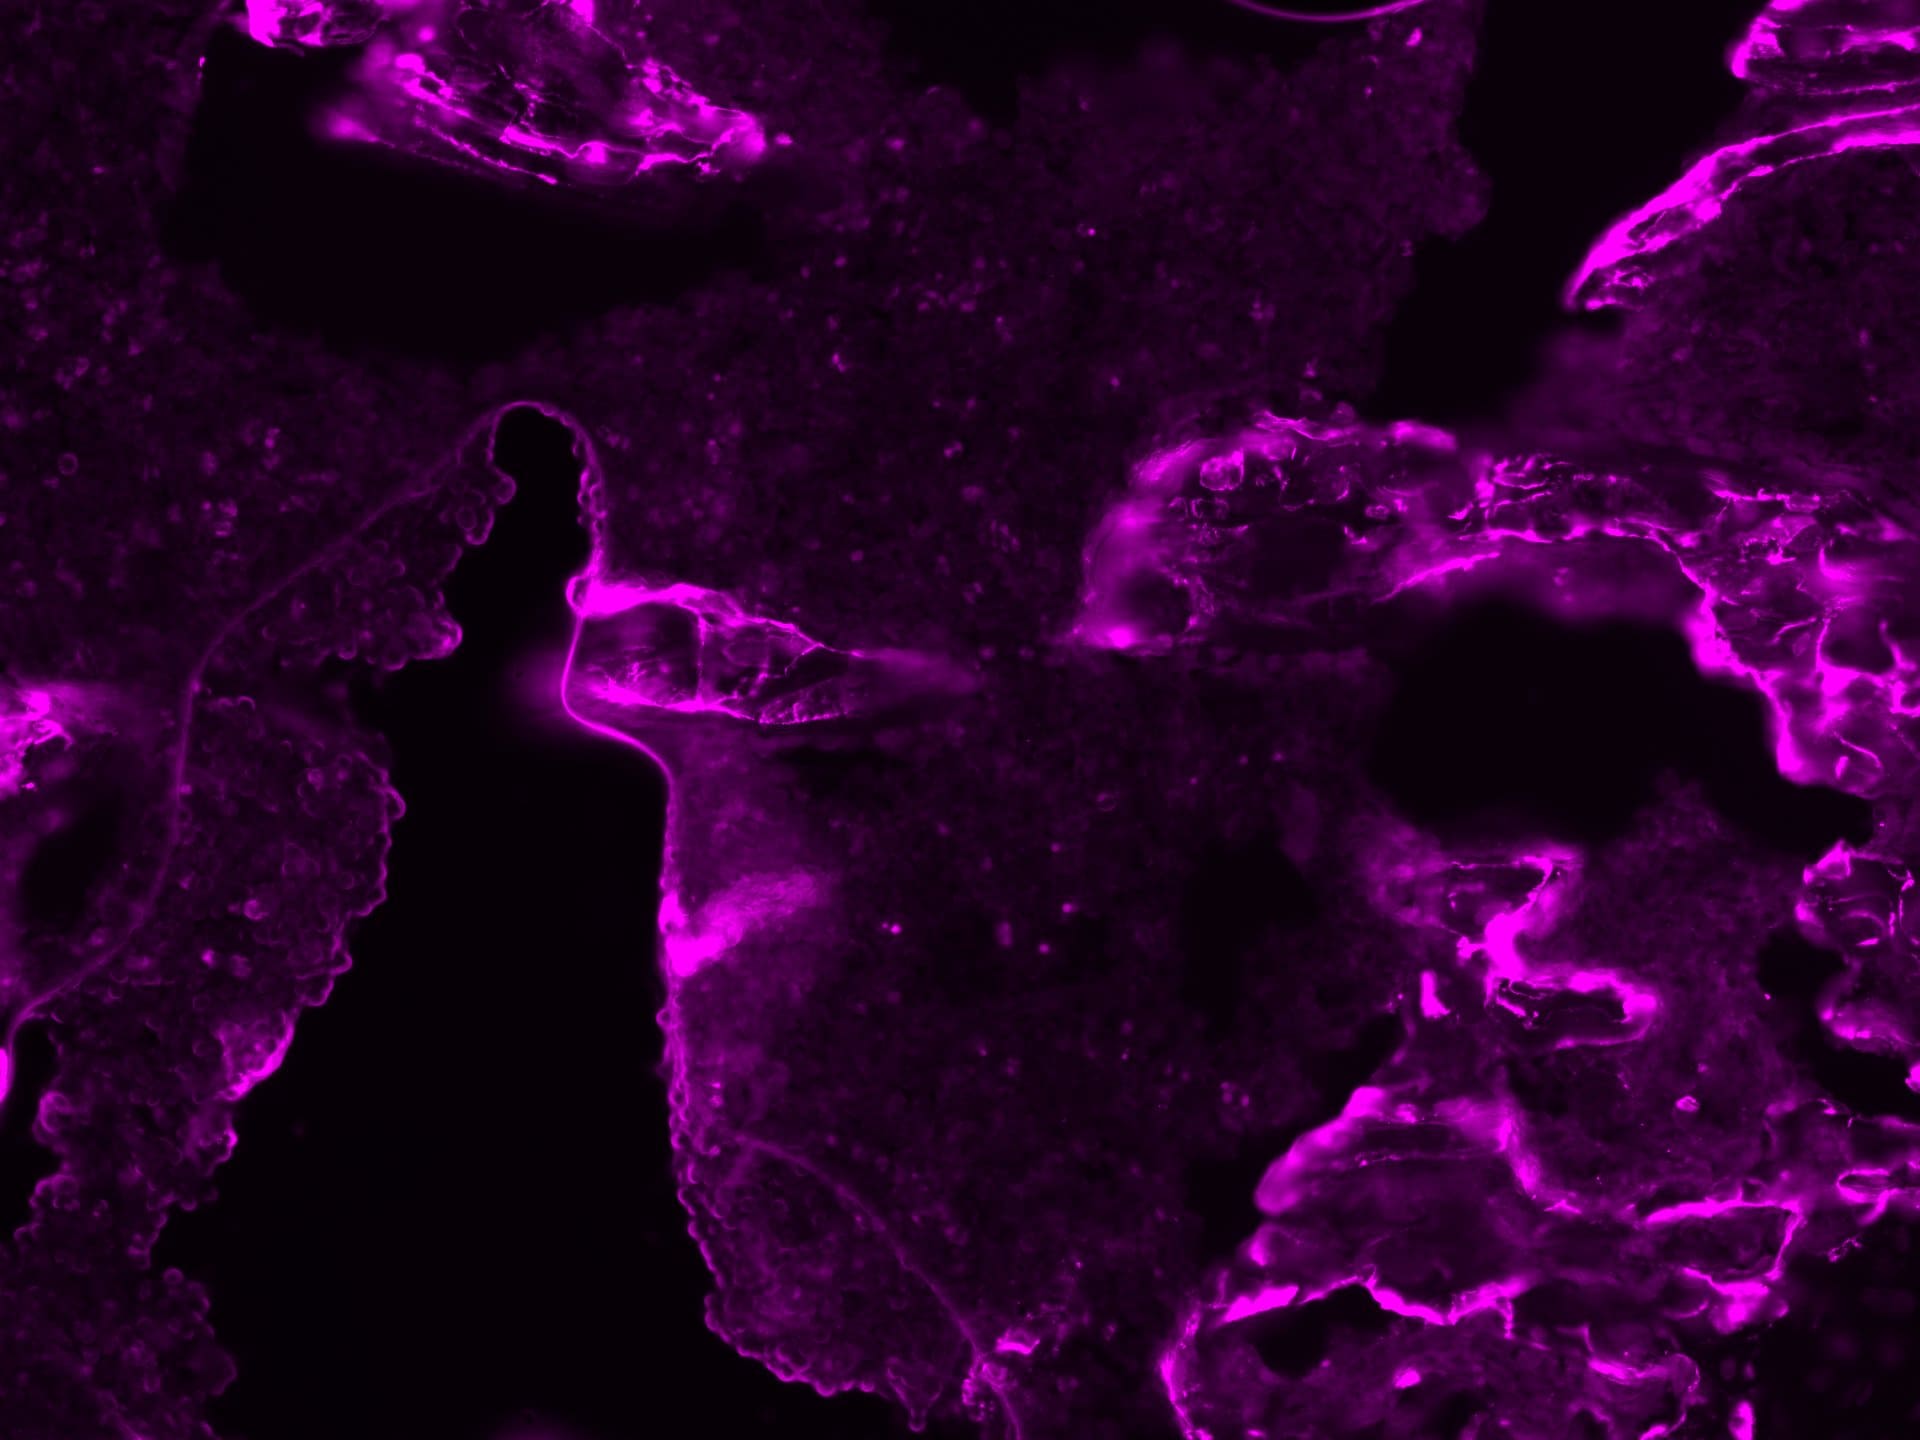
Osteopontin/OPN in Mouse Placenta.
Murine placenta cryosections stained with osteopontin (red). Tissue autofluorescence in blue. Image from a verified customer review.
Detection of Osteopontin/OPN by Immunohistochemistry
Lkb1 deletion in Ctsk-Cre–expressing cells leads to increased bone formation.(A) μCT analysis of femurs from 5-week-old female Ctsk-Ctrl and Ctsk-CKO mice. (B) Ct.Th and BV/TV of the cortical bones of femurs from 5-week-old female Ctsk-Ctrl and Ctsk-CKO mice (n = 5 for each group). (C) von Kossa staining of the tibiae from 5-week-old female Ctsk-Ctrl and Ctsk-CKO mice. Scale bar: 100 μm. (D and E) Calcein–alizarin red double-labeled fluorescence of the tibiae from 5-week-old female Ctsk-Ctrl and Ctsk-CKO mice showing MAR and BFR of the periosteum (n = 3 for each group). Scale bars: 100 μm (left); 10 μm (right). (F) Gene expression of markers for osteoblast progenitor (Runx2 and Osx), preosteoblast (Alp and Col1a1), and mature osteoblast (Opn, Bsp, and Ocn) of the cortical bones of 20-week-old female Ctsk-CKO mice (n = 3) compared with Ctsk-Ctrl mice (n = 4) tibiae. (G and H) Immunostaining of OSX (G) and OPN (H) in the tumor osteoid of Ctsk-CKO tibiae. Scale bars: 50 μm. Data are represented as mean ± SEM. *P < 0.05; **P < 0.01, unpaired Student’s t test. Image collected and cropped by CiteAb from the following open publication (https://pubmed.ncbi.nlm.nih.gov/30830877), licensed under a CC-BY license. Not internally tested by R&D Systems.
Detection of Mouse Osteopontin/OPN by Immunocytochemistry/ Immunofluorescence
OPN expression in the BMF of NOD+/+ mice in the presence of Leishmania amazonensis.(A) Immunofluorescence staining of BMFs. a & d: non-infected control at 24 h and 48 h, respectively. b & c: BMFs infected with LV79 at 24 h and e & f at 48 h post-infection. Green: OPN, red: LV79; blue: nuclei. (B) qRT‒PCR of OPN transcripts (*P = 0.0294). (C) OPN protein quantification in control non-infected (ctl) and infected +LV79 BMFs. NOD ctl 24 h vs NOD+lv79 24 h (*P = 0.0454); NOD ctl 48 h vs NOD+lv79 48 h (**P = 0.0091). Two-tailed Mann‒Whitney test. Image collected and cropped by CiteAb from the following open publication (https://dx.plos.org/10.1371/journal.pone.0308868), licensed under a CC-BY license. Not internally tested by R&D Systems.
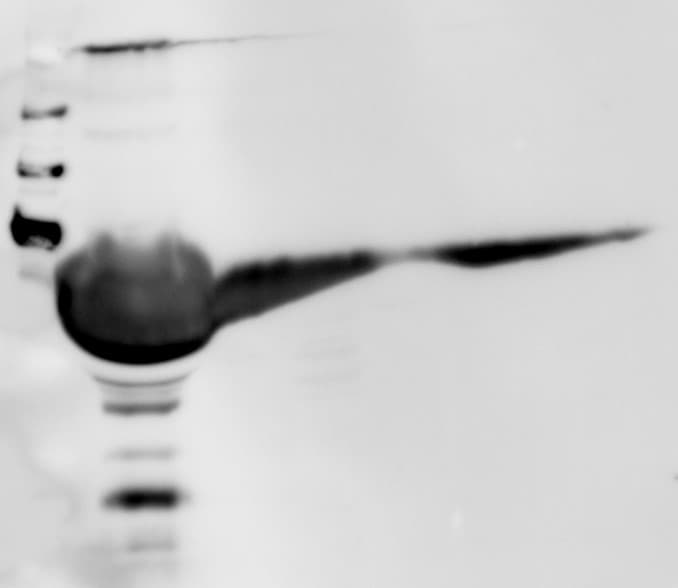
Detection of Osteopontin/OPN by Western Blot
Metformin treatment increases OPN expression in preosteoblasts, contributing to an increase in adhesion of myeloma cells. (A) 2T3, MC3T3 and ST2 were treated with 5 mM metformin for 48 h and osteopontin gene expression quantified (** p < 0.01 as compared to control, n = 3–7). (B) Osteopontin protein expression following metformin treatment for 48 h in 2T3 preosteoblasts and ST2 stromal cells. (C) OPN gene expression in 2T3 preosteoblasts after transfection with either scrambled (SCR) or OPN siRNA (** p < 0.01 as compared to scrambled transfection, n = 3). (D) OPN protein expression in 2T3 preosteoblasts following transfection with OPN siRNA or scrambled control SCR and treatment with metformin. CTR = untransfected. 2T3 preosteoblasts (scrambled control (SCR) or osteopontin siRNA (OPN)) were pretreated with metformin and adhesion imaged and quantified. (E) Representative image and quantification of specific image. (F) Quantification of myeloma cell adhesion (* p < 0.05 as compared to control, n = 4). Data are presented as mean ± SEM. Image collected and cropped by CiteAb from the following open publication (https://pubmed.ncbi.nlm.nih.gov/34890968), licensed under a CC-BY license. Not internally tested by R&D Systems.
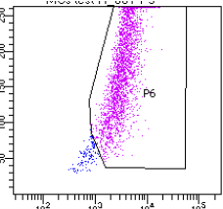
Detection of Osteopontin/OPN by Flow Cytometry
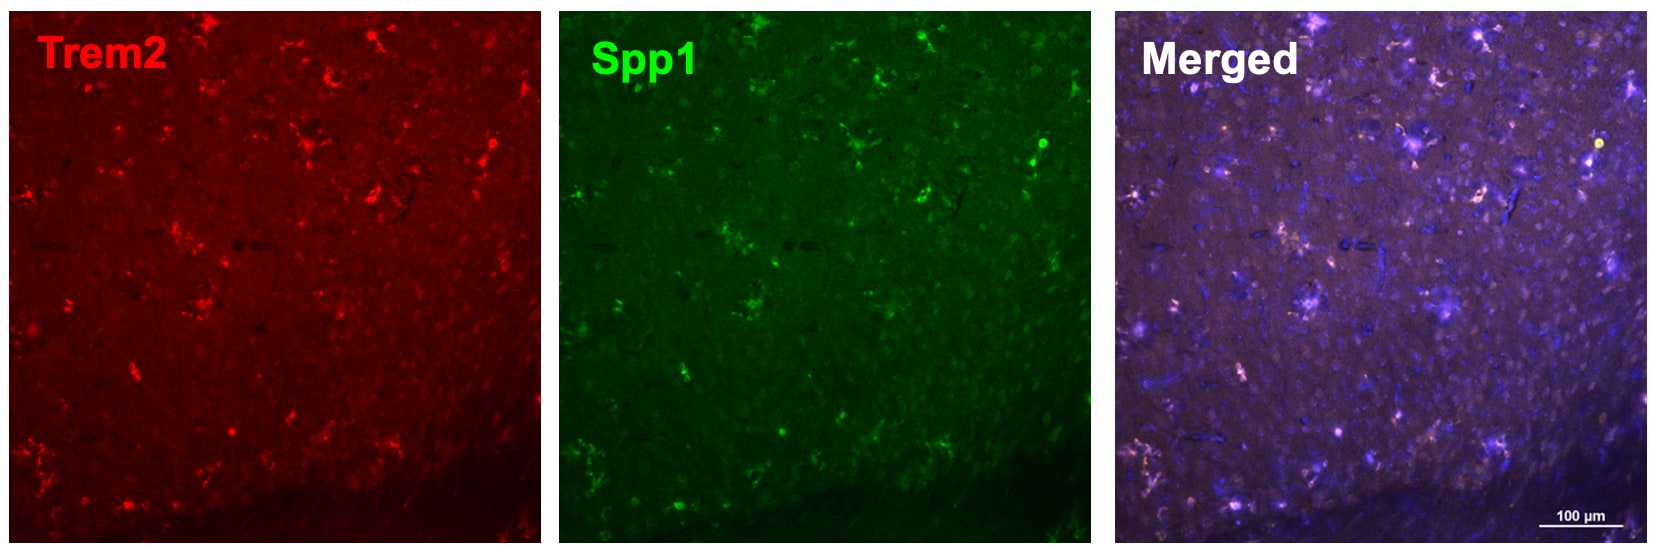
Angiogenic potential of retinal microglia during RAP. (A,B) Readplot using the log2 transformation of normalized reads visualizing differentially expressed genes between microglia from Ctrl; MGTom mice (y-axis) and Vldlr−/−; MGTom mice (x-axis) on postnatal day (p)17 (A) and p31 (B). Genes associated with angiogenesis are labeled blue. (C,D) Comparison of RNA Seq results of isolated microglia and protein analysis of retinal tissue lysates from Vldlr−/−; MGTom and Ctrl; MGTom mice at postnatal day (p)17 and p31 for Vegf (C) and Ccl12 (D). mRNA: n = 5–7 samples per group, protein n = 5 samples per group. (E,F) Intravitreal injection of anti-SPP1 ((E), n = 5) or anti-CCL12 ((F), n = 10) in comparison to an IgG injection (*, p < 0.05; **, p < 0.01; ***, p < 0.001). Image collected and cropped by CiteAb from the following open publication (https://pubmed.ncbi.nlm.nih.gov/35408803), licensed under a CC-BY license. Not internally tested by R&D Systems.
Detection of Osteopontin/OPN by Western Blot
Gene and protein expression in muscles from 3m mdx, mdx+ABX, and GFmdxA–KCropped images of representative WB and RT‐qPCR analysis of TA muscle of 3m mdx (n = 3/4), 3m mdx+ABX (n = 3/4), and 3m GFmdx (n = 5) showing the expression of the proteins specifically involved in inflammation/fibrosis (A), skeletal muscle metabolism (B–E), mitochondrial biogenesis (F and G), calcium conducting channels (H and I), autophagy (J), and nicotinic acetylcholine receptors (K). Densitometric data were normalized on vinculin and expressed as mean ± SD. Data are presented as mean ± SD (*P < 0.05, **P < 0.01, ***P < 0.001; ****P < 0.0001, ordinary one‐way ANOVA, Tukey's multiple‐comparison test for WB and non‐parametric test followed by Kruskal–Wallis test for RT‐qPCR).Source data are available online for this figure. Image collected and cropped by CiteAb from the following open publication (https://pubmed.ncbi.nlm.nih.gov/36533294), licensed under a CC-BY license. Not internally tested by R&D Systems.
Detection of Mouse Osteopontin/OPN by Western Blot
iOPN promoted STAT1-mediated immunosuppression in MSCs. a–d Vector-MSCs and iOPN-MSCs or WT-MSCs and OPN−/−-MSCs were treated with or without TNF-alpha plus IFN-gamma (10 ng/mL) for the indicated times. Cells were harvested, and OPN, NF-kappa B p65, STAT1, IKB alpha, phosphorylation of NF-kappa B p65, phosphorylation of STAT1 at Tyr701 and phosphorylation of IKB alpha were analyzed by immunoblotting analysis. Full-length blots are presented in Additional file 1: Fig. 5a-d. e–g Vector-MSCs and iOPN-MSCs were stimulated with TNF-alpha plus IFN-gamma (10 ng/mL) for 12 h. The STAT1 inhibitor fludarabine (Flu, 2 μM) was then added to the culture medium of Vector-MSCs and iOPN-MSCs. The expression of iNOS was determined by quantitative real-time PCR (e), immunoblotting analysis (f) and flow cytometry (g). Full-length blots are presented in Additional file 1: Fig. 5f. h Vector-MSCs and iOPN-MSCs were pretreated with DMSO or fludarabine (Flu, 2 μM) for 6 h and then irradiated and cocultured with CFSE-labeled splenocytes activated by anti-CD3/CD28 antibodies for 3 days at a ratio of 1:20. CD4+ T cells and CD8+ T cells were stained for proliferation analysis by flow cytometry at the end of coculture, and the percentages of proliferating T cells are shown. The results are representative of three to six independent experiments. Values are shown as the mean ± SEM and statistical significance is indicated as *P < 0.05, **P < 0.01 and ***P < 0.001 Image collected and cropped by CiteAb from the following open publication (https://pubmed.ncbi.nlm.nih.gov/39407354), licensed under a CC-BY license. Not internally tested by R&D Systems.
Detection of Mouse Osteopontin/OPN by Immunohistochemistry
Lymphatic drainage supports osteoblast survival and BMSC proliferation. A Representative immunofluorescence staining on fracture sides using an anti-OPN antibody to label OBs (green) and an anti-tunel antibody for cell apoptosis (red). Scale bars, 50 um. b Quantitative analysis of OBs apoptosis at fracture sides (n = 5/group, one-way ANOVA). c Scheme of the experimental procedure in vitro for OBs and BMSCs treated by bone marrow or hematoma CM. Bone marrow of sham group and hematoma of fractured group were collected to generate hematoma CM. Rat BMSCs and OBs were cultured with hematoma CM for 24 h and subjected to growth and proliferation analyses. The scheme was modified from Servier Medical Art (http://smart.servier.com/), licensed under a Creative Common Attribution 4.0 Generic License (https://creativecommons.org/licenses/by/4.0/). d Rat OBs were intervened with hematoma CM for 1 h and OB apoptosis was evaluated by flow cytometry with FITC-Annexin V and PI double staining (n = 5/group, one-way ANOVA). e Rat OBs were cultured with hematoma CM for 1 h and the growth of rat OBs was observed under a microscope. Scale bars, 50 um. f The cell count of rat OBs cultured with hematoma CM for 24 h. g Rat OBs were cultured with hematoma CM for 24 h and the cell proliferation was evaluated using a CCK8 kit. h Rat BMSCs were cultured with hematoma CM for 1 h and the growth of rat BMSCs was observed under a microscope. Scale bars, 50 um. i The cell count of rat BMSCs cultured with hematoma CM for 24 h. j Rat BMSCs, were cultured with hematoma CM for 24 h and the cell proliferation was evaluated using a CCK8 kit. Data are means ± SD. In f,g,i and j, n = 3 wells with biological replicates in the control, sham, VEH and CLO groups, one-way ANOVA. Source data are provided as a Source Data file. Image collected and cropped by CiteAb from the following open publication (https://pubmed.ncbi.nlm.nih.gov/39827193), licensed under a CC-BY license. Not internally tested by R&D Systems.
Mouse Osteopontin / OPN ELISA Standard Curve
Recombinant Mouse Osteopontin/OPN (Catalog # 441-OP) was serially diluted and captured by Goat Anti-Mouse Osteopontin/OPN Antigen Affinity-purified Polyclonal Antibody (Catalog # AF808) coated on a Clear Polystyrene Microplate (Catalog # DY990). Goat Anti-Mouse Osteopontin/OPN Antigen Affinity-purified Polyclonal Antibody (Catalog # AF808) was biotinylated and incubated with the protein captured on the plate. Detection of the standard curve was achieved by incubating Streptavidin-HRP (Catalog # DY998)
Mouse Osteopontin / OPN ELISA Standard Curve
Recombinant Mouse Osteopontin/OPN (Catalog # 441-OP) was serially diluted and captured by Goat Anti-Mouse Osteopontin/OPN Antigen Affinity-purified Polyclonal Antibody (Catalog # AF808) coated on a Clear Polystyrene Microplate (Catalog # DY990). Goat Anti-Mouse Osteopontin/OPN Antigen Affinity-purified Polyclonal Antibody (Catalog # AF808) was biotinylated and incubated with the protein captured on the plate. Detection of the standard curve was achieved by incubating Streptavidin-HRP (Catalog # DY998)Applications for Mouse Osteopontin/OPN Antibody
Application
Recommended Usage
Immunocytochemistry
5-25 µg/mL
Sample: Immersion fixed C2C12 mouse myoblast cell line
Sample: Immersion fixed C2C12 mouse myoblast cell line
Immunohistochemistry
5-15 µg/mL
Sample: Perfusion fixed frozen sections of mouse and thymus
Sample: Perfusion fixed frozen sections of mouse and thymus
Western Blot
0.1 µg/mL
Sample: Recombinant Mouse Osteopontin/OPN (Catalog # 441-OP)
Sample: Recombinant Mouse Osteopontin/OPN (Catalog # 441-OP)
Neutralization
Measured by its ability to neutralize Osteopontin/OPN-mediated adhesion of the HEK293 human embryonic kidney cell line. The Neutralization Dose (ND50) is typically 1-3 µg/mL in the presence of 2 µg/mL Recombinant Mouse Osteopontin/OPN.
Mouse Osteopontin/OPN Sandwich Immunoassay
Please Note: Optimal dilutions of this antibody should be experimentally determined.
Reviewed Applications
Read 14 reviews rated 4.1 using AF808 in the following applications:
Formulation, Preparation, and Storage
Purification
Antigen Affinity-purified
Reconstitution
Reconstitute at 0.2 mg/mL in sterile PBS. For liquid material, refer to CoA for concentration.
Loading...
Formulation
Lyophilized from a 0.2 μm filtered solution in PBS with Trehalose. See Certificate of Analysis for details.
*Small pack size (-SP) is supplied either lyophilized or as a 0.2 µm filtered solution in PBS.
*Small pack size (-SP) is supplied either lyophilized or as a 0.2 µm filtered solution in PBS.
Shipping
Lyophilized product is shipped at ambient temperature. Liquid small pack size (-SP) is shipped with polar packs. Upon receipt, store immediately at the temperature recommended below.
Stability & Storage
Use a manual defrost freezer and avoid repeated freeze-thaw cycles.
- 12 months from date of receipt, -20 to -70 °C as supplied.
- 1 month, 2 to 8 °C under sterile conditions after reconstitution.
- 6 months, -20 to -70 °C under sterile conditions after reconstitution.
Calculators
Background: Osteopontin/OPN
References
- Ann. N.Y. Acad. Sci., vol. 760, 1995, Apr. 21.
- Senger, D.R. et al. (1996) Biochim. Biophys. Acta. 1314:13.
- Agnihotri, R. et al. (2001) J. Biol. Chem. 276:28261.
Long Name
Secreted Phosphoprotein 1 [BNSP]
Alternate Names
Eta-1, OPN, Spp1
Gene Symbol
SPP1
UniProt
Additional Osteopontin/OPN Products
Product Documents for Mouse Osteopontin/OPN Antibody
Certificate of Analysis
To download a Certificate of Analysis, please enter a lot or batch number in the search box below.
Note: Certificate of Analysis not available for kit components.
Product Specific Notices for Mouse Osteopontin/OPN Antibody
For research use only
Citations for Mouse Osteopontin/OPN Antibody
 Powered by Bioz
Customer Reviews for Mouse Osteopontin/OPN Antibody (14)
4.1 out of 5
14 Customer Ratings
Have you used Mouse Osteopontin/OPN Antibody?
Submit a review and receive an Amazon gift card!
$25/€18/£15/$25CAN/¥2500 Yen for a review with an image
$10/€7/£6/$10CAN/¥1110 Yen for a review without an image
Submit a review
Customer Images

Showing
1
-
5 of
14 reviews
Showing All
Filter By:
-
Application: ImmunohistochemistrySample Tested: Placenta (chorionic villi)Species: MouseVerified Customer | Posted 10/14/2025Murine placenta cryosections stained with osteopontin (red). Tissue autofluorescence in blue.

-
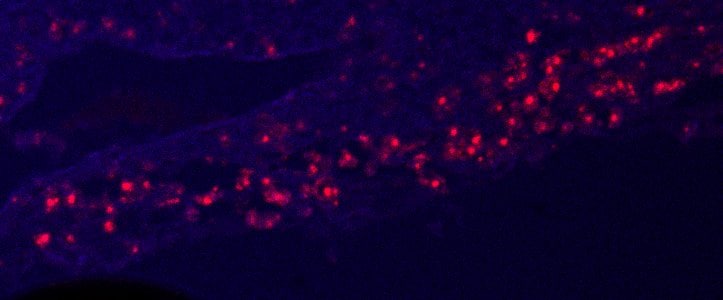
Application: ImmunohistochemistrySample Tested: Alzheimer's disease brainSpecies: MouseVerified Customer | Posted 10/03/2024
-
Application: Immunocytochemistry/ImmunofluorescenceSample Tested: C2C12 mouse myoblast cell lineSpecies: MouseVerified Customer | Posted 05/02/2024BSA 4% as blocking solution. Negative control with secondary only confirmed that the staining is specific.
-
Application: ImmunohistochemistrySample Tested: Skeletal muscle tissue and Skeletal muscle sectionSpecies: MouseVerified Customer | Posted 02/13/2024No positive IF signal in fresh frozen skeletal muscle section.
Bio-Techne ResponseThank you for reviewing our product. We are sorry to hear that this product did not perform as expected. We have been in touch with the customer to resolve this issue according to our Product Guarantee and to the customer’s satisfaction.
-
Application: Flow CytometrySample Tested: Lung cancer tissueSpecies: MouseVerified Customer | Posted 09/18/2022Try it for flow cytometry
-
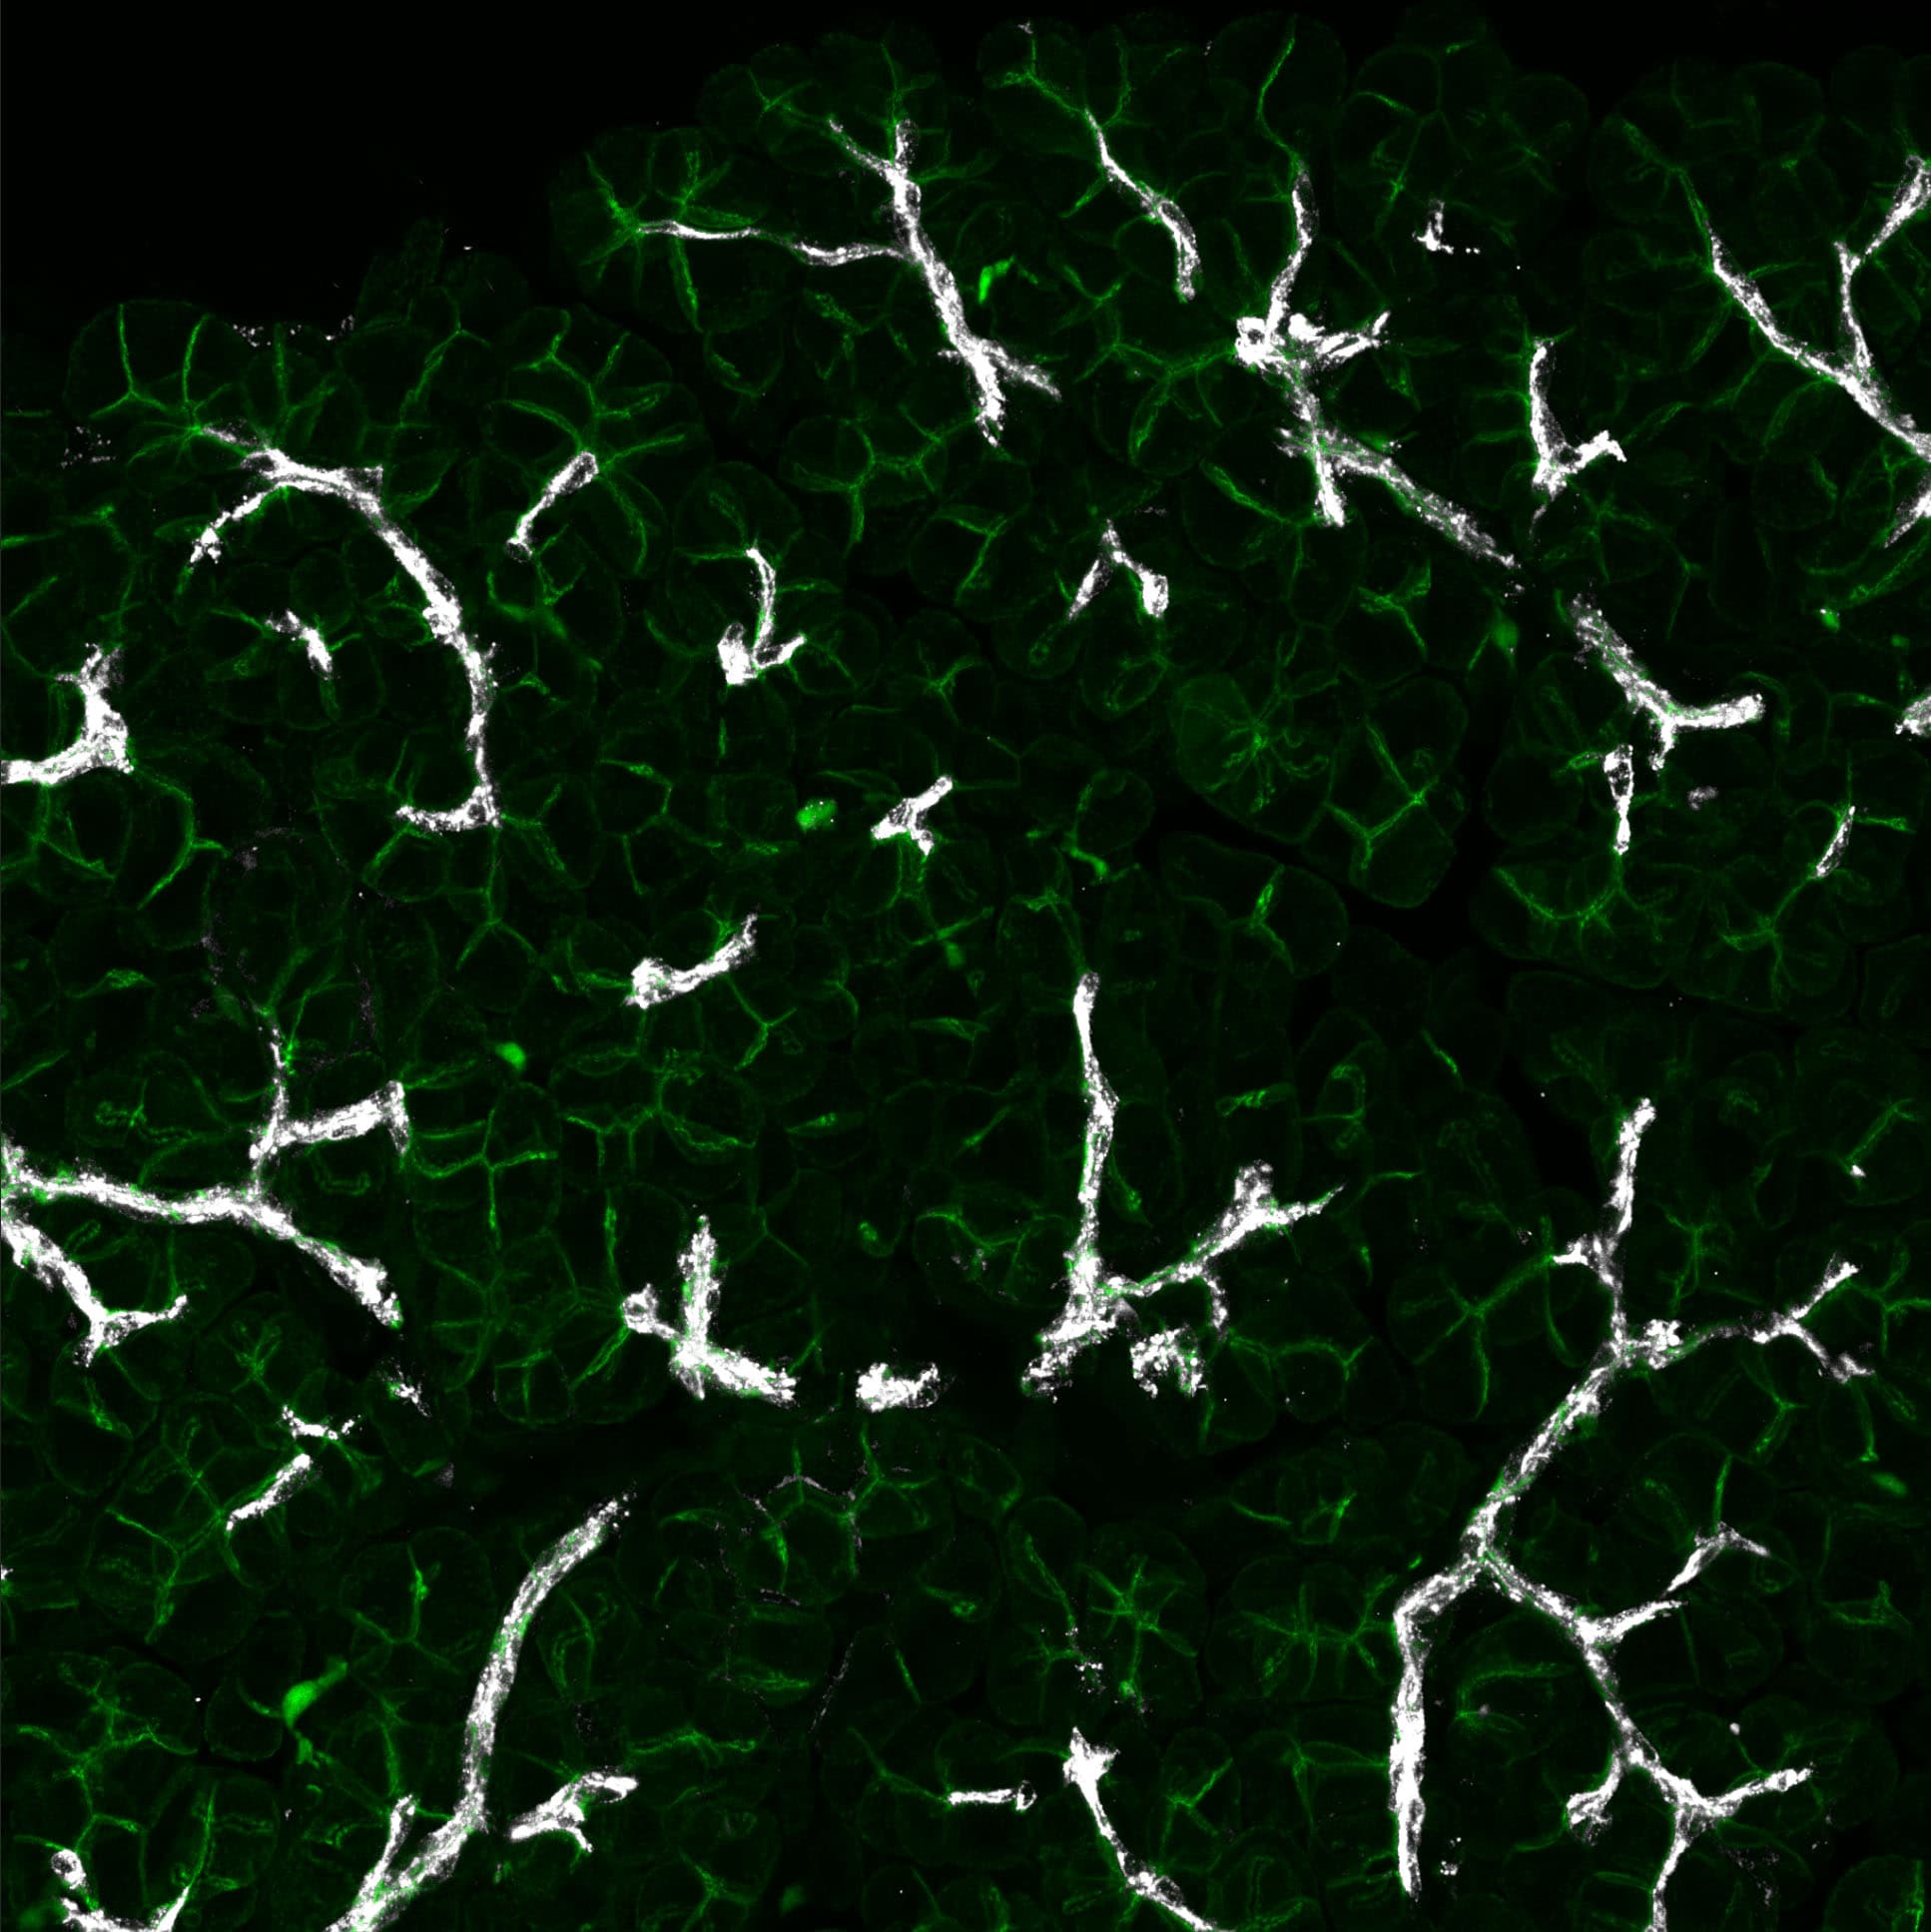
Application: Immunocytochemistry/ImmunofluorescenceSample Tested: Adult pancreasSpecies: MouseVerified Customer | Posted 07/14/2022Osteopontin (in white) was stained 1:200 on cryostat sections together with CD324-AF488 (in green). Ducts are clearly stained as expected.
-
Application: Western BlotSample Tested: Cell Culture Media and Cancer cell lysatesSpecies: MouseVerified Customer | Posted 07/02/2021Antibody reacts with BSA and some of the ladder proteins from Biorad. Unusable for WB since BSA size is too close from the OSTP size.
Bio-Techne ResponseThank you for reviewing our product. We are sorry to hear that this product did not perform as expected. We have been in touch with the customer to resolve this issue according to our Product Guarantee and to the customer’s satisfaction. Update from Tech Support Team
-
Application: Functional AssaySample Tested: PlasmaSpecies: MouseVerified Customer | Posted 11/22/2020
-
Application: ImmunohistochemistrySample Tested: Liver tissueSpecies: MouseVerified Customer | Posted 06/17/2020
-
Application: Western BlotSample Tested: A20 mouse B cell lymphoma cell lineSpecies: MouseVerified Customer | Posted 02/16/2020
-
Application: Immunocytochemistry/ImmunofluorescenceSample Tested: bone marrowSpecies: MouseVerified Customer | Posted 08/31/2018
-
Application: Immunocytochemistry/ImmunofluorescenceSample Tested: Cell Culture SamplesSpecies: RatVerified Customer | Posted 04/26/2017
-
Application: Immunohistochemistry-ParaffinSample Tested: See PMID 24038141Species: MouseVerified Customer | Posted 01/09/2015
-
Application: Immunohistochemistry-ParaffinSample Tested: See PMID 20548025Species: MouseVerified Customer | Posted 01/09/2015
There are no reviews that match your criteria.
Protocols
Find general support by application which include: protocols, troubleshooting, illustrated assays, videos and webinars.
- Antigen Retrieval Protocol (PIER)
- Antigen Retrieval for Frozen Sections Protocol
- Appropriate Fixation of IHC/ICC Samples
- Cellular Response to Hypoxia Protocols
- Chromogenic IHC Staining of Formalin-Fixed Paraffin-Embedded (FFPE) Tissue Protocol
- Chromogenic Immunohistochemistry Staining of Frozen Tissue
- ClariTSA™ Fluorophore Kits
- Detection & Visualization of Antibody Binding
- Fluorescent IHC Staining of Frozen Tissue Protocol
- Graphic Protocol for Heat-induced Epitope Retrieval
- Graphic Protocol for the Preparation and Fluorescent IHC Staining of Frozen Tissue Sections
- Graphic Protocol for the Preparation and Fluorescent IHC Staining of Paraffin-embedded Tissue Sections
- Graphic Protocol for the Preparation of Gelatin-coated Slides for Histological Tissue Sections
- ICC Cell Smear Protocol for Suspension Cells
- ICC Immunocytochemistry Protocol Videos
- ICC for Adherent Cells
- IHC Sample Preparation (Frozen sections vs Paraffin)
- Immunocytochemistry (ICC) Protocol
- Immunocytochemistry Troubleshooting
- Immunofluorescence of Organoids Embedded in Cultrex Basement Membrane Extract
- Immunofluorescent IHC Staining of Formalin-Fixed Paraffin-Embedded (FFPE) Tissue Protocol
- Immunohistochemistry (IHC) and Immunocytochemistry (ICC) Protocols
- Immunohistochemistry Frozen Troubleshooting
- Immunohistochemistry Paraffin Troubleshooting
- Preparing Samples for IHC/ICC Experiments
- Preventing Non-Specific Staining (Non-Specific Binding)
- Primary Antibody Selection & Optimization
- Protocol for Heat-Induced Epitope Retrieval (HIER)
- Protocol for Making a 4% Formaldehyde Solution in PBS
- Protocol for VisUCyte™ HRP Polymer Detection Reagent
- Protocol for the Fluorescent ICC Staining of Cell Smears - Graphic
- Protocol for the Fluorescent ICC Staining of Cultured Cells on Coverslips - Graphic
- Protocol for the Preparation & Fixation of Cells on Coverslips
- Protocol for the Preparation and Chromogenic IHC Staining of Frozen Tissue Sections
- Protocol for the Preparation and Chromogenic IHC Staining of Frozen Tissue Sections - Graphic
- Protocol for the Preparation and Chromogenic IHC Staining of Paraffin-embedded Tissue Sections
- Protocol for the Preparation and Chromogenic IHC Staining of Paraffin-embedded Tissue Sections - Graphic
- Protocol for the Preparation and Fluorescent ICC Staining of Cells on Coverslips
- Protocol for the Preparation and Fluorescent ICC Staining of Non-adherent Cells
- Protocol for the Preparation and Fluorescent ICC Staining of Stem Cells on Coverslips
- Protocol for the Preparation and Fluorescent IHC Staining of Frozen Tissue Sections
- Protocol for the Preparation and Fluorescent IHC Staining of Paraffin-embedded Tissue Sections
- Protocol for the Preparation of Gelatin-coated Slides for Histological Tissue Sections
- Protocol for the Preparation of a Cell Smear for Non-adherent Cell ICC - Graphic
- R&D Systems Quality Control Western Blot Protocol
- TUNEL and Active Caspase-3 Detection by IHC/ICC Protocol
- The Importance of IHC/ICC Controls
- Troubleshooting Guide: Immunohistochemistry
- Troubleshooting Guide: Western Blot Figures
- Western Blot Conditions
- Western Blot Protocol
- Western Blot Protocol for Cell Lysates
- Western Blot Troubleshooting
- Western Blot Troubleshooting Guide
- View all Protocols, Troubleshooting, Illustrated assays and Webinars
Loading...
Associated Pathways
