
Scientific images may be resized, cropped, or adjusted for brightness or contrast for presentation purposes. These updates are limited to presentation and do not affect the underlying scientific interpretation of the data. Where available, additional source data may be provided upon request.
Key Product Details
Species Reactivity
Validated:
Cited:
Applications
Validated:
Cited:
Label
Antibody Source
Product Specifications
Immunogen
Gly23-Ala342
Accession # NP_031451
Specificity
Clonality
Host
Isotype
Scientific Data Images for RAGE/AGER Antibody (175410)
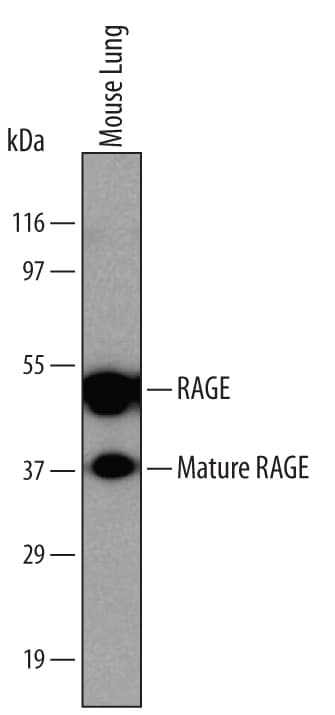
Detection of Mouse RAGE by Western Blot.
Western blot shows lysates of mouse lung tissue. PVDF membrane was probed with 2 µg/mL of Rat Anti-Mouse/Rat RAGE Monoclonal Antibody (Catalog # 1179) followed by HRP-conjugated Anti-Rat IgG Secondary Antibody (Catalog # HAF005). Specific bands were detected for RAGE and mature RAGE at approximately 50 and 38 kDa, respectively (as indicated). This experiment was conducted under non-reducing conditions and using Immunoblot Buffer Group 1.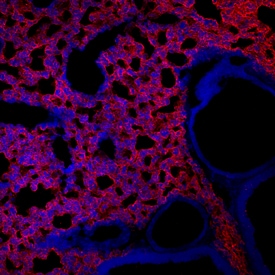
RAGE in Mouse Lung.
RAGE was detected in perfusion fixed frozen sections of adult mouse lung using Rat Anti-Mouse/Rat RAGE Monoclonal Antibody (Catalog # MAB1179) at 10 µg/mL overnight at 4 °C. Tissue was stained using the Northern-Lights™ 557-conjugated Anti-Rat IgG Secondary Antibody (red; Catalog # NL013) and counterstained with DAPI (blue). View our protocol for Fluorescent IHC Staining of Frozen Tissue Sections.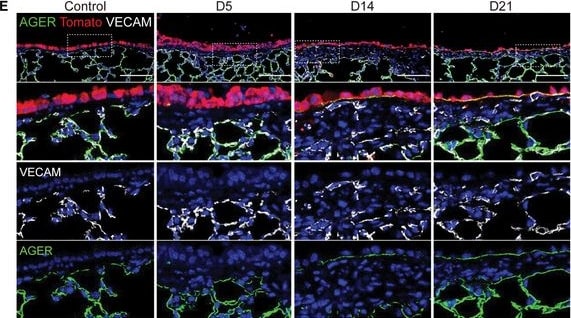
Detection of RAGE by Immunohistochemistry
YAP/TAZ activation in secretory cells enforces fate conversion into AT1 cells, but bypasses basal or AT2 cellsARepresentative IF images showing the expression of epithelial cell marker E‐cadherin and apoptosis marker TUNEL in Scgb1a1 lineage‐labeled tdTomato+ cells of control and Lats1/2 dKO lungs. Tomato (for secretory lineage, red), E‐cadherin (for epithelial cell, white), TUNEL (for apoptotic cells, green), and DAPI (blue). Scale bars, 100 μm.BRepresentative IF images showing the expression of basal cell marker P63 in Scgb1a1 lineage‐labeled tdTomato+ cells in control and Lats1/2 dKO lungs. Tomato (for secretory lineage, red), P63 (green), and DAPI (blue). Scale bars, 100 μm.CRepresentative IF images showing the expression of AT2 cell marker SPC in Scgb1a1 lineage‐labeled tdTomato+ cells in control and Lats1/2 dKO lungs. Tomato (for secretory lineage, red), SPC (green), and DAPI (blue). Scale bars, 100 μm.D, ERepresentative IF images showing the expression of AT1 cell markers T1 alpha (D), AGER (E), and endothelial marker VECAM (E) in Scgb1a1 lineage‐labeled tdTomato+ cells in control and Lats1/2 dKO lungs. Tomato (for secretory lineage, red), T1 alpha (D, green), AGER (E, green), VECAM (E, white), and DAPI (blue). Scale bars, 100 μm.FQuantification of Scgb1a1 lineage‐labeled tdTomato+AGER+ AT1 cells in (E). Data are presented as mean ± SEM (n = 5 mice for each group). *P < 0.05, ***P < 0.001 (Student’s t‐test). Image collected and cropped by CiteAb from the following open publication (https://link.springer.com/10.15252/embj.2021109365), licensed under a CC-BY license. Not internally tested by R&D Systems.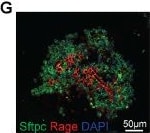
Detection of RAGE by Immunohistochemistry
Double-positive cells in Sftpc-CreER; LSL-KrasG12D-induced lung adenocarcinoma are tumor-propagating cells and forms tumors upon transplantation. A, Experimental outline for growing cells in 3D organoid culture. B, FACS scatter plot showing single (type I or type II) and double-positive population sorted from Sftpc-CreER; LSL-KrasG12D; TdTomato mice. Type I (TdTm−Pdpn+), type II (TdTm+ Pdpn−), and double-positive (type I/II+; TdTm+Pdpn+) fractions were sorted. C, Brightfield images of 3D organoid cultures from different indicated sorted populations on day 14. Colony number (D) and colony size (E) was quantified using ImageJ software. F, 3D organoid culture from double-positive cells on day 14 in red channel. G, Immunofluorescent image on day 14 of organoid culture showing double-positive cells differentiate into type I and type II cells. Ki67 (H) and TTF1 (I) staining of 3D organoid culture. J, Representative H&E staining of tumors sections which were obtained after subcutaneous transplantation of double-positive (type I/II+) cells. Right panel shows higher magnification of boxed area in left panels. K, Representative IHC images of tumor sections for TTF1. Right panel shows higher magnification of boxed area in left panels. L, Representative immunofluorescent image for in red channel showing Tdtomato expression in tumor obtained after transplantation. M, Representative IF images for Sftpc and Rage staining. Right panel shows higher magnification of boxed area in left panels. Results shown in B, F, G, H, I, J, K, L, and M are representative of three independent experiments. D and E represent data from three independent experiments. Error bars represent the mean ± SEM values and significance is defined as *, P ≤ 0.05; **, P ≤ 0.01; and ***, P ≤ 0.001. Image collected and cropped by CiteAb from the following open publication (https://pubmed.ncbi.nlm.nih.gov/37882674), licensed under a CC-BY license. Not internally tested by R&D Systems.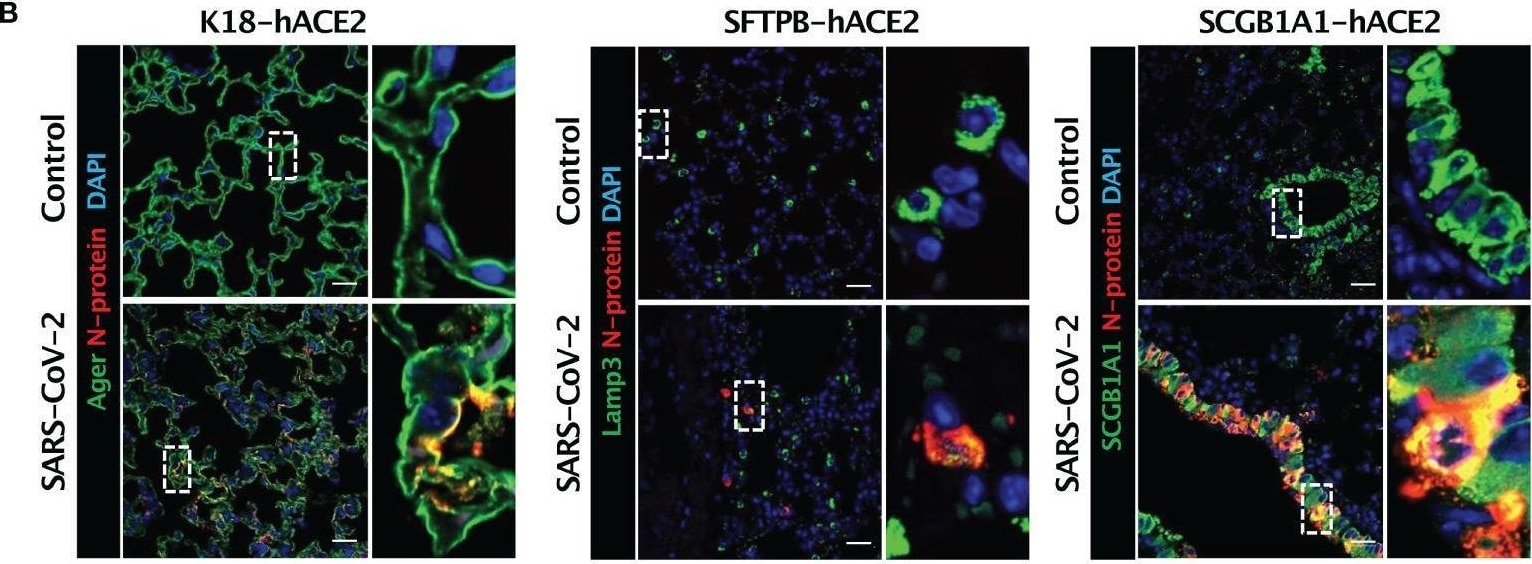
Detection of RAGE by Immunohistochemistry
SARS-CoV-2 distribution and viral target cells in the lungs from each mouse model. (A) SARS-CoV-2 distribution in the lungs analysed using in situ hybridisation at 2, 5, and 7 dpi with 1 × 10⁵ PFU SARS-CoV-2. (B) Representative confocal immunofluorescence micrographs of the lungs of K18-hACE2 (left), SFTPB-hACE2 (middle), and SCGB1A1-hACE2 (right) mice from the PBS-treated control group (top) and SARS-CoV-2-infected group (bottom) at 2 dpi. SARS-CoV-2 N-protein-positive cells are stained red, and type 1 alveolar (Ager), type 2 alveolar (Lamp3), or club (SCGB1A1) cells are stained green. Nuclei of cells are stained blue with DAPI. The scale bars are 100 μm. (C) Quantification of the percentage of infected cells from the lungs of K18-hACE2 (left), SFTPB-hACE2 (middle), and SCGB1A1-hACE2 (right) mice analysed from the confocal immunofluorescence micrographs shown in (B). Lung sections from SARS-CoV-2-infected mice at 2 dpi stained with anti-SARS-CoV-2 N-protein antibody and one of anti-Ager, anti-Lamp3, anti-SCGB1A1, anti-Muc5ac, or anti-tubulin antibodies. Image collected and cropped by CiteAb from the following open publication (https://pubmed.ncbi.nlm.nih.gov/36457995), licensed under a CC-BY license. Not internally tested by R&D Systems.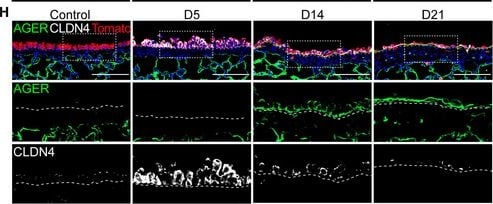
Detection of RAGE by Immunohistochemistry
Sustained activation of YAP/TAZ drives the fate conversion of secretory cells into AT1 cells via DATP cell statesAExperimental design for isolating Scgb1a1 lineage‐labeled cells from control and Lats1/2 dKO lungs at indicated time points post tamoxifen treatment. Isolated cells were subjected to scRNA‐seq analysis.BClusters of Scgb1a1 lineage‐labeled cells from 10XGenomics 3’ single‐cell RNA sequencing (scRNA‐seq) analysis visualized by Uniform Manifold Approximation and Projection (UMAP), assigned by specific colors at day 5 and 14 post tamoxifen treatment. The number of cells in the individual cluster is depicted in the figure.CDistribution of each cluster across indicated time points after tamoxifen treatment.DBar graph showing the percentage of secretory, DATPs, and AT1 cell clusters in control and Lats1/2 dKO lungs at day 5 and 14 post tamoxifen treatment.EBlob plot depicting selected marker genes in cell clusters. Dot size encodes the percentage of cells expressing the gene, and color encodes the average per cell gene expression level.FPseudotime ordering of Scgb1a1 lineage‐labeled cells colored by cluster assignment (right) according to diffusion pseudotime (DPT, left) order.G, HRepresentative IF images of control and Lats1/2 dKO airways at indicated time points post tamoxifen treatment. Tomato (for Scgb1a1 lineage, red), CLDN4 (for DATPs, white), CC10 (G, green), AGER (H, for AT1 cell, green), and DAPI (blue). Scale bar, 100 μm.IQuantification of Scgb1a1 lineage‐labeled tdTomato+CLDN4+ DATPs in (G and H). Data are presented as mean ± SEM (n = 5 mice for each genotype). ***P < 0.001 (Student’s t‐test). Image collected and cropped by CiteAb from the following open publication (https://link.springer.com/10.15252/embj.2021109365), licensed under a CC-BY license. Not internally tested by R&D Systems.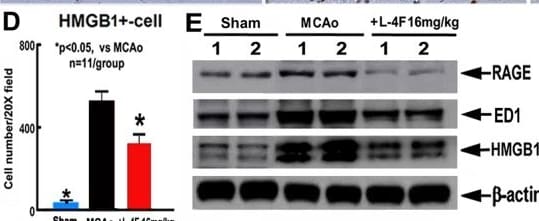
Detection of RAGE by Western Blot
L-4F treatment decreases RAGE/ED1/HMGB-1, and PAI-1 in the ischemic brain in T2DM mice 4 days after MCAo. (A–D) HMGB-1 immunostaining and quantitative data; (E,F) RAGE/ED1/HMGB-1 WB assay and quantitative data; (G,H) TNF alpha /PAI-1 WB assay and quantitative data; (I) TNF alpha /PAI-1 RT-PCR data. Scale bar in (A–C) = 50 μm; ∗p < 0.05, n = 11/group in (A–D); n = 6/group in (A–I). Image collected and cropped by CiteAb from the following open publication (https://pubmed.ncbi.nlm.nih.gov/31708728), licensed under a CC-BY license. Not internally tested by R&D Systems.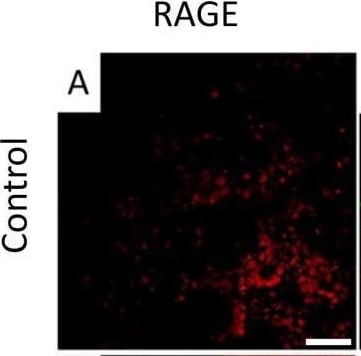
Detection of RAGE by Immunocytochemistry/ Immunofluorescence
Immunofluorescent staining revealed increased RAGE expression in TG mouse lungs ((F,K) vs. A) and diminished localization of NKX2.1 ((G,L) vs. B) and alpha smooth muscle actin (ACTA 2; (H,M) vs. C). DAPI counterstained images (D,I,N) and merged images that contains RAGE, NKX2.1, ACTA 2, and DAPI (E,J,O) are also depicted. All images are at 400× original magnification and scale bars represent 50 μm. Image collected and cropped by CiteAb from the following open publication (https://pubmed.ncbi.nlm.nih.gov/37489334), licensed under a CC-BY license. Not internally tested by R&D Systems.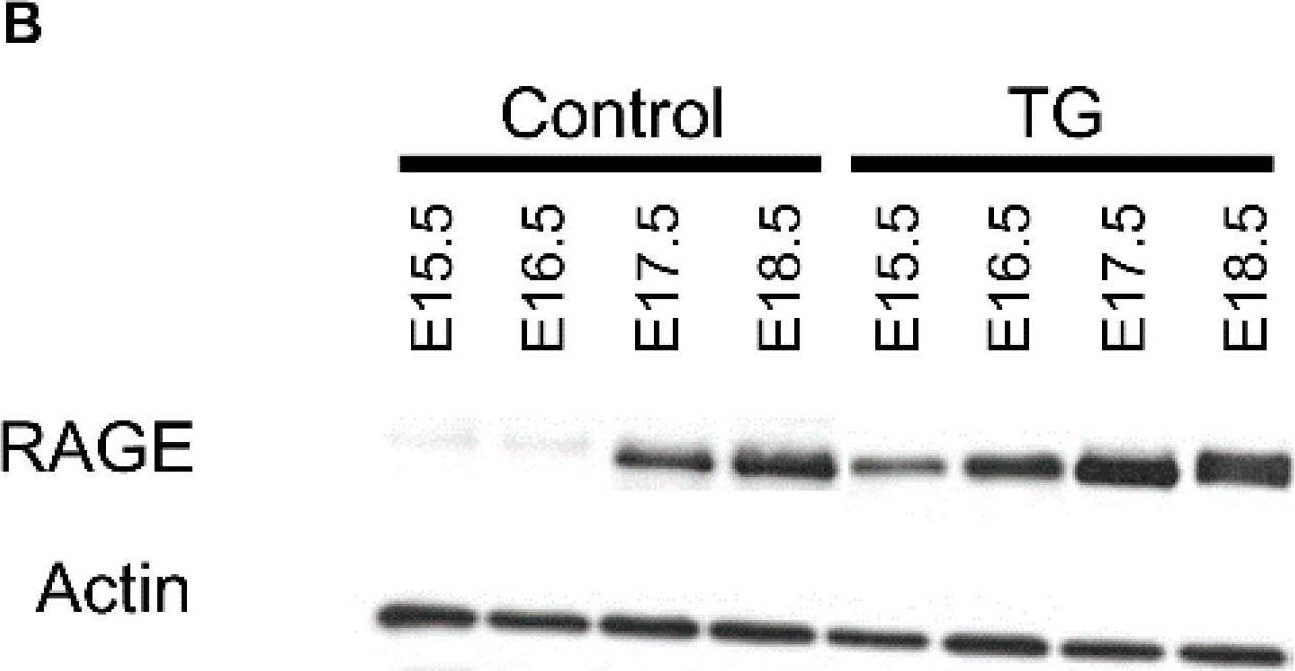
Detection of RAGE by Western Blot
(A) Doxycycline (Dox)-inducible expression of RAGE in transgenic (TG) mice required a reverse tetracycline transactivator (rtTA) localized to respiratory epithelial cells via the human surfactant protein (hSP)-C promoter. The rtTA complexed with Dox and activated Tet-inducible RAGE expression. (B) Representative immunoblotting revealed increased expression of RAGE in RAGE TG mice fed Dox compared to Dox-exposed control animals. Actin was used as a loading control. Image collected and cropped by CiteAb from the following open publication (https://pubmed.ncbi.nlm.nih.gov/37489334), licensed under a CC-BY license. Not internally tested by R&D Systems.Applications for RAGE/AGER Antibody (175410)
Immunohistochemistry
Sample: Perfusion fixed frozen sections of adult mouse lung
Western Blot
Sample: Mouse lung tissue
Under non-reducing conditions only
Reviewed Applications
Read 1 review rated 5 using MAB1179 in the following applications:
Formulation, Preparation, and Storage
Purification
Reconstitution
Reconstitute at 0.5 mg/mL in sterile PBS. For liquid material, refer to CoA for concentration.
Formulation
Shipping
Stability & Storage
- 12 months from date of receipt, -20 to -70 °C as supplied.
- 1 month, 2 to 8 °C under sterile conditions after reconstitution.
- 6 months, -20 to -70 °C under sterile conditions after reconstitution.
Calculators
Background: RAGE/AGER
References
- Schmidt, A. et al. (2001) J. Clin. Invest. 108:949.
- Chavakis, T. et al. (2003) J. Exp. Med. 198:507.
- Renard, C. et al. (1997) Mol. Pharmacol. 52:54.
- Yonekura, H. et al. (2003) Biochem. J. 370:1097.
- Hori, O. et al. (1995) J. Biol. Chem. 270:25752.
- Brett, J. et al. (1993) Am. J. Pathol. 143:1699.
- Valencia, J.V. et al. (2004) Diabetes 53:743.
Long Name
Alternate Names
Gene Symbol
UniProt
Additional RAGE/AGER Products
Product Documents for RAGE/AGER Antibody (175410)
Certificate of Analysis
To download a Certificate of Analysis, please enter a lot or batch number in the search box below.
Note: Certificate of Analysis not available for kit components.
Product Specific Notices for RAGE/AGER Antibody (175410)
For research use only
Citations for RAGE/AGER Antibody (175410)
 Powered by Bioz
Customer Reviews for RAGE/AGER Antibody (175410) (1)
Have you used RAGE/AGER Antibody (175410)?
Submit a review and receive an Amazon gift card!
$25/€18/£15/$25CAN/¥2500 for a review with an image
$10/€7/£6/$10CAN/¥1110 for a review without an image
Submit a review
Customer Images
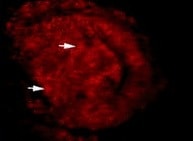
-
Application: ImmunofluorescenceSample Tested: Kidney tissueSpecies: MouseVerified Customer | Posted 08/25/2021

There are no reviews that match your criteria.
Protocols
Find general support by application which include: protocols, troubleshooting, illustrated assays, videos and webinars.
- Antigen Retrieval Protocol (PIER)
- Antigen Retrieval for Frozen Sections Protocol
- Appropriate Fixation of IHC/ICC Samples
- Cellular Response to Hypoxia Protocols
- Chromogenic IHC Staining of Formalin-Fixed Paraffin-Embedded (FFPE) Tissue Protocol
- Chromogenic Immunohistochemistry Staining of Frozen Tissue
- ClariTSA™ Fluorophore Kits
- Detection & Visualization of Antibody Binding
- Fluorescent IHC Staining of Frozen Tissue Protocol
- Graphic Protocol for Heat-induced Epitope Retrieval
- Graphic Protocol for the Preparation and Fluorescent IHC Staining of Frozen Tissue Sections
- Graphic Protocol for the Preparation and Fluorescent IHC Staining of Paraffin-embedded Tissue Sections
- Graphic Protocol for the Preparation of Gelatin-coated Slides for Histological Tissue Sections
- IHC Sample Preparation (Frozen sections vs Paraffin)
- Immunofluorescent IHC Staining of Formalin-Fixed Paraffin-Embedded (FFPE) Tissue Protocol
- Immunohistochemistry (IHC) and Immunocytochemistry (ICC) Protocols
- Immunohistochemistry Frozen Troubleshooting
- Immunohistochemistry Paraffin Troubleshooting
- Preparing Samples for IHC/ICC Experiments
- Preventing Non-Specific Staining (Non-Specific Binding)
- Primary Antibody Selection & Optimization
- Protocol for Heat-Induced Epitope Retrieval (HIER)
- Protocol for Making a 4% Formaldehyde Solution in PBS
- Protocol for VisUCyte™ HRP Polymer Detection Reagent
- Protocol for the Preparation & Fixation of Cells on Coverslips
- Protocol for the Preparation and Chromogenic IHC Staining of Frozen Tissue Sections
- Protocol for the Preparation and Chromogenic IHC Staining of Frozen Tissue Sections - Graphic
- Protocol for the Preparation and Chromogenic IHC Staining of Paraffin-embedded Tissue Sections
- Protocol for the Preparation and Chromogenic IHC Staining of Paraffin-embedded Tissue Sections - Graphic
- Protocol for the Preparation and Fluorescent IHC Staining of Frozen Tissue Sections
- Protocol for the Preparation and Fluorescent IHC Staining of Paraffin-embedded Tissue Sections
- Protocol for the Preparation of Gelatin-coated Slides for Histological Tissue Sections
- R&D Systems Quality Control Western Blot Protocol
- TUNEL and Active Caspase-3 Detection by IHC/ICC Protocol
- The Importance of IHC/ICC Controls
- Troubleshooting Guide: Immunohistochemistry
- Troubleshooting Guide: Western Blot Figures
- Western Blot Conditions
- Western Blot Protocol
- Western Blot Protocol for Cell Lysates
- Western Blot Troubleshooting
- Western Blot Troubleshooting Guide
- View all Protocols, Troubleshooting, Illustrated assays and Webinars