The cadherin (Ca++-dependent adherence) superfamily is a large group of membrane-associated glycoproteins that engage in homotypic, calcium-dependent, cell-cell adhesion events. The superfamily can be divided into at least five major subfamilies based on molecule gene structure, and/or extracellular (EC) and intracellular domains (1-4). Subfamilies include classical/type I, atypical/type II, and desmosomal-related cadherins (1-3). VE-Cadherin (vascular endothelial cadherin; also cadherin-5 and CD144) is a 125 kDa atypical/type II subfamily cadherin. Its subfamily classification is based principally on its genomic structure, as its physical structure is notably divergent from other type II subfamily members (2, 3). Mouse VE-Cadherin is synthesized as a 784 amino acid (aa) type I transmembrane (TM) preproprotein that contains a 24 aa signal peptide, a 21 aa prosequence, a 554 aa extracellular region (ECR), a 21 aa TM segment, and a 164 aa cytoplasmic domain (5, 6). The ECR contains five Ca++-binding cadherin domains that are approximately 105 aa in length. Cadherin domains are comprised of two beta ‑sheets that are oriented like bread in a sandwich. Although complex, the N-terminal cadherin domain mediates trans interactions, while the internal domains contribute to cis multimerizations (7). Mouse VE-Cadherin ECR is 92%, 77%, and 73% aa identical to rat, human and porcine VE-Cadherin ECR, respectively. VE-Cadherin is involved in the maintenance of endothelial permeability. In this regard, VE-Cadherin does not initiate new blood vessel formation; it maintains it once formed. Thus, when VE‑Cadherin is downregulated, cells part and permeability increases (8). Notably, VEGF is known to promote vascular leakage, and apparently does so by inducing a beta ‑arrestin-dependent endocytosis of VE-Cadherin (9). Part of this effect may be mediated by VE‑Cadherin itself which is reported to increase the membrane half-life of VEGF R2 (10). VE-Cadherin acts homotypically at sites of zonula adherens. On each expressing cell, it is proposed that VE-Cadherin first forms a trimer, which then dimerizes with a trimeric counterpart in-trans. Alternatively, two cis-dimers could act in-trans to generate homotypic binding (11). In addition to cell adhesion, VE‑Cadherin also is reported to mediate TGF-beta receptor assembly. When clustered, VE‑Cadherin enhances T beta RII/T beta RI assembly into an active receptor complex on endothelial cells (12). VE-Cadherin is expressed on endothelial cells, trophoblast cells, endothelial progenitor cells and embryonic hematopoietic cells (5, 8, 13, 14).
Best Seller
Mouse VE-Cadherin Antibody
R&D Systems | Catalog # AF1002

Key Product Details
Species Reactivity
Validated:
Mouse
Cited:
Human, Mouse, Rat, Transgenic Mouse
Applications
Validated:
Immunohistochemistry, Western Blot, Dual RNAscope ISH-IHC Compatible, Simple Western
Cited:
Immunohistochemistry, Immunohistochemistry-Paraffin, Immunohistochemistry-Frozen, Western Blot, Flow Cytometry, Immunocytochemistry
Label
Unconjugated
Antibody Source
Polyclonal Goat IgG
Loading...
Product Specifications
Immunogen
Mouse myeloma cell line NS0-derived recombinant mouse VE-Cadherin
Asp46-Gln592
Accession # 2208309A
Asp46-Gln592
Accession # 2208309A
Specificity
Detects mouse VE-Cadherin in direct ELISAs and Western blots. In direct ELISAs, approximately 30% cross‑reactivity with recombinant human VE-Cadherin is observed.
Clonality
Polyclonal
Host
Goat
Isotype
IgG
Scientific Data Images for Mouse VE-Cadherin Antibody
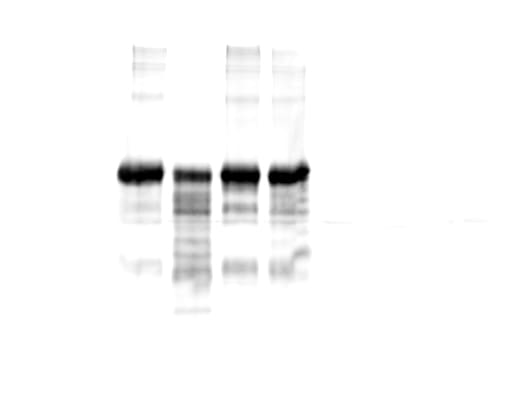
Detection of Mouse VE‑Cadherin by Western Blot.
Western blot shows lysates of mouse lung tissue and bEnd.3 mouse endothelioma cell line. PVDF membrane was probed with 0.2 µg/mL of Goat Anti-Mouse VE‑Cadherin Antigen Affinity-purified Polyclonal Antibody (Catalog # AF1002) followed by HRP-conjugated Anti-Goat IgG Secondary Antibody (Catalog # HAF017). A specific band was detected for VE‑Cadherin at approximately 120 kDa (as indicated). This experiment was conducted under reducing conditions and using Immunoblot Buffer Group 1.
VE‑Cadherin in Mouse Heart.
VE-Cadherin was detected in immersion fixed paraffin-embedded sections of mouse heart using Goat Anti-Mouse VE-Cadherin Antigen Affinity-purified Polyclonal Antibody (Catalog # AF1002) at 3 µg/mL for 1 hour at room temperature followed by incubation with the Anti-Goat IgG VisUCyte™ HRP Polymer Antibody (Catalog # VC004). Tissue was stained using DAB (brown) and counterstained with hematoxylin (blue). Specific staining was localized to cell membranes. View our protocol for IHC Staining with VisUCyte HRP Polymer Detection Reagents.
Detection of Mouse VE‑Cadherin by Simple WesternTM.
Simple Western lane view shows lysates of mouse lung tissue, loaded at 0.2 mg/mL. Specific bands were detected for VE‑Cadherin at approximately 118, 146 kDa (as indicated) using 10 µg/mL of Goat Anti-Mouse VE‑Cadherin Antigen Affinity-purified Polyclonal Antibody (Catalog # AF1002). This experiment was conducted under reducing conditions and using the 12-230 kDa separation system.
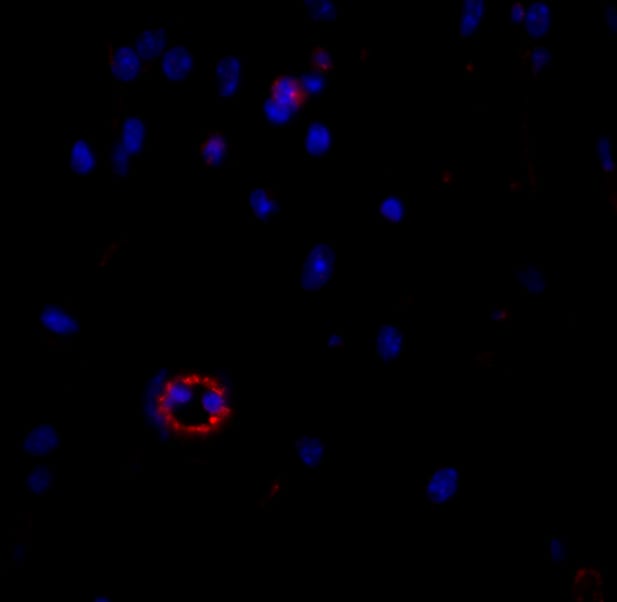
Detection of Mouse VE-Cadherin by Immunocytochemistry/Immunofluorescence
Resting skin vessels contain high density HS moieties preferentially expressed at their basolateral compartments.(A, C, E, F, G) Axial and longitudinal sections of vessels of (A, B) naïve frozen, or (C, D, E, F, G) paraffin embedded murine flank skin tissues. Tissues were stained for HS with monoclonal mouse IgM (10E4 epitope; red), goat anti mouse VE-cadherin (cyan), FITC-mouse monoclonal to alpha -SMA (green), and nuclei (blue). (H) HS and alpha -SMA profile of the fluorescence intensity along the purple arrow in the merged image. Double-headed black arrow denotes the vessel lumen as indicated by VE-cadherin. In C, D and G, small-headed arrows denote the endothelial apical side, large-headed arrows denote the endothelial basolateral side, and broken-line arrows denote the pericyte basolateral side. Images were taken at 100X magnification. Scale bar represents 5 µm. Image collected and cropped by CiteAb from the following publication (https://dx.plos.org/10.1371/journal.pone.0085699), licensed under a CC-BY license. Not internally tested by R&D Systems.
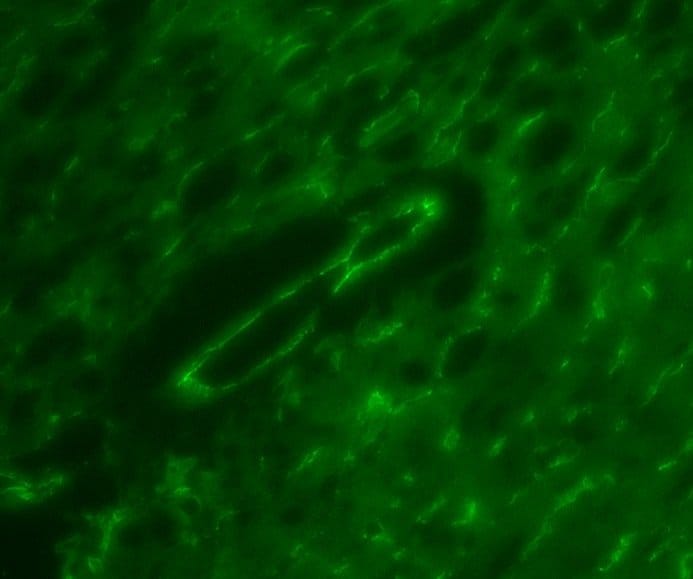
Detection of Rat VE-Cadherin by Immunohistochemistry
Chronic intermittent hypoxia modifies the BM vascular structure. a’–e’ Representative images of femur bone marrow stained with vWF, CD105, VE-cadherin, SMA, and CD11b counterstained with hematoxylin. a”, c”, d” BM from CIH exposed rats (n = 6) has more VE-cadherin+ vessels and SMA coverage but less vWF+ sinusoids (400×, Leica DM2500). e’, e” Representative images of CD11b immunohistochemistry in femur BM show an increase in BM monocyte count in CIH exposed animals. (400×, Leica DM2500) a’, a”’, b’, b” No changes in the total number of vessels or in megakaryocyte count were observed, as accounted by CD105 and vWF staining, respectively. Results are represented as the mean ± SD of bone marrow sections from six male Wistar rats (*p < 0.05; **p < 0.01). f Representative images of femur bone marrow fluorescently immunostained for VE-cadherin show an increase in total VE-cadherin vessels and in VE-cadherin vessel coverage. Scale bar, 50 μm (insets magnified 2.5×). Images were acquired with a Zeiss LSM 510 META microscope Image collected and cropped by CiteAb from the following publication (https://pubmed.ncbi.nlm.nih.gov/26856724), licensed under a CC-BY license. Not internally tested by R&D Systems.
Detection of Mouse VE-Cadherin by Immunocytochemistry/Immunofluorescence
Resting skin vessels contain high density HS moieties preferentially expressed at their basolateral compartments.(A, C, E, F, G) Axial and longitudinal sections of vessels of (A, B) naïve frozen, or (C, D, E, F, G) paraffin embedded murine flank skin tissues. Tissues were stained for HS with monoclonal mouse IgM (10E4 epitope; red), goat anti mouse VE-cadherin (cyan), FITC-mouse monoclonal to alpha -SMA (green), and nuclei (blue). (H) HS and alpha -SMA profile of the fluorescence intensity along the purple arrow in the merged image. Double-headed black arrow denotes the vessel lumen as indicated by VE-cadherin. In C, D and G, small-headed arrows denote the endothelial apical side, large-headed arrows denote the endothelial basolateral side, and broken-line arrows denote the pericyte basolateral side. Images were taken at 100X magnification. Scale bar represents 5 µm. Image collected and cropped by CiteAb from the following publication (https://dx.plos.org/10.1371/journal.pone.0085699), licensed under a CC-BY license. Not internally tested by R&D Systems.
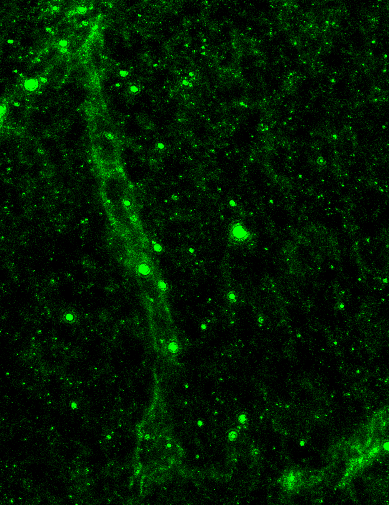
Detection of Mouse VE-Cadherin by Flow Cytometry
FACS analysis of emerging vascular EC progenies from mES and iPS cells.Adherent cells (2x10⁵) were detached and subjected to two-step FACS-aided purification. Control FACS profile on day 5 of cells derived from mES (J1) cells (A). Representative FACS profiles of day 5, with vascular progenies assessed using anti-Flk1 and anti-VE-cadherin antibodies obtained from mES (J1) cells (B) and derived from miPS (iMZ-21) cells (C); Control FACS profile on day 5 of cells derived from miPS (iMZ-21) cells (D). Representative FACS after the second step of purification derived from mES (E) and iPS cells (F). The yield of Flk1+VE-cadherin+ after the second round of FACS was 100% for both mES and miPS-derived vascular progenies. Morphology of mES- and miPS-derived vascular ECs (G-J). Flk1+VE-cadherin+ vascular progenies derived from mES and miPS cells were cultured overnight in IV Col-coated dishes, immunostained with anti-VE-cadherin (green) and anti-CD31 (red) of cells derived from mES cells (G&H) and miPS cells (I&J). DAPI, nucleus (blue). Magnifications are as indicated; the scale bar is 200 µm. Experiments were repeated 3 times. Image collected and cropped by CiteAb from the following publication (https://dx.plos.org/10.1371/journal.pone.0085549), licensed under a CC-BY license. Not internally tested by R&D Systems.
Detection of Mouse VE-Cadherin by Immunocytochemistry/Immunofluorescence
Resting skin vessels contain high density HS moieties preferentially expressed at their basolateral compartments.(A, C, E, F, G) Axial and longitudinal sections of vessels of (A, B) naïve frozen, or (C, D, E, F, G) paraffin embedded murine flank skin tissues. Tissues were stained for HS with monoclonal mouse IgM (10E4 epitope; red), goat anti mouse VE-cadherin (cyan), FITC-mouse monoclonal to alpha -SMA (green), and nuclei (blue). (H) HS and alpha -SMA profile of the fluorescence intensity along the purple arrow in the merged image. Double-headed black arrow denotes the vessel lumen as indicated by VE-cadherin. In C, D and G, small-headed arrows denote the endothelial apical side, large-headed arrows denote the endothelial basolateral side, and broken-line arrows denote the pericyte basolateral side. Images were taken at 100X magnification. Scale bar represents 5 µm. Image collected and cropped by CiteAb from the following publication (https://dx.plos.org/10.1371/journal.pone.0085699), licensed under a CC-BY license. Not internally tested by R&D Systems.
Detection of Mouse VE-Cadherin by Flow Cytometry
FACS analysis of emerging vascular EC progenies from mES and iPS cells.Adherent cells (2x10⁵) were detached and subjected to two-step FACS-aided purification. Control FACS profile on day 5 of cells derived from mES (J1) cells (A). Representative FACS profiles of day 5, with vascular progenies assessed using anti-Flk1 and anti-VE-cadherin antibodies obtained from mES (J1) cells (B) and derived from miPS (iMZ-21) cells (C); Control FACS profile on day 5 of cells derived from miPS (iMZ-21) cells (D). Representative FACS after the second step of purification derived from mES (E) and iPS cells (F). The yield of Flk1+VE-cadherin+ after the second round of FACS was 100% for both mES and miPS-derived vascular progenies. Morphology of mES- and miPS-derived vascular ECs (G-J). Flk1+VE-cadherin+ vascular progenies derived from mES and miPS cells were cultured overnight in IV Col-coated dishes, immunostained with anti-VE-cadherin (green) and anti-CD31 (red) of cells derived from mES cells (G&H) and miPS cells (I&J). DAPI, nucleus (blue). Magnifications are as indicated; the scale bar is 200 µm. Experiments were repeated 3 times. Image collected and cropped by CiteAb from the following publication (https://dx.plos.org/10.1371/journal.pone.0085549), licensed under a CC-BY license. Not internally tested by R&D Systems.
Detection of Mouse VE-Cadherin by Immunocytochemistry/Immunofluorescence
FACS analysis of emerging vascular EC progenies from mES and iPS cells.Adherent cells (2x10⁵) were detached and subjected to two-step FACS-aided purification. Control FACS profile on day 5 of cells derived from mES (J1) cells (A). Representative FACS profiles of day 5, with vascular progenies assessed using anti-Flk1 and anti-VE-cadherin antibodies obtained from mES (J1) cells (B) and derived from miPS (iMZ-21) cells (C); Control FACS profile on day 5 of cells derived from miPS (iMZ-21) cells (D). Representative FACS after the second step of purification derived from mES (E) and iPS cells (F). The yield of Flk1+VE-cadherin+ after the second round of FACS was 100% for both mES and miPS-derived vascular progenies. Morphology of mES- and miPS-derived vascular ECs (G-J). Flk1+VE-cadherin+ vascular progenies derived from mES and miPS cells were cultured overnight in IV Col-coated dishes, immunostained with anti-VE-cadherin (green) and anti-CD31 (red) of cells derived from mES cells (G&H) and miPS cells (I&J). DAPI, nucleus (blue). Magnifications are as indicated; the scale bar is 200 µm. Experiments were repeated 3 times. Image collected and cropped by CiteAb from the following publication (https://dx.plos.org/10.1371/journal.pone.0085549), licensed under a CC-BY license. Not internally tested by R&D Systems.
Detection of Mouse VE-Cadherin by Flow Cytometry
FACS analysis of emerging vascular EC progenies from mES and iPS cells.Adherent cells (2x10⁵) were detached and subjected to two-step FACS-aided purification. Control FACS profile on day 5 of cells derived from mES (J1) cells (A). Representative FACS profiles of day 5, with vascular progenies assessed using anti-Flk1 and anti-VE-cadherin antibodies obtained from mES (J1) cells (B) and derived from miPS (iMZ-21) cells (C); Control FACS profile on day 5 of cells derived from miPS (iMZ-21) cells (D). Representative FACS after the second step of purification derived from mES (E) and iPS cells (F). The yield of Flk1+VE-cadherin+ after the second round of FACS was 100% for both mES and miPS-derived vascular progenies. Morphology of mES- and miPS-derived vascular ECs (G-J). Flk1+VE-cadherin+ vascular progenies derived from mES and miPS cells were cultured overnight in IV Col-coated dishes, immunostained with anti-VE-cadherin (green) and anti-CD31 (red) of cells derived from mES cells (G&H) and miPS cells (I&J). DAPI, nucleus (blue). Magnifications are as indicated; the scale bar is 200 µm. Experiments were repeated 3 times. Image collected and cropped by CiteAb from the following publication (https://dx.plos.org/10.1371/journal.pone.0085549), licensed under a CC-BY license. Not internally tested by R&D Systems.
Detection of Rat VE-Cadherin by Immunohistochemistry
Chronic intermittent hypoxia modifies the BM vascular structure. a’–e’ Representative images of femur bone marrow stained with vWF, CD105, VE-cadherin, SMA, and CD11b counterstained with hematoxylin. a”, c”, d” BM from CIH exposed rats (n = 6) has more VE-cadherin+ vessels and SMA coverage but less vWF+ sinusoids (400×, Leica DM2500). e’, e” Representative images of CD11b immunohistochemistry in femur BM show an increase in BM monocyte count in CIH exposed animals. (400×, Leica DM2500) a’, a”’, b’, b” No changes in the total number of vessels or in megakaryocyte count were observed, as accounted by CD105 and vWF staining, respectively. Results are represented as the mean ± SD of bone marrow sections from six male Wistar rats (*p < 0.05; **p < 0.01). f Representative images of femur bone marrow fluorescently immunostained for VE-cadherin show an increase in total VE-cadherin vessels and in VE-cadherin vessel coverage. Scale bar, 50 μm (insets magnified 2.5×). Images were acquired with a Zeiss LSM 510 META microscope Image collected and cropped by CiteAb from the following publication (https://pubmed.ncbi.nlm.nih.gov/26856724), licensed under a CC-BY license. Not internally tested by R&D Systems.
Detection of Mouse VE-Cadherin by Immunocytochemistry/Immunofluorescence
Resting skin vessels contain high density HS moieties preferentially expressed at their basolateral compartments.(A, C, E, F, G) Axial and longitudinal sections of vessels of (A, B) naïve frozen, or (C, D, E, F, G) paraffin embedded murine flank skin tissues. Tissues were stained for HS with monoclonal mouse IgM (10E4 epitope; red), goat anti mouse VE-cadherin (cyan), FITC-mouse monoclonal to alpha -SMA (green), and nuclei (blue). (H) HS and alpha -SMA profile of the fluorescence intensity along the purple arrow in the merged image. Double-headed black arrow denotes the vessel lumen as indicated by VE-cadherin. In C, D and G, small-headed arrows denote the endothelial apical side, large-headed arrows denote the endothelial basolateral side, and broken-line arrows denote the pericyte basolateral side. Images were taken at 100X magnification. Scale bar represents 5 µm. Image collected and cropped by CiteAb from the following publication (https://dx.plos.org/10.1371/journal.pone.0085699), licensed under a CC-BY license. Not internally tested by R&D Systems.
Detection of Mouse VE-Cadherin by Flow Cytometry
FACS analysis of emerging vascular EC progenies from mES and iPS cells.Adherent cells (2x10⁵) were detached and subjected to two-step FACS-aided purification. Control FACS profile on day 5 of cells derived from mES (J1) cells (A). Representative FACS profiles of day 5, with vascular progenies assessed using anti-Flk1 and anti-VE-cadherin antibodies obtained from mES (J1) cells (B) and derived from miPS (iMZ-21) cells (C); Control FACS profile on day 5 of cells derived from miPS (iMZ-21) cells (D). Representative FACS after the second step of purification derived from mES (E) and iPS cells (F). The yield of Flk1+VE-cadherin+ after the second round of FACS was 100% for both mES and miPS-derived vascular progenies. Morphology of mES- and miPS-derived vascular ECs (G-J). Flk1+VE-cadherin+ vascular progenies derived from mES and miPS cells were cultured overnight in IV Col-coated dishes, immunostained with anti-VE-cadherin (green) and anti-CD31 (red) of cells derived from mES cells (G&H) and miPS cells (I&J). DAPI, nucleus (blue). Magnifications are as indicated; the scale bar is 200 µm. Experiments were repeated 3 times. Image collected and cropped by CiteAb from the following publication (https://dx.plos.org/10.1371/journal.pone.0085549), licensed under a CC-BY license. Not internally tested by R&D Systems.
Detection of Mouse VE-Cadherin by Immunocytochemistry/Immunofluorescence
Resting skin vessels contain high density HS moieties preferentially expressed at their basolateral compartments.(A, C, E, F, G) Axial and longitudinal sections of vessels of (A, B) naïve frozen, or (C, D, E, F, G) paraffin embedded murine flank skin tissues. Tissues were stained for HS with monoclonal mouse IgM (10E4 epitope; red), goat anti mouse VE-cadherin (cyan), FITC-mouse monoclonal to alpha -SMA (green), and nuclei (blue). (H) HS and alpha -SMA profile of the fluorescence intensity along the purple arrow in the merged image. Double-headed black arrow denotes the vessel lumen as indicated by VE-cadherin. In C, D and G, small-headed arrows denote the endothelial apical side, large-headed arrows denote the endothelial basolateral side, and broken-line arrows denote the pericyte basolateral side. Images were taken at 100X magnification. Scale bar represents 5 µm. Image collected and cropped by CiteAb from the following publication (https://dx.plos.org/10.1371/journal.pone.0085699), licensed under a CC-BY license. Not internally tested by R&D Systems.
Detection of Mouse VE-Cadherin by Immunocytochemistry/Immunofluorescence
FACS analysis of emerging vascular EC progenies from mES and iPS cells.Adherent cells (2x10⁵) were detached and subjected to two-step FACS-aided purification. Control FACS profile on day 5 of cells derived from mES (J1) cells (A). Representative FACS profiles of day 5, with vascular progenies assessed using anti-Flk1 and anti-VE-cadherin antibodies obtained from mES (J1) cells (B) and derived from miPS (iMZ-21) cells (C); Control FACS profile on day 5 of cells derived from miPS (iMZ-21) cells (D). Representative FACS after the second step of purification derived from mES (E) and iPS cells (F). The yield of Flk1+VE-cadherin+ after the second round of FACS was 100% for both mES and miPS-derived vascular progenies. Morphology of mES- and miPS-derived vascular ECs (G-J). Flk1+VE-cadherin+ vascular progenies derived from mES and miPS cells were cultured overnight in IV Col-coated dishes, immunostained with anti-VE-cadherin (green) and anti-CD31 (red) of cells derived from mES cells (G&H) and miPS cells (I&J). DAPI, nucleus (blue). Magnifications are as indicated; the scale bar is 200 µm. Experiments were repeated 3 times. Image collected and cropped by CiteAb from the following publication (https://dx.plos.org/10.1371/journal.pone.0085549), licensed under a CC-BY license. Not internally tested by R&D Systems.
Detection of VE‑Cadherin in Mouse Heart.
Formalin-fixed paraffin-embedded tissue sections of mouse heart were probed for VE-Cadherin mRNA (ACD RNAScope Probe, catalog #312538; Fast Red chromogen, ACD catalog # 322750). Adjacent tissue section was processed for immunohistochemistry using goat anti-mouse VE-Cadherin polyclonal antibody (R&D Systems catalog # AF1002) at 3ug/mL with 1 hour incubation at room temperature followed by incubation with anti-goat IgG VisUCyte HRP Polymer Antibody (Catalog # VC004) and DAB chromogen (yellow-brown). Tissue was counterstained with hematoxylin (blue). Specific staining was localized to cardiac myocytes.
Detection of Mouse Mouse VE-Cadherin Antibody by Western Blot
Warfarin pretreatment enhances tumor Ad5ROBO4 vector expression.A. Multiorgan immunoblot of vehicle (left lanes) or warfarin (right lanes) pretreated Rag2−/− mice injected with 1.0×10¹¹ vp of Ad5ROBO4. B. Densitometry of A revealed that vehicle pretreatment was associated with robust liver, detectable splenic, and trace to undetectable expression in all other sampled organs. Warfarin pretreatment produced a 2.5-fold increased splenic and a 3-fold decreased liver expression while all other organs still evidenced trace to undetectable expression. C. Immunoblot and densitometry of liver and tumor EGFP, VE-cadherin, and beta -tubulin expression in vehicle (left lanes) or warfarin (right lanes) from the same pretreated, Ad5ROBO4-injected mice as in A and B. EGFP densitometry normalized to VE-cadherin, revealed a 4.7-fold decrease in liver and 2-fold increase in increase KO and SC tumor expression produced by warfarin pretreatment. A–C: representative immunoblots from n = 2 mice from 2 independent experiments. Image collected and cropped by CiteAb from the following publication (https://pubmed.ncbi.nlm.nih.gov/24376772), licensed under a CC-BY license. Not internally tested by R&D Systems.
Detection of Mouse Mouse VE-Cadherin Antibody by Western Blot
Semiquantitative immunoblotting reveals differential Ad5ROBO4 reporter expression in tumor compared to liver.A. Immunoblot of EGFP, VE-cadherin, and beta -tubulin loading controls in tissue protein extracts from hCAR:Rag2−/− mice injected with either Ad5ROBO4, left three lanes, or Ad5CMV, right three lanes. B. and C. Densitometry analysis of Ad5ROBO4 vector EGFP expression normalized to either VE-cadherin or beta -tubulin. D. Densitometry of AdCMV vector EGFP expression. As AdCMV expression was hepatocyte specific, this blot was only normalized to beta -tubulin. A–D: Representative immunoblots from n = 4 mice injected with either Ad5ROBO 4 or Ad5CMV vectors. Li: liver, KO: kidney orthotopic tumor, SC: subcutaneous tumor. Image collected and cropped by CiteAb from the following publication (https://pubmed.ncbi.nlm.nih.gov/24376772), licensed under a CC-BY license. Not internally tested by R&D Systems.
Detection of Mouse Mouse VE-Cadherin Antibody by Western Blot
Endogenous ROBO4 upregulation despite lower vascular density in orthotopic and xenograft tumors.A. Immunofluorescence of the vascular endothelium in liver (upper panel) and 786-O human renal cell carcinoma (RCC) subcutaneous xenograft tumor (lower panel). B. Vascular area analysis of liver (Li), kidney orthotopic (KO) tumors, and subcutaneous (SC) xenograft tumors (n = 6 mice analyzed). C. Immunoblot of endogenous ROBO4 and the endothelial cell specific VE-cadherin from liver, kidney orthotopic and subcutaneous xenograft 786-O RCC tumors, and from the derivative 786-O cells grown in culture. D. Densitometry analysis of VE-cadherin/tubulin ratio from C mirrors the vascular area determination in B. E. Densitometry analysis of endogenous ROBO4 normalized to VE-cadherin expression reveals a 1.4- to 2-fold increase in SC and KO tumors compared to liver. C–E: Immunoblot and densitometry was repeated twice with two independent sets of protein extracts from two different tumor-bearing mice with essentially the same results. A. Magnification: 100X, Red: endomucin/CD31 antibody cocktail, Blue: DAPI. B. *p<0.05, one way ANOVA with Tukey's correction, mean ± SD. Image collected and cropped by CiteAb from the following publication (https://pubmed.ncbi.nlm.nih.gov/24376772), licensed under a CC-BY license. Not internally tested by R&D Systems.
Detection of Mouse Mouse VE-Cadherin Antibody by Western Blot
Warfarin pretreatment enhances tumor Ad5ROBO4 vector expression.A. Multiorgan immunoblot of vehicle (left lanes) or warfarin (right lanes) pretreated Rag2−/− mice injected with 1.0×10¹¹ vp of Ad5ROBO4. B. Densitometry of A revealed that vehicle pretreatment was associated with robust liver, detectable splenic, and trace to undetectable expression in all other sampled organs. Warfarin pretreatment produced a 2.5-fold increased splenic and a 3-fold decreased liver expression while all other organs still evidenced trace to undetectable expression. C. Immunoblot and densitometry of liver and tumor EGFP, VE-cadherin, and beta -tubulin expression in vehicle (left lanes) or warfarin (right lanes) from the same pretreated, Ad5ROBO4-injected mice as in A and B. EGFP densitometry normalized to VE-cadherin, revealed a 4.7-fold decrease in liver and 2-fold increase in increase KO and SC tumor expression produced by warfarin pretreatment. A–C: representative immunoblots from n = 2 mice from 2 independent experiments. Image collected and cropped by CiteAb from the following publication (https://pubmed.ncbi.nlm.nih.gov/24376772), licensed under a CC-BY license. Not internally tested by R&D Systems.
Detection of Mouse VE-Cadherin by Immunohistochemistry
Deletion of VE-cadherin in CYP19A1(Tg)Cre; Cdh5fl/fl placentas.(A, B) Immunofluorescence staining and quantification of E12.5 Control and CYP19A1(Tg)Cre; Cdh5fl/fl placentas for VE-cadherin (green) and CK8 (red). Yellow arrowheads indicate VE-cadherin+ trophoblasts, which predominantly line remodeled spiral arteries. White arrowheads indicate VE-cadherin- trophoblasts. Red arrowheads indicate spiral artery endothelial cells (ECs), which are VE-cadherin+ CK8-. VE-cadherin and CK8 colocalized area was divided by total CK8-positive area to determine the extent of VE-cadherin deletion. Note that there are a few VE-cadherin+ trophoblasts in CYP19A1(Tg)Cre; Cdh5fl/fl placentas, however VE-cadherin is deleted from the majority of trophoblasts. The layer of VE-cadherin+ CK8- cells (red arrowheads) in the CYP19A1(Tg)Cre; Cdh5fl/fl placentas are spiral artery endothelial cells that have not been displaced by trophoblasts. Dotted white lines demarcate the decidua and junctional zone (JZ). Positive signal in small, rounded cells in the lumen is the result of erythrocyte autofluorescence. Control n = 4, CYP19A1(Tg)Cre; Cdh5fl/fl n = 3. Scale bars = 100 μm. (C, D) E12.5 placental and embryo weights do not differ between Cre-negative (Cdh5fl/+ or Cdh5fl/fl) and Cre-positive heterozygous (CYP19A1(Tg)Cre; Cdh5fl/fl) controls. Statistical analysis was performed using two-tailed, unpaired Welch’s t-test. Data are shown as means ± SD.Figure 1—figure supplement 1—source data 1.Excel file containing quantification for VE-cadherin expression in trophoblasts, embryo weights, and placenta weights in Figure 1—figure supplement 1.Excel file containing quantification for VE-cadherin expression in trophoblasts, embryo weights, and placenta weights in Figure 1—figure supplement 1. Image collected and cropped by CiteAb from the following open publication (https://pubmed.ncbi.nlm.nih.gov/35486098), licensed under a CC-BY license. Not internally tested by R&D Systems.
Detection of Mouse VE-Cadherin by Immunohistochemistry
VE-cadherin expression is retained in the vasculature of affected organs in CYP19A1(Tg)Cre; Cdh5fl/fl embryos.(A) Immunofluorescence staining of E12.5 Control and CYP19A1(Tg)Cre; Cdh5fl/fl brains for VE-cadherin (green) and Endomucin (red) at sites of hemorrhage. Images in gray scale are VE-cadherin alone. Red arrowheads point to extravascular autofluorescent erythrocytes. Yellow arrowheads point to VE-cadherin+ vessels. Scale bars = 50 μm. (B) Immunofluorescence staining of E12.5 Control and CYP19A1(Tg)Cre; Cdh5fl/fl hearts for VE-cadherin (green) and Endomucin (red). Images in gray scale are VE-cadherin alone. Red arrowheads point to VE-cadherin+ developing coronary vessels. Yellow arrowheads point to VE-cadherin+ endocardium. Scale bars = 50 μm. (C) Immunofluorescence staining of E12.5 Control and CYP19A1(Tg)Cre; Cdh5fl/fl hearts for VE-cadherin (green), Endomucin (red), and LYVE1 (gray). Images in gray scale represent VE-cadherin pixels colocalized with either LYVE1 (liver) or Endomucin (lungs and thorax). Red arrowheads point to LYVE1+VE-cadherin+ liver sinusoidal vessels. Yellow arrowheads point to Endomucin+VE-cadherin+ lung and thoracic blood vessels. Scale bars = 200 μm. (D) Quantification of fold change in VE-cadherin mean fluorescence intensity in the brain, heart, liver, lungs, and thorax.Figure 1—figure supplement 3—source data 1.Excel file containing quantification for VE-cadherin expression in various organs in Figure 1—figure supplement 3.Excel file containing quantification for VE-cadherin expression in various organs in Figure 1—figure supplement 3. Image collected and cropped by CiteAb from the following open publication (https://pubmed.ncbi.nlm.nih.gov/35486098), licensed under a CC-BY license. Not internally tested by R&D Systems.
Detection of Mouse VE-Cadherin by Immunohistochemistry
Microtubules (MT) are indispensable for VEGF-induced cell elongation. a Confluent HUVECs immune labelled for VE-cadherin, alpha -tubulin and Phalloidin-TRITC after VEGF treatment for 24 h or PBS for control, as indicated. Nuclei are stained blue with DAPI. LSM demonstrates MT in control cells evenly distributed throughout the cells, while a few MT are aligned in parallel with JAAF (red arrows). VEGF-induced elongated cells display MT running parallel to the longitudinal cell axis together with stress fibres, and MT are enriched at the leading edge (white arrows; for dynamics compare supplementary Movie 10) (Scale bar: 20 µm). The cropped area displays an interrupted VE-cadherin pattern, MT enrichment, and stress fibres at the cell poles (arrowheads; for dynamics compare Supplementary Movies 10 and 11) (scale bar: 10 µm). b Confluent HUVEC cultures treated with 50 ng ml−1 nocodazole for 4 h and subsequently labelled with VE-cadherin antibody and with Phallodin-TRITC for actin filaments. MT depolymerisation had less effect on the JAAF and VE-cadherin distribution (Scale bar: 20 µm). c–e Confluent HUVECs pre-treated with 50 ng ml−1 nocodazole for 30 min and then treated with VEGF for another 18 h. c Phase-contrast microscopy revealed that nocodazole inhibited VEGF-induced cell elongation (scale bar: 80 µm). Quantification of (d) cell velocity and (e) cell elongation using Fiji software (100 cells were analysed at t = 0, 100 cells at t = 9 h, 81 cells at t = 18 h for nocodazole+VEGF treatment; and 100 cells were analysed at each time point for VEGF treatment, unpaired student’s t test). noco: nocodazole. Representative results from three independent experiments are shown. Error bars indicate ± SEM Image collected and cropped by CiteAb from the following open publication (https://pubmed.ncbi.nlm.nih.gov/29263363), licensed under a CC-BY license. Not internally tested by R&D Systems.
Detection of Mouse VE-Cadherin by Immunohistochemistry
VE-cadherin expression is retained in the vasculature of affected organs in CYP19A1(Tg)Cre; Cdh5fl/fl embryos.(A) Immunofluorescence staining of E12.5 Control and CYP19A1(Tg)Cre; Cdh5fl/fl brains for VE-cadherin (green) and Endomucin (red) at sites of hemorrhage. Images in gray scale are VE-cadherin alone. Red arrowheads point to extravascular autofluorescent erythrocytes. Yellow arrowheads point to VE-cadherin+ vessels. Scale bars = 50 μm. (B) Immunofluorescence staining of E12.5 Control and CYP19A1(Tg)Cre; Cdh5fl/fl hearts for VE-cadherin (green) and Endomucin (red). Images in gray scale are VE-cadherin alone. Red arrowheads point to VE-cadherin+ developing coronary vessels. Yellow arrowheads point to VE-cadherin+ endocardium. Scale bars = 50 μm. (C) Immunofluorescence staining of E12.5 Control and CYP19A1(Tg)Cre; Cdh5fl/fl hearts for VE-cadherin (green), Endomucin (red), and LYVE1 (gray). Images in gray scale represent VE-cadherin pixels colocalized with either LYVE1 (liver) or Endomucin (lungs and thorax). Red arrowheads point to LYVE1+VE-cadherin+ liver sinusoidal vessels. Yellow arrowheads point to Endomucin+VE-cadherin+ lung and thoracic blood vessels. Scale bars = 200 μm. (D) Quantification of fold change in VE-cadherin mean fluorescence intensity in the brain, heart, liver, lungs, and thorax.Figure 1—figure supplement 3—source data 1.Excel file containing quantification for VE-cadherin expression in various organs in Figure 1—figure supplement 3.Excel file containing quantification for VE-cadherin expression in various organs in Figure 1—figure supplement 3. Image collected and cropped by CiteAb from the following open publication (https://pubmed.ncbi.nlm.nih.gov/35486098), licensed under a CC-BY license. Not internally tested by R&D Systems.
Detection of Mouse VE-Cadherin by Immunohistochemistry
Polarized distribution of VE-cadherin and actin in sprouting ECs in developing mice retinas. a Laser scanning microscopy (LSM) showing an overview of the front area of a whole-mounted P6 transgenic mouse retina expressing LifeAct-EGFP additionally immune stained with anti-VE-cadherin and anti-ERG antibodies; nuclei were stained with anti-ERG. Tip cell (arrowheads) and adjacent stalk cell (arrows) are indicated. Scale bar: 40 µm. b High-resolution SIM of selected areas 1–3, as indicated in the right panel of a. Shown is one z-plane. (Area 1) a characteristic tip cell with large actin-based filopodia and a cytosolic spotted VE-cadherin pattern. (Area 2) A tip cell/stalk cell junction at the cell pole of elongated cells identifies terminating actin filaments (arrow) and an interrupted VE-cadherin pattern (arrowhead). (Area 3) a stalk cell/stalk cell connection. VE-cadherin plaques are indicated at the cell poles (arrowheads) and a linear VE-cadherin pattern (empty arrowhead) at lateral junctions; parallel actin filaments are also visible. Scale bar: 5 µm. (Area 4) The cropped area depicts an actin-positive JAIL (dotted line, LifeAct-EGFP) with VE-cadherin plaques (dotted line, VE-cadherin staining). Scale bar: 2 µm. c P7 rat retina immune labelled with ARPC2 and VE-cadherin show increased ARPC2 at the cell poles (arrows). Scale bars in the left panels and right panels represent 50 and 15 µm, respectively. d Scheme illustrates the iterative dynamics of VE-cadherin interruption and JAIL formation leading to VE-cadherin plaques in sprouting ECs. The VE-cadherin dynamics was particularly pronounced at the cell poles, while the lateral junctions showed moderate dynamics Image collected and cropped by CiteAb from the following open publication (https://pubmed.ncbi.nlm.nih.gov/29263363), licensed under a CC-BY license. Not internally tested by R&D Systems.
Detection of Mouse VE-Cadherin by Immunohistochemistry
JAIL formation&cell migration are blocked by Rac inhibition&VE-cadherin overexpression in scratch assay. a–f HUVECs scratched, allowed to grow for 5 h,&labelled for VE-cadherin&Phalloidin-TRITC. a Overviews of the migrating front (left upper)¢re area (left lower). (Area 1) interrupted VE-cadherin that co-localise with filopodia-like actin filaments (arrows). (Area 2) Large JAIL (arrowheads) at cell pole. (Area 3) small JAIL (arrowheads) at lateral junctions. (Area 4) Polygonal cells in the centre area. Scale bars represent 60 µm&15 µm in the overview&cropped images respectively. b, c Comparison of cell perimeter&Rel-VEcad-C in front¢re ECs. Quantification of (d) JAIL number&(e) JAIL size in front (n = 115 cells)¢re cells (n = 186 cells). f JAIL size at cell poles&lateral junctions in front ECs (n = 115 cells). P value was determined by unpaired student’s t test. Image collected & cropped by CiteAb from the following open publication (https://pubmed.ncbi.nlm.nih.gov/29263363), licensed under a CC-BY license. Not internally tested by R&D Systems.
Detection of Mouse VE-Cadherin by Immunohistochemistry
Polarized JAIL dynamics during sprouting angiogenesis in fibrin angiogenesis assay using EGFP-p20 expressing HUVECs.f Overview&Z-projections of vessel sprouts in fibrin angiogenesis assays 5 days after seeding; cells fixed&labelled with Phalloidin-TRITC&VE-cadherin. (cropped areas) JAIL are indicated at cell poles by the appearance of large VE-cadherin plaques (arrows) that co-localise with the actin network (arrows), whereas small VE-cadherin plaques appear at lateral junctions (arrowhead). Error bars represent ± SEM; scale bars indicate 50&10 µm in the overview&cropped areas, respectively Image collected & cropped by CiteAb from the following open publication (https://pubmed.ncbi.nlm.nih.gov/29263363), licensed under a CC-BY license. Not internally tested by R&D Systems.
Detection of Mouse VE-Cadherin by Immunohistochemistry
Polarized distribution of VE-cadherin and actin in sprouting ECs in developing mice retinas. a Laser scanning microscopy (LSM) showing an overview of the front area of a whole-mounted P6 transgenic mouse retina expressing LifeAct-EGFP additionally immune stained with anti-VE-cadherin and anti-ERG antibodies; nuclei were stained with anti-ERG. Tip cell (arrowheads) and adjacent stalk cell (arrows) are indicated. Scale bar: 40 µm. b High-resolution SIM of selected areas 1–3, as indicated in the right panel of a. Shown is one z-plane. (Area 1) a characteristic tip cell with large actin-based filopodia and a cytosolic spotted VE-cadherin pattern. (Area 2) A tip cell/stalk cell junction at the cell pole of elongated cells identifies terminating actin filaments (arrow) and an interrupted VE-cadherin pattern (arrowhead). (Area 3) a stalk cell/stalk cell connection. VE-cadherin plaques are indicated at the cell poles (arrowheads) and a linear VE-cadherin pattern (empty arrowhead) at lateral junctions; parallel actin filaments are also visible. Scale bar: 5 µm. (Area 4) The cropped area depicts an actin-positive JAIL (dotted line, LifeAct-EGFP) with VE-cadherin plaques (dotted line, VE-cadherin staining). Scale bar: 2 µm. c P7 rat retina immune labelled with ARPC2 and VE-cadherin show increased ARPC2 at the cell poles (arrows). Scale bars in the left panels and right panels represent 50 and 15 µm, respectively. d Scheme illustrates the iterative dynamics of VE-cadherin interruption and JAIL formation leading to VE-cadherin plaques in sprouting ECs. The VE-cadherin dynamics was particularly pronounced at the cell poles, while the lateral junctions showed moderate dynamics Image collected and cropped by CiteAb from the following open publication (https://pubmed.ncbi.nlm.nih.gov/29263363), licensed under a CC-BY license. Not internally tested by R&D Systems.
Detection of Mouse VE-Cadherin by Western Blot
Acquisition of endothelial markers upon trophoblast differentiation is associated with down-regulation in Hes1.(A) Western blot analysis for HES1 and endothelial cell–specific proteins CDH5, PECAM1, and ENG using cell lysates from TS and TC. (A, B) Densitometric analysis of the proteins from blots in (A) using NIH ImageJ software after normalization with GAPDH. (C) Quantitative real-time PCR of Hes1 using RNA from TS cells transfected with either scrambled or Hes1 siRNA. (D, E) Quantitative real-time PCR of Cdh5 (D) and endoglin (E) using RNA from TS cells transfected with either scrambled or Hes1 siRNA. (F) Western blot analysis of HES1, CDH5, PECAM1, and ENG using cell lysates from TS cells transfected with either 100 nM scrambled or Hes1 siRNA followed by induction of differentiation till day 2. (F, G) Densitometric analysis of the proteins from (F) using NIH ImageJ software after normalization with GAPDH. Data are representative of three independent biological replicates. Error bars represent SEM. *P < 0.5, **P < 0.01.Source data are available for this figure. Image collected and cropped by CiteAb from the following open publication (https://pubmed.ncbi.nlm.nih.gov/36574992), licensed under a CC-BY license. Not internally tested by R&D Systems.
Detection of Mouse VE-Cadherin by Western Blot
Acquisition of endothelial markers upon trophoblast differentiation is associated with down-regulation in Hes1.(A) Western blot analysis for HES1 and endothelial cell–specific proteins CDH5, PECAM1, and ENG using cell lysates from TS and TC. (A, B) Densitometric analysis of the proteins from blots in (A) using NIH ImageJ software after normalization with GAPDH. (C) Quantitative real-time PCR of Hes1 using RNA from TS cells transfected with either scrambled or Hes1 siRNA. (D, E) Quantitative real-time PCR of Cdh5 (D) and endoglin (E) using RNA from TS cells transfected with either scrambled or Hes1 siRNA. (F) Western blot analysis of HES1, CDH5, PECAM1, and ENG using cell lysates from TS cells transfected with either 100 nM scrambled or Hes1 siRNA followed by induction of differentiation till day 2. (F, G) Densitometric analysis of the proteins from (F) using NIH ImageJ software after normalization with GAPDH. Data are representative of three independent biological replicates. Error bars represent SEM. *P < 0.5, **P < 0.01.Source data are available for this figure. Image collected and cropped by CiteAb from the following open publication (https://pubmed.ncbi.nlm.nih.gov/36574992), licensed under a CC-BY license. Not internally tested by R&D Systems.Applications for Mouse VE-Cadherin Antibody
Application
Recommended Usage
Dual RNAscope ISH-IHC Compatible
5-15 µg/mL
Sample: Immersion fixed paraffin-embedded sections of mouse heart
Sample: Immersion fixed paraffin-embedded sections of mouse heart
Immunohistochemistry
3-25 µg/mL
Sample: Immersion fixed paraffin-embedded sections of mouse heart
Sample: Immersion fixed paraffin-embedded sections of mouse heart
Simple Western
10 µg/mL
Sample: Mouse lung tissue
Sample: Mouse lung tissue
Western Blot
0.2 µg/mL
Sample: Mouse lung tissue and bEnd.3 mouse endothelioma cell line
Sample: Mouse lung tissue and bEnd.3 mouse endothelioma cell line
Reviewed Applications
Read 4 reviews rated 4.3 using AF1002 in the following applications:
Formulation, Preparation, and Storage
Purification
Antigen Affinity-purified
Reconstitution
Reconstitute at 0.2 mg/mL in sterile PBS. For liquid material, refer to CoA for concentration.
Loading...
Formulation
Lyophilized from a 0.2 μm filtered solution in PBS with Trehalose. See Certificate of Analysis for details.
*Small pack size (-SP) is supplied either lyophilized or as a 0.2 µm filtered solution in PBS.
*Small pack size (-SP) is supplied either lyophilized or as a 0.2 µm filtered solution in PBS.
Shipping
Lyophilized product is shipped at ambient temperature. Liquid small pack size (-SP) is shipped with polar packs. Upon receipt, store immediately at the temperature recommended below.
Stability & Storage
Use a manual defrost freezer and avoid repeated freeze-thaw cycles.
- 12 months from date of receipt, -20 to -70 °C as supplied.
- 1 month, 2 to 8 °C under sterile conditions after reconstitution.
- 6 months, -20 to -70 °C under sterile conditions after reconstitution.
Calculators
Background: VE-Cadherin
References
- Patel, S.D. et al. (2007) Curr. Opin. Struct. Biol. 13:690.
- Vestweber, D. (2008) Arterioscler. Thromb. Vasc. Biol. 28:223.
- Vincent, P.A. et al. (2004) Am. J. Physiol. Cell. Physiol. 286:C987.
- Cavallaro, U. et al. (2006) Exp. Cell Res. 312:659.
- Breier, G. et al. (1996) Blood 87:630.
- Huber, P. et al. (1996) Genomics 32:21.
- Pokutta, S. and W.I. Weis (2007) Annu. Rev. Cell Dev. Biol. 23:237.
- Crosby, C.V. et al. (2005) Blood 105:2771.
- Gavard, J. and J.S. Gutkind (2006) Nat. Cell Biol. 8:1223.
- Calera, M.R. et al. (2004) Exp. Cell Res. 300:248.
- Hewat, E.A. et al. (2007) J. Mol. Biol. 365:744.
- Rudini, N. et al. (2008) EMBO J. 27:993.
- Kogata, N. et al. (2006) Circ. Res. 98:897.
- Ema, M. et al. (2006) Blood 108:4018.
Long Name
Vascular Endothelium Cadherin
Alternate Names
Cadherin-5, CD144, CDH5, VECadherin
Gene Symbol
CDH5
UniProt
Additional VE-Cadherin Products
Product Documents for Mouse VE-Cadherin Antibody
Certificate of Analysis
To download a Certificate of Analysis, please enter a lot or batch number in the search box below.
Note: Certificate of Analysis not available for kit components.
Product Specific Notices for Mouse VE-Cadherin Antibody
For research use only
Citations for Mouse VE-Cadherin Antibody
 Powered by Bioz
Customer Reviews for Mouse VE-Cadherin Antibody (4)
4.3 out of 5
4 Customer Ratings
Have you used Mouse VE-Cadherin Antibody?
Submit a review and receive an Amazon gift card!
$25/€18/£15/$25CAN/¥2500 Yen for a review with an image
$10/€7/£6/$10CAN/¥1110 Yen for a review without an image
Submit a review
Customer Images
Showing
1
-
4 of
4 reviews
Showing All
Filter By:
-
Application: ImmunohistochemistrySample Tested: Skin tissueSpecies: MouseVerified Customer | Posted 08/13/2021

-
Application: Immunofluorescence-frozen sectionsSample Tested: Embryonic brainSpecies: MouseVerified Customer | Posted 04/28/2020VE-Cadherin stained blood vessels- specific signal (AF488) is seen at the vessel extremities. artefacts are seen but can be easily distinguished from the main signalTissue sections were thawed and blocked in 10% NDS in PBST for 2 hours. Primary ( 4degrees Overnight ) and secondary (2 hours at RT) were prepared in the same blocking buffer.
-
Application: Immunohistochemistry-FrozenSample Tested: MouseSpecies: MouseVerified Customer | Posted 03/12/2015VE- Cadherin stain on mouse heart tissue
-
Application: Western BlotSample Tested: ProteinSpecies: MouseVerified Customer | Posted 02/25/2015Cleavage assay samples probed with primary anti-mouse VE-Cadherin antibody (Novus bio, AF1002, 1/1000 dilution)
There are no reviews that match your criteria.
Protocols
Find general support by application which include: protocols, troubleshooting, illustrated assays, videos and webinars.
- Antigen Retrieval Protocol (PIER)
- Antigen Retrieval for Frozen Sections Protocol
- Appropriate Fixation of IHC/ICC Samples
- Cellular Response to Hypoxia Protocols
- Chromogenic IHC Staining of Formalin-Fixed Paraffin-Embedded (FFPE) Tissue Protocol
- Chromogenic Immunohistochemistry Staining of Frozen Tissue
- ClariTSA™ Fluorophore Kits
- Detection & Visualization of Antibody Binding
- Fluorescent IHC Staining of Frozen Tissue Protocol
- Graphic Protocol for Heat-induced Epitope Retrieval
- Graphic Protocol for the Preparation and Fluorescent IHC Staining of Frozen Tissue Sections
- Graphic Protocol for the Preparation and Fluorescent IHC Staining of Paraffin-embedded Tissue Sections
- Graphic Protocol for the Preparation of Gelatin-coated Slides for Histological Tissue Sections
- IHC Sample Preparation (Frozen sections vs Paraffin)
- ISH-IHC Protocol for Chromogenic Detection on Formalin Fixed Paraffin Embedded (FFPE) Tissue
- Immunofluorescent IHC Staining of Formalin-Fixed Paraffin-Embedded (FFPE) Tissue Protocol
- Immunohistochemistry (IHC) and Immunocytochemistry (ICC) Protocols
- Immunohistochemistry Frozen Troubleshooting
- Immunohistochemistry Paraffin Troubleshooting
- Preparing Samples for IHC/ICC Experiments
- Preventing Non-Specific Staining (Non-Specific Binding)
- Primary Antibody Selection & Optimization
- Protocol for Heat-Induced Epitope Retrieval (HIER)
- Protocol for Making a 4% Formaldehyde Solution in PBS
- Protocol for VisUCyte™ HRP Polymer Detection Reagent
- Protocol for the Preparation & Fixation of Cells on Coverslips
- Protocol for the Preparation and Chromogenic IHC Staining of Frozen Tissue Sections
- Protocol for the Preparation and Chromogenic IHC Staining of Frozen Tissue Sections - Graphic
- Protocol for the Preparation and Chromogenic IHC Staining of Paraffin-embedded Tissue Sections
- Protocol for the Preparation and Chromogenic IHC Staining of Paraffin-embedded Tissue Sections - Graphic
- Protocol for the Preparation and Fluorescent IHC Staining of Frozen Tissue Sections
- Protocol for the Preparation and Fluorescent IHC Staining of Paraffin-embedded Tissue Sections
- Protocol for the Preparation of Gelatin-coated Slides for Histological Tissue Sections
- R&D Systems Quality Control Western Blot Protocol
- TUNEL and Active Caspase-3 Detection by IHC/ICC Protocol
- The Importance of IHC/ICC Controls
- Troubleshooting Guide: Immunohistochemistry
- Troubleshooting Guide: Western Blot Figures
- Western Blot Conditions
- Western Blot Protocol
- Western Blot Protocol for Cell Lysates
- Western Blot Troubleshooting
- Western Blot Troubleshooting Guide
- View all Protocols, Troubleshooting, Illustrated assays and Webinars
Loading...
Associated Pathways


Blood-Brain Barrier Pathway: Anatomy
 Mesenchymal Stem Cell Differentiation Pathways & Lineage-specific Markers
 VEGF - VEGF R2 Signaling Pathways
