
phospho-ERK1/ERK2 (ERK1 T202/Y204, ERK2 T185/Y187) Antibody
R&D Systems | Catalog # AF1018

Scientific images may be resized, cropped, or adjusted for brightness or contrast for presentation purposes. These updates are limited to presentation and do not affect the underlying scientific interpretation of the data. Where available, additional source data may be provided upon request.
Key Product Details
Validated by
Species Reactivity
Validated:
Cited:
Applications
Validated:
Cited:
Label
Antibody Source
Product Specifications
Immunogen
Specificity
Clonality
Host
Isotype
Scientific Data Images for phospho-ERK1/ERK2 (ERK1 T202/Y204, ERK2 T185/Y187) Antibody
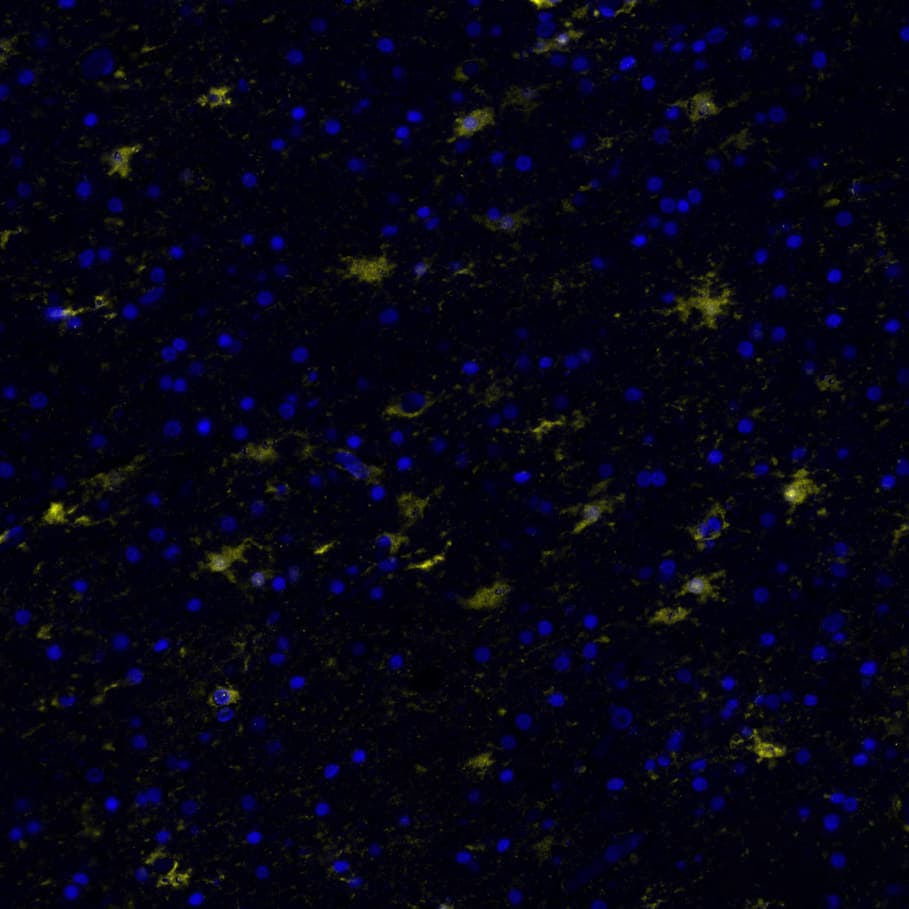
Detection of Phospho-ERK1 (T202/Y204)/ERK2 (T185/Y187) in Human Brain Cortex via seqIF™ staining on COMET™
Phospho-ERK1 (T202/Y204)/ERK2 (T185/Y187) was detected in immersion fixed paraffin-embedded sections of human Cortex using Rabbit Anti-Human Phospho-ERK1 (T202/Y204)/ERK2 (T185/Y187), Polyclonal Antibody (Catalog #AF1018) at 25ug/mL at 37 ° Celsius for 8 minutes. Before incubation with the primary antibody, tissue underwent an all-in-one dewaxing and antigen retrieval preprocessing using PreTreatment Module (PT Module) and Dewax and HIER Buffer H (pH 9; Epredia Catalog # TA-999-DHBH). Tissue was stained using the Alexa Fluor™ Plus 647 Goat anti-Rabbit IgG Secondary Antibody at 1:200 at 37 ° Celsius for 2 minutes. (Yellow; Lunaphore Catalog # DR647RB) and counterstained with DAPI (blue; Lunaphore Catalog # DR100). Specific staining was localized to the cytoplasm and nucleus of the neuron. Protocol available in COMET™ Panel Builder.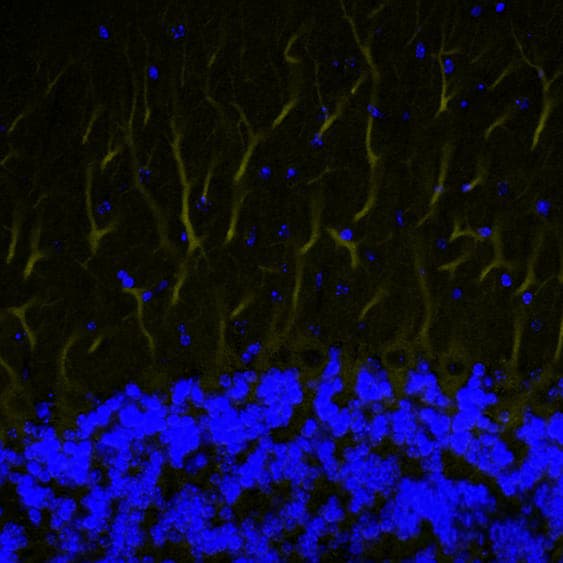
Detection of Phospho-ERK1 (T202/Y204)/ERK2 (T185/Y187) in Mouse Cerebellum via seqIF™ staining on COMET™
Phospho-ERK1 (T202/Y204)/ERK2 (T185/Y187) was detected in immersion fixed paraffin-embedded sections of mouse Cerebellum using Rabbit Anti-Mouse Phospho-ERK1 (T202/Y204)/ERK2 (T185/Y187), Polyclonal Antibody (Catalog #AF1018) at 25ug/mL at 37° Celsius for 4 minutes. Before incubation with the primary antibody, tissue underwent an all-in-one dewaxing and antigen retrieval preprocessing using PreTreatment Module (PT Module) and Dewax and HIER Buffer H (pH 9; Epredia Catalog # TA-999-DHBH). Tissue was stained using the Alexa Fluor™ Plus 555 Goat anti-Rabbit IgG Secondary Antibody at 1:100 at 37 ° Celsius for 2 minutes. (Yellow; Lunaphore Catalog # DR555RB) and counterstained with DAPI (blue; Lunaphore Catalog # DR100). Specific staining was localized to the cytoplasm of the neuronal processes. Protocol available in COMET™ Panel Builder.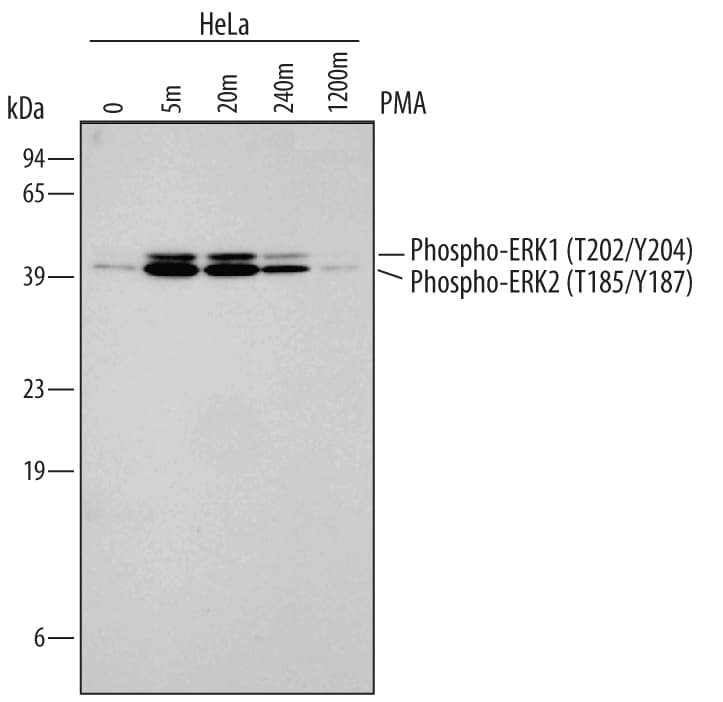
Detection of Human Phospho-ERK1 (T202/Y204) and ERK2 (T185/Y187) by Western Blot.
Western blot shows lysates of HeLa human cervical epithelial carcinoma cell line untreated (-) or treated (+) with 200 nM PMA for for the indicated times. PVDF membrane was probed with 0.1 µg/mL of Rabbit Anti-Human/Mouse/Rat Phospho-ERK1 (T202/Y204)/ERK2 (T185/Y187) Antigen Affinity-purified Polyclonal Antibody (Catalog # AF1018), followed by HRP-conjugated Anti-Rabbit IgG Secondary Antibody (Catalog # HAF008). Specific bands were detected for Phospho-ERK1 (T202/Y204) and ERK2 (T185/Y187) at approximately 42 and 44 kDa (as indicated). This experiment was conducted under reducing conditions and using Immunoblot Buffer Group 1.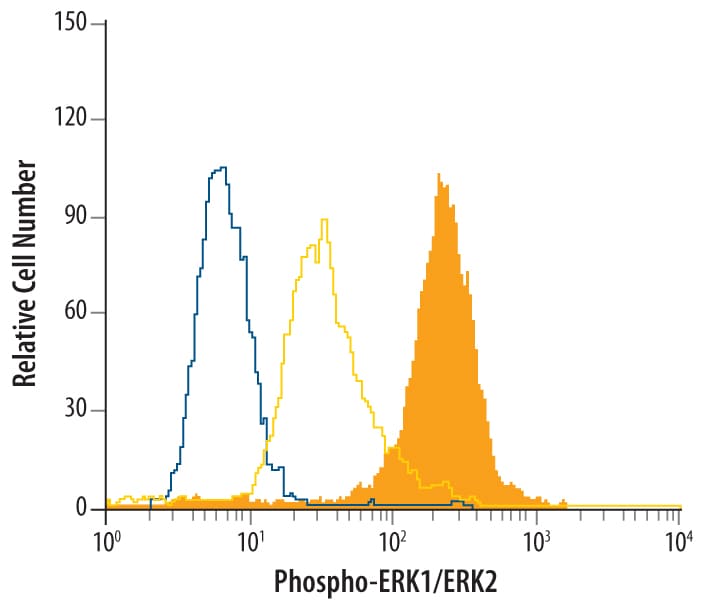
Detection of Phospho-ERK1/ERK2 in Jurkat Human Cell Line by Flow Cytometry.
Jurkat human acute T cell leukemia cell line were untreated (yellow line open histogram) or treated with 200 ng/mL PMA for 15 minutes (filled histogram) and stained with Rabbit Anti-Human/Mouse/Rat Phospho-ERK1/ERK2 (ERK1 T202/Y204, ERK2 T185/Y187) Antigen Affinity-purified Polyclonal Antibody (Catalog # AF1018) or control antibody (Catalog # AB-105-C, blue line open histogram), followed by Fluorescein-conjugated Anti-Rabbit IgG Secondary Antibody (Catalog # F0112). To facilitate intracellular staining, cells were fixed with PFA and permeabilized with ice-cold methanol.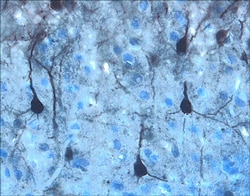
ERK1/ERK2 in Rat Brain.
ERK1/ERK2 was detected in perfusion fixed frozen sections of rat brain (cortex) using 15 µg/mL Rabbit Anti-Human/Mouse/Rat Phospho-ERK1/ERK2 (ERK1 T202/Y204, ERK2 T185/Y187) Antigen Affinity-purified Polyclonal Antibody (Catalog # AF1018) overnight at 4 °C. Tissue was stained with the Anti-Rabbit HRP-DAB Cell & Tissue Staining Kit (brown; Catalog # CTS005) and counterstained with hematoxylin (blue). View our protocol for Chromogenic IHC Staining of Frozen Tissue Sections.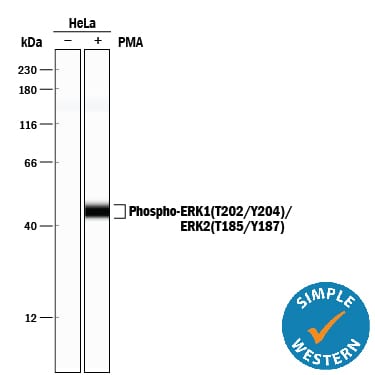
Detection of Human Phospho-ERK1 (T202/Y204)/ERK2 (T185/Y187) by Simple WesternTM.
Simple Western lane view shows lysates of HeLa human cervical epithelial carcinoma cell line untreated (-) or treated (+) with PMA, loaded at 0.2 mg/mL. A specific band was detected for ERK1 (T202/Y204)/ERK2 (T185/Y187) at approximately 44 kDa (as indicated) using 5 µg/mL of Rabbit Anti-Human/Mouse/Rat Phospho-ERK1 (T202/Y204)/ERK2 (T185/Y187) Antigen Affinity-purified Polyclonal Antibody (Catalog # AF1018). This experiment was conducted under reducing conditions and using the 12-230 kDa separation system.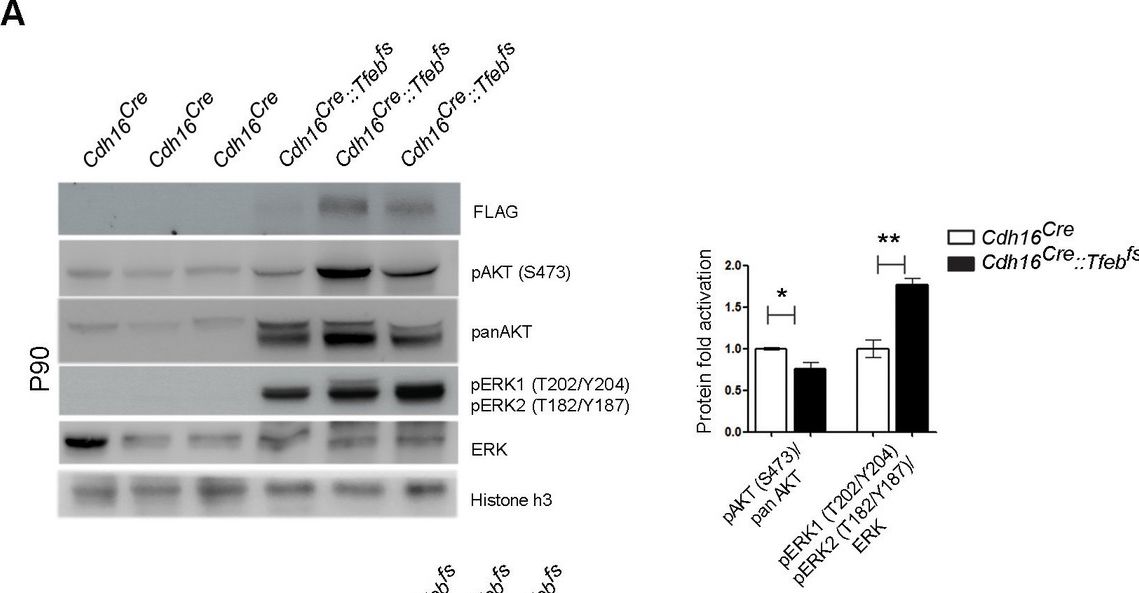
Detection of Mouse ERK1/ERK2 by Western Blot
Biochemical analysis of ErbB signaling.Immunoblot analysis performed on P90 kidneys from Cdh16Cre::Tfebfs mice (A) and P90 Cdh16CreErt2::Tfebfs animals induced with tamoxifen at P14 (B) and at P30 (C), respectively. Each replicate is a different biological sample. ErbB was analyzed by quantifying phosphoAKT (Ser473) to total AKT, and phosphoERK1 (T202/Y204)/ERK2(T185/Y187) to total ERK; graphs are the densitometry quantifications of Western blot bands normalized to wild-type line and are shown as an average (± SEM) (*p<0.05, **p<0.01, ***p<0.001, two-sided Student’s t test).DOI:https://dx.doi.org/10.7554/eLife.17047.011 Image collected and cropped by CiteAb from the following publication (https://elifesciences.org/articles/17047), licensed under a CC-BY license. Not internally tested by R&D Systems.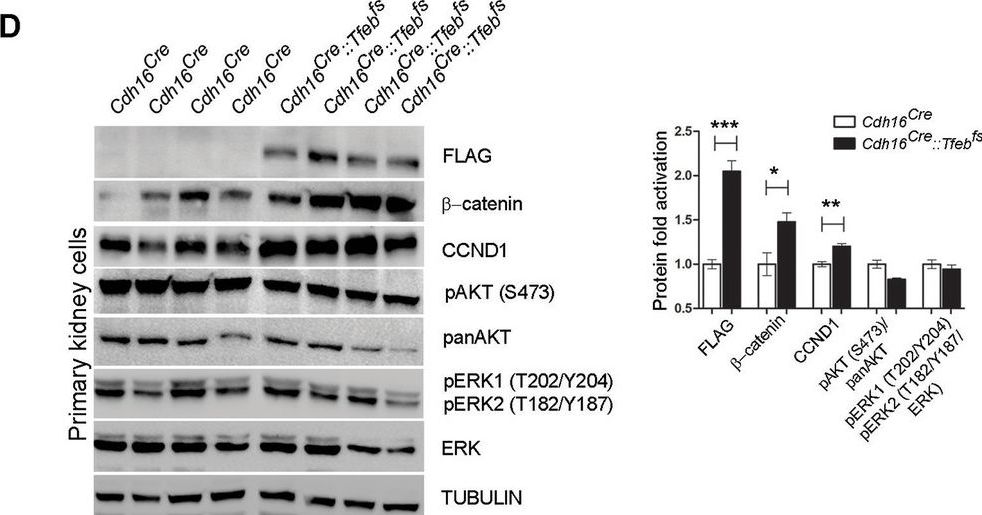
Detection of Mouse ERK1/ERK2 by Western Blot
Activation of ErbB and WNT signaling pathways in kidneys from Cdh16Cre::Tfebfs mice.Transcriptional and biochemical analyses were performed on Cdh16Cre and Cdh16Cre::Tfebfs mice. (A,B) Tables show the relative increase of genes related to the ErbB (A) and WNT (B) pathways in the microarray analyses performed on kidneys from P0 Cdh16Cre::Tfebfs mice. Graphs show real-time PCR validations performed on kidneys from Cdh16Cre::Tfebfs mice at different stages (P0, P12, P30). Data are shown as the average (± SEM) of at least three Cdh16Cre::Tfebfs mice normalized versus wild-type mice. (C,D) Immunoblot analyses performed on (C) P30 kidney tissues and (D) primary kidney cells isolated from Cdh16Cre::Tfebfs mice to evaluate ErbB and WNT activation status. Each replicate is a distinct biological sample. ErbB signaling was assessed by looking at phosphoAKT (Ser473) to total AKT ratio, and phosphoERK1 (T202/Y204)/ERK2(T185/Y187) to total ERK ratio; WNT signaling was assessed by quantifying beta -catenin and CCND1 (Cyclin D1) protein levels. Graphs represent the densitometry quantification of Western blot bands. Values are normalized to actin when not specified and are shown as an average (± SEM) (*p<0.05, **p<0.01, ***p<0.001, two-sided, Student’s t test).DOI:https://dx.doi.org/10.7554/eLife.17047.00710.7554/eLife.17047.008Figure 3—source data 1.Complete list of 294 genes (represented by 361 probesets) significantly induced (FDR≤0.05) in the KSP_P0 microarray dataset (GSE62977).The genes are ranked by decreasing signed ratio (KSP_P0/CTL).DOI:https://dx.doi.org/10.7554/eLife.17047.00810.7554/eLife.17047.009Figure 3—source data 2.Complete list of 628 genes (represented by 729 probesets) significantly induced (FDR≤0.05) in the KSP_P14 microarray dataset (GSE63376).The genes are ranked by decreasing signed ratio (KSP_P14/CTL).DOI:https://dx.doi.org/10.7554/eLife.17047.009Complete list of 294 genes (represented by 361 probesets) significantly induced (FDR≤0.05) in the KSP_P0 microarray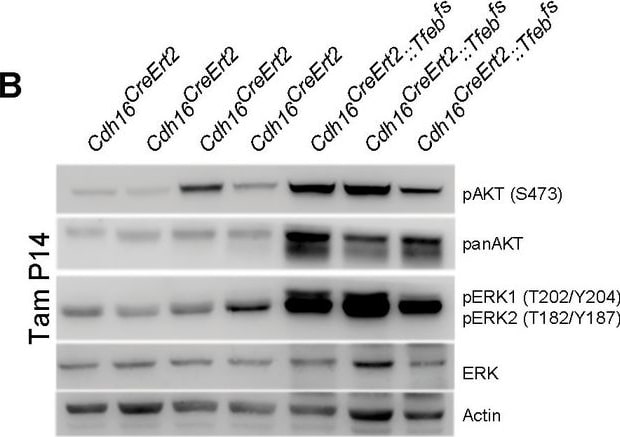
Detection of Mouse ERK1/ERK2 by Western Blot
Biochemical analysis of ErbB signaling.Immunoblot analysis performed on P90 kidneys from Cdh16Cre::Tfebfs mice (A) and P90 Cdh16CreErt2::Tfebfs animals induced with tamoxifen at P14 (B) and at P30 (C), respectively. Each replicate is a different biological sample. ErbB was analyzed by quantifying phosphoAKT (Ser473) to total AKT, and phosphoERK1 (T202/Y204)/ERK2(T185/Y187) to total ERK; graphs are the densitometry quantifications of Western blot bands normalized to wild-type line and are shown as an average (± SEM) (*p<0.05, **p<0.01, ***p<0.001, two-sided Student’s t test).DOI:https://dx.doi.org/10.7554/eLife.17047.011 Image collected and cropped by CiteAb from the following publication (https://elifesciences.org/articles/17047), licensed under a CC-BY license. Not internally tested by R&D Systems.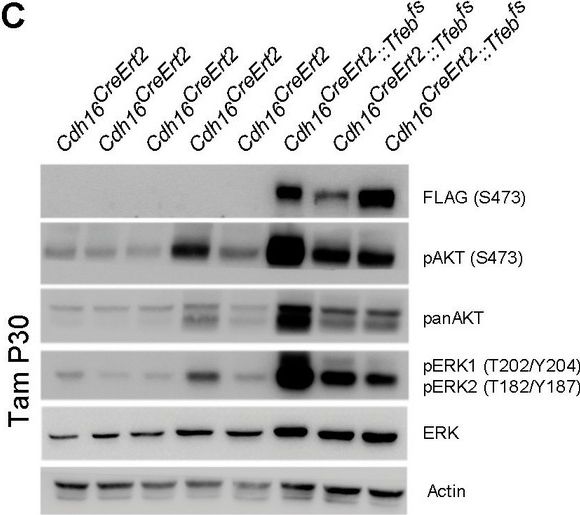
Detection of Mouse ERK1/ERK2 by Western Blot
Biochemical analysis of ErbB signaling.Immunoblot analysis performed on P90 kidneys from Cdh16Cre::Tfebfs mice (A) and P90 Cdh16CreErt2::Tfebfs animals induced with tamoxifen at P14 (B) and at P30 (C), respectively. Each replicate is a different biological sample. ErbB was analyzed by quantifying phosphoAKT (Ser473) to total AKT, and phosphoERK1 (T202/Y204)/ERK2(T185/Y187) to total ERK; graphs are the densitometry quantifications of Western blot bands normalized to wild-type line and are shown as an average (± SEM) (*p<0.05, **p<0.01, ***p<0.001, two-sided Student’s t test).DOI:https://dx.doi.org/10.7554/eLife.17047.011 Image collected and cropped by CiteAb from the following publication (https://elifesciences.org/articles/17047), licensed under a CC-BY license. Not internally tested by R&D Systems.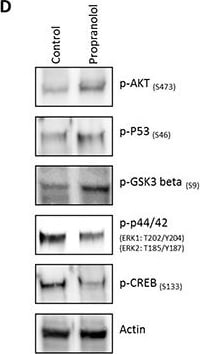
Detection of Human ERK1/ERK2 by Western Blot
beta -blockers inhibit the proliferation of breast cancer cell lines(A) A dose curve of propranolol was administered to a panel of breast cancer cell lines and normal primary mammary epithelial cells (HMECS) and viability was assessed. (B) Immunofluorescent detection of Ki-67 protein expression in control or propranolol-treated (18 μM) SK-BR-3 breast cancer cells after 24 hours. Hoechst 33342 was used as a nuclear counterstain. (C) Heatmap depicting phospho-MAPK antibody array results testing the status of 24 kinases in SK-BR-3 cells subjected to 24 hours control or propranolol (18 μM). (red = upregulated; green = downregulated; black = no detectable expression). (D) Western blot confirmation of the antibody array results in SK-BR-3 cells subjected to 24 hours control or propranolol (18 μM). (D) Western blot analysis of cell lysates from SK-BR-3 cells subjected to 24 hours control or propranolol (18 μM), confirming the phosphorylation events identified in the antibody array. Image collected and cropped by CiteAb from the following publication (https://www.oncotarget.com/lookup/doi/10.18632/oncotarget.14119), licensed under a CC-BY license. Not internally tested by R&D Systems.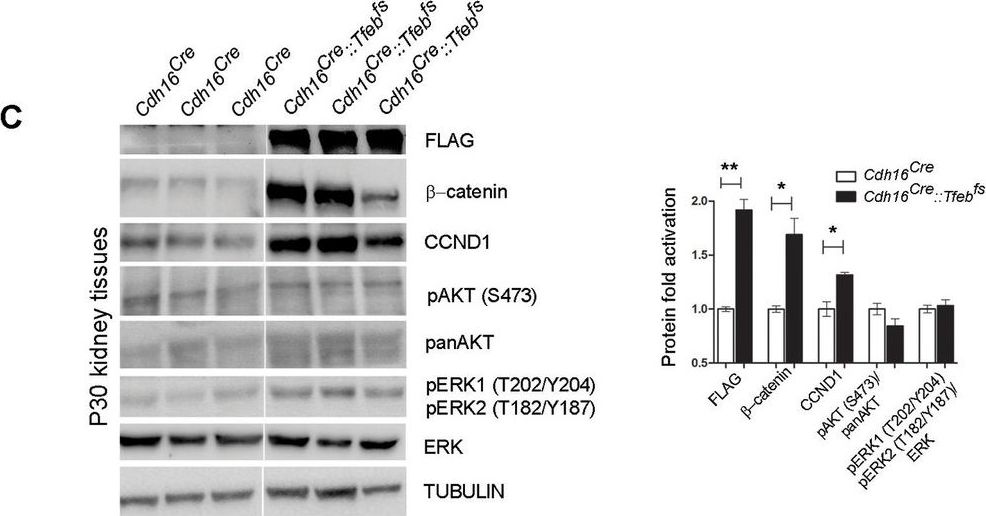
Detection of Mouse ERK1/ERK2 by Western Blot
Activation of ErbB and WNT signaling pathways in kidneys from Cdh16Cre::Tfebfs mice.Transcriptional and biochemical analyses were performed on Cdh16Cre and Cdh16Cre::Tfebfs mice. (A,B) Tables show the relative increase of genes related to the ErbB (A) and WNT (B) pathways in the microarray analyses performed on kidneys from P0 Cdh16Cre::Tfebfs mice. Graphs show real-time PCR validations performed on kidneys from Cdh16Cre::Tfebfs mice at different stages (P0, P12, P30). Data are shown as the average (± SEM) of at least three Cdh16Cre::Tfebfs mice normalized versus wild-type mice. (C,D) Immunoblot analyses performed on (C) P30 kidney tissues and (D) primary kidney cells isolated from Cdh16Cre::Tfebfs mice to evaluate ErbB and WNT activation status. Each replicate is a distinct biological sample. ErbB signaling was assessed by looking at phosphoAKT (Ser473) to total AKT ratio, and phosphoERK1 (T202/Y204)/ERK2(T185/Y187) to total ERK ratio; WNT signaling was assessed by quantifying beta -catenin and CCND1 (Cyclin D1) protein levels. Graphs represent the densitometry quantification of Western blot bands. Values are normalized to actin when not specified and are shown as an average (± SEM) (*p<0.05, **p<0.01, ***p<0.001, two-sided, Student’s t test).DOI:https://dx.doi.org/10.7554/eLife.17047.00710.7554/eLife.17047.008Figure 3—source data 1.Complete list of 294 genes (represented by 361 probesets) significantly induced (FDR≤0.05) in the KSP_P0 microarray dataset (GSE62977).The genes are ranked by decreasing signed ratio (KSP_P0/CTL).DOI:https://dx.doi.org/10.7554/eLife.17047.00810.7554/eLife.17047.009Figure 3—source data 2.Complete list of 628 genes (represented by 729 probesets) significantly induced (FDR≤0.05) in the KSP_P14 microarray dataset (GSE63376).The genes are ranked by decreasing signed ratio (KSP_P14/CTL).DOI:https://dx.doi.org/10.7554/eLife.17047.009Complete list of 294 genes (represented by 361 probesets) significantly induced (FDR≤0.05) in the KSP_P0 microarray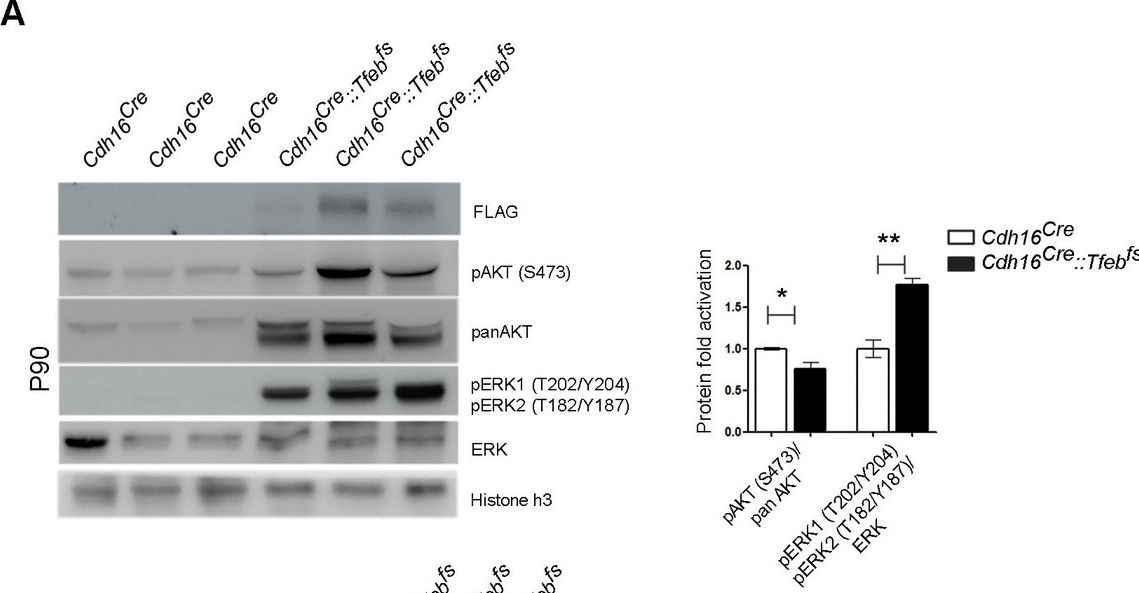
Detection of Mouse Human/Mouse/Rat Phospho-ERK1(T202/Y204)/ERK2 (T185/Y187) Antibody by Western Blot
Biochemical analysis of ErbB signaling.Immunoblot analysis performed on P90 kidneys from Cdh16Cre::Tfebfs mice (A) and P90 Cdh16CreErt2::Tfebfs animals induced with tamoxifen at P14 (B) and at P30 (C), respectively. Each replicate is a different biological sample. ErbB was analyzed by quantifying phosphoAKT (Ser473) to total AKT, and phosphoERK1 (T202/Y204)/ERK2(T185/Y187) to total ERK; graphs are the densitometry quantifications of Western blot bands normalized to wild-type line and are shown as an average (± SEM) (*p<0.05, **p<0.01, ***p<0.001, two-sided Student’s t test).DOI:http://dx.doi.org/10.7554/eLife.17047.011 Image collected and cropped by CiteAb from the following publication (https://pubmed.ncbi.nlm.nih.gov/27668431), licensed under a CC-BY license. Not internally tested by R&D Systems.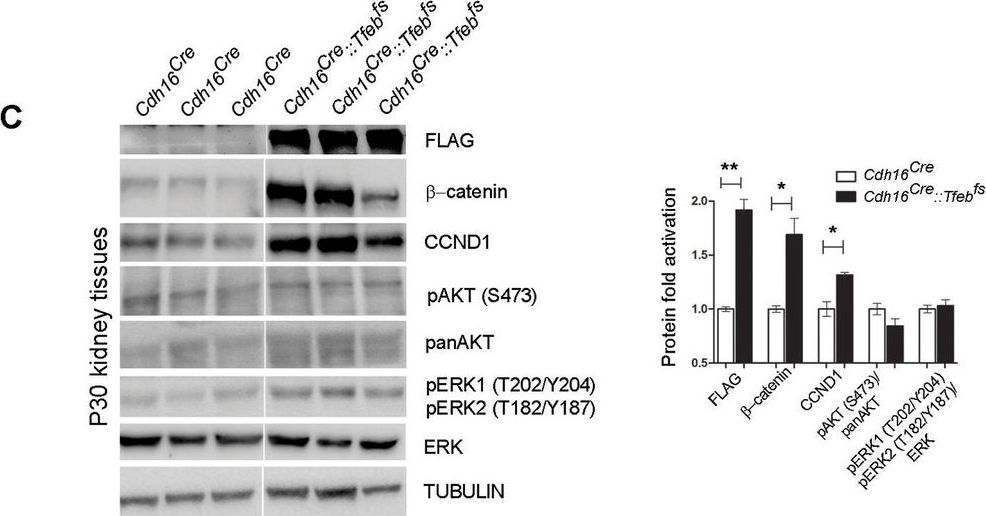
Detection of Mouse Human/Mouse/Rat Phospho-ERK1(T202/Y204)/ERK2 (T185/Y187) Antibody by Western Blot
Activation of ErbB and WNT signaling pathways in kidneys from Cdh16Cre::Tfebfs mice.Transcriptional and biochemical analyses were performed on Cdh16Cre and Cdh16Cre::Tfebfs mice. (C,D) Immunoblot analyses performed on (C) P30 kidney tissues and (D) primary kidney cells isolated from Cdh16Cre::Tfebfs mice to evaluate ErbB and WNT activation status. Each replicate is a distinct biological sample. ErbB signaling was assessed by looking at phosphoAKT (Ser473) to total AKT ratio, and phosphoERK1 (T202/Y204)/ERK2(T185/Y187) to total ERK ratio; WNT signaling was assessed by quantifying beta -catenin and CCND1 (Cyclin D1) protein levels. Graphs represent the densitometry quantification of Western blot bands. Values are normalized to actin when not specified and are shown as an average (± SEM) (*p<0.05, **p<0.01, ***p<0.001, two-sided, Student’s t test). Image collected and cropped by CiteAb from the following publication (https://pubmed.ncbi.nlm.nih.gov/27668431), licensed under a CC-BY license. Not internally tested by R&D Systems.Applications for phospho-ERK1/ERK2 (ERK1 T202/Y204, ERK2 T185/Y187) Antibody
COMET
CyTOF-ready
Flow Cytometry
Sample: Jurkat human acute T cell leukemia cell line treated with PMA
Immunohistochemistry
Sample: Perfusion fixed frozen sections of rat brain (cortex)
Multiplex Immunofluorescence
Sample: Immersion fixed paraffin-embedded sections of human brain cortex and mouse cerebellum
Simple Western
Sample: HeLa human cervical epithelial carcinoma cell line treated with PMA
Western Blot
Sample: PMA-treated HeLa human cervical epithelial carcinoma cell line
Reviewed Applications
Read 4 reviews rated 4.8 using AF1018 in the following applications:
Flow Cytometry Panel Builder
Bio-Techne Knows Flow Cytometry
Save time and reduce costly mistakes by quickly finding compatible reagents using the Panel Builder Tool.
Advanced Features
- Spectra Viewer - Custom analysis of spectra from multiple fluorochromes
- Spillover Popups - Visualize the spectra of individual fluorochromes
- Antigen Density Selector - Match fluorochrome brightness with antigen density

Formulation, Preparation, and Storage
Purification
Reconstitution
Reconstitute at 0.2 mg/mL in sterile PBS. For liquid material, refer to CoA for concentration.
Formulation
Shipping
Stability & Storage
- 12 months from date of receipt, -20 to -70 °C as supplied.
- 1 month, 2 to 8 °C under sterile conditions after reconstitution.
- 6 months, -20 to -70 °C under sterile conditions after reconstitution.
Calculators
Background: ERK1/ERK2
References
- Roskoski Jr., R. (2012) Pharmacol Res. 66:105.
Long Name
Alternate Names
Additional ERK1/ERK2 Products
Product Documents for phospho-ERK1/ERK2 (ERK1 T202/Y204, ERK2 T185/Y187) Antibody
Certificate of Analysis
To download a Certificate of Analysis, please enter a lot or batch number in the search box below.
Note: Certificate of Analysis not available for kit components.
Product Specific Notices for phospho-ERK1/ERK2 (ERK1 T202/Y204, ERK2 T185/Y187) Antibody
For research use only
Citations for phospho-ERK1/ERK2 (ERK1 T202/Y204, ERK2 T185/Y187) Antibody
 Powered by Bioz
Customer Reviews for phospho-ERK1/ERK2 (ERK1 T202/Y204, ERK2 T185/Y187) Antibody (4)
Have you used phospho-ERK1/ERK2 (ERK1 T202/Y204, ERK2 T185/Y187) Antibody?
Submit a review and receive an Amazon gift card!
$25/€18/£15/$25CAN/¥2500 for a review with an image
$10/€7/£6/$10CAN/¥1110 for a review without an image
Submit a review
Customer Images
-
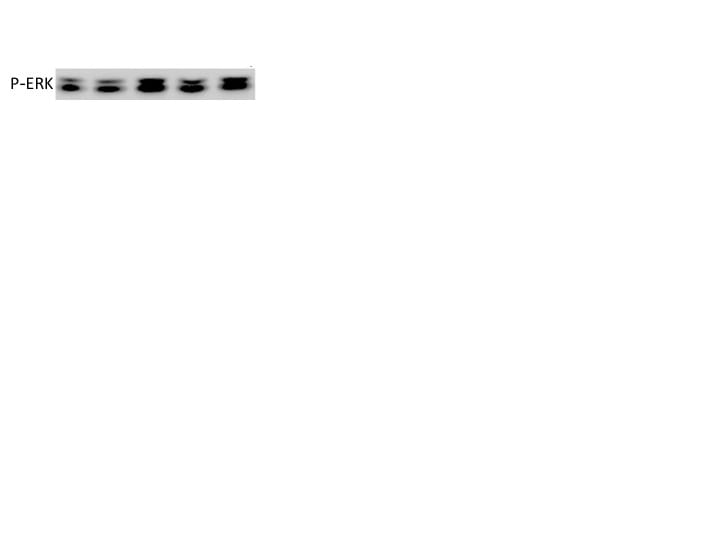
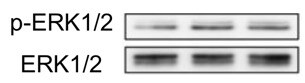
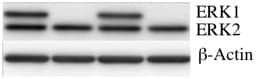
Application: Western BlotSample Tested: HEK293 human embryonic kidney cell lineSpecies: HumanVerified Customer | Posted 07/21/2018

-
Application: Western BlotSample Tested: PANC-1 human pancreatic carcinoma cell lineSpecies: HumanVerified Customer | Posted 01/12/2018
-
Application: Western BlotSample Tested: HEK293 human embryonic kidney cell lineSpecies: HumanVerified Customer | Posted 01/11/2018
-
Application: Western BlotSample Tested: See PMID 23559668Species: RatVerified Customer | Posted 01/05/2015
There are no reviews that match your criteria.
Protocols
Find general support by application which include: protocols, troubleshooting, illustrated assays, videos and webinars.
- 7-Amino Actinomycin D (7-AAD) Cell Viability Flow Cytometry Protocol
- Antigen Retrieval Protocol (PIER)
- Antigen Retrieval for Frozen Sections Protocol
- Appropriate Fixation of IHC/ICC Samples
- Cellular Response to Hypoxia Protocols
- Chromogenic IHC Staining of Formalin-Fixed Paraffin-Embedded (FFPE) Tissue Protocol
- Chromogenic Immunohistochemistry Staining of Frozen Tissue
- ClariTSA™ Fluorophore Kits
- Detection & Visualization of Antibody Binding
- Extracellular Membrane Flow Cytometry Protocol
- Flow Cytometry Protocol for Cell Surface Markers
- Flow Cytometry Protocol for Staining Membrane Associated Proteins
- Flow Cytometry Staining Protocols
- Flow Cytometry Troubleshooting Guide
- Fluorescent IHC Staining of Frozen Tissue Protocol
- Graphic Protocol for Heat-induced Epitope Retrieval
- Graphic Protocol for the Preparation and Fluorescent IHC Staining of Frozen Tissue Sections
- Graphic Protocol for the Preparation and Fluorescent IHC Staining of Paraffin-embedded Tissue Sections
- Graphic Protocol for the Preparation of Gelatin-coated Slides for Histological Tissue Sections
- IHC Sample Preparation (Frozen sections vs Paraffin)
- Immunofluorescent IHC Staining of Formalin-Fixed Paraffin-Embedded (FFPE) Tissue Protocol
- Immunohistochemistry (IHC) and Immunocytochemistry (ICC) Protocols
- Immunohistochemistry Frozen Troubleshooting
- Immunohistochemistry Paraffin Troubleshooting
- Intracellular Flow Cytometry Protocol Using Alcohol (Methanol)
- Intracellular Flow Cytometry Protocol Using Detergents
- Intracellular Nuclear Staining Flow Cytometry Protocol Using Detergents
- Intracellular Staining Flow Cytometry Protocol Using Alcohol Permeabilization
- Intracellular Staining Flow Cytometry Protocol Using Detergents to Permeabilize Cells
- Preparing Samples for IHC/ICC Experiments
- Preventing Non-Specific Staining (Non-Specific Binding)
- Primary Antibody Selection & Optimization
- Propidium Iodide Cell Viability Flow Cytometry Protocol
- Protocol for Heat-Induced Epitope Retrieval (HIER)
- Protocol for Liperfluo
- Protocol for Making a 4% Formaldehyde Solution in PBS
- Protocol for VisUCyte™ HRP Polymer Detection Reagent
- Protocol for the Characterization of Human Th22 Cells
- Protocol for the Characterization of Human Th9 Cells
- Protocol for the Preparation & Fixation of Cells on Coverslips
- Protocol for the Preparation and Chromogenic IHC Staining of Frozen Tissue Sections
- Protocol for the Preparation and Chromogenic IHC Staining of Frozen Tissue Sections - Graphic
- Protocol for the Preparation and Chromogenic IHC Staining of Paraffin-embedded Tissue Sections
- Protocol for the Preparation and Chromogenic IHC Staining of Paraffin-embedded Tissue Sections - Graphic
- Protocol for the Preparation and Fluorescent IHC Staining of Frozen Tissue Sections
- Protocol for the Preparation and Fluorescent IHC Staining of Paraffin-embedded Tissue Sections
- Protocol for the Preparation of Gelatin-coated Slides for Histological Tissue Sections
- Protocol: Annexin V and PI Staining by Flow Cytometry
- Protocol: Annexin V and PI Staining for Apoptosis by Flow Cytometry
- R&D Systems Quality Control Western Blot Protocol
- TUNEL and Active Caspase-3 Detection by IHC/ICC Protocol
- The Importance of IHC/ICC Controls
- Troubleshooting Guide: Fluorokine Flow Cytometry Kits
- Troubleshooting Guide: Immunohistochemistry
- Troubleshooting Guide: Western Blot Figures
- Western Blot Conditions
- Western Blot Protocol
- Western Blot Protocol for Cell Lysates
- Western Blot Troubleshooting
- Western Blot Troubleshooting Guide
- View all Protocols, Troubleshooting, Illustrated assays and Webinars
Associated Pathways

