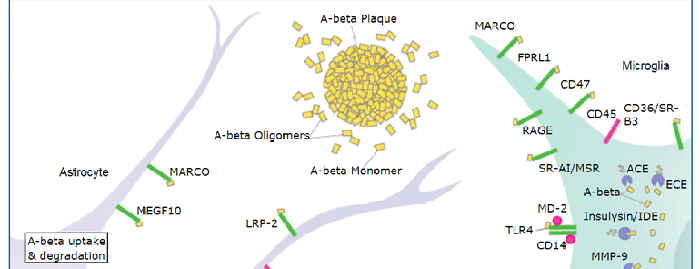
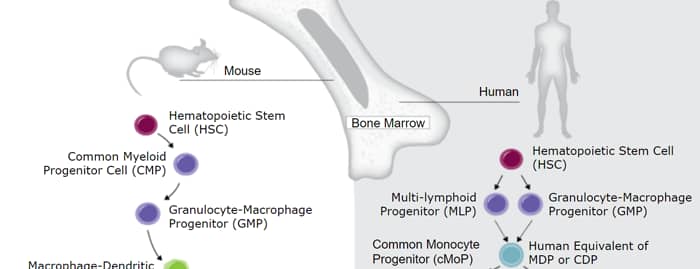
Mouse CD45 (also known as Ly5 and leukocyte common antigen) is a 180‑220 kDa variably glycosylated member of the class 1 subtype of the protein tyrosine phosphatase family. It is synthesized as a 1291 amino acid (aa) precursor that contains a 23 aa signal sequence, a 541 aa extracellular domain (ECD), a 22 aa transmembrane segment, and a 705 aa cytoplasmic region. The ECD is coded for by exons 4‑16 of the CD45 gene. Alternate splicing of exon 4 (or A) (aa 30‑74), exon 5 (or B) (aa 75‑123) and exon 6 (or C) (aa 124‑169) define different lymphocyte populations and functional stages. Naïve T cells express exon 5 (CD45 RB), while activated T cells express neither exon 4, 5 or 6 (CD 45 RO). B cells express CD45 RABC, while resting NK cells express CD45 RA. Mouse CD45 ECD shares 60% and 44% aa sequence identity with rat and human full‑length CD45 ECD, respectively.

Scientific images may be resized, cropped, or adjusted for brightness or contrast for presentation purposes. These updates are limited to presentation and do not affect the underlying scientific interpretation of the data. Where available, additional source data may be provided upon request.
Key Product Details
Species Reactivity
Validated:
Cited:
Applications
Validated:
Cited:
Label
Antibody Source
Product Specifications
Immunogen
Gln24-Lys425
Accession # NP_035340
Specificity
Clonality
Host
Isotype
Scientific Data Images for Mouse CD45 Antibody
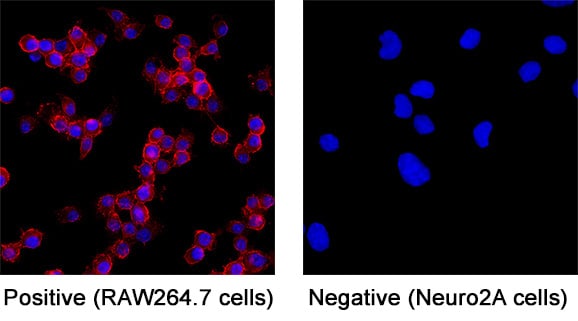
CD45 in RAW 264.7 Mouse Cell Line.
CD45 was detected in immersion fixed RAW 264.7 mouse monocyte/macrophage cell line (positive staining) and Neuro‑2A mouse neuroblastoma cell line (negative staining) using Goat Anti-Mouse CD45 Antigen Affinity-purified Polyclonal Antibody (Catalog # AF114) at 5 µg/mL for 3 hours at room temperature. Cells were stained using the NorthernLights™ 557-conjugated Anti-Goat IgG Secondary Antibody (red; NL001) and counterstained with DAPI (blue). Specific staining was localized to cell surface. Staining was performed using our protocol for Fluorescent ICC Staining of Non-adherent Cells.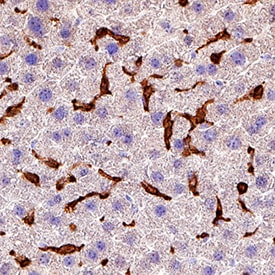
CD45 in Mouse Liver.
CD45 was detected in immersion fixed paraffin-embedded sections of mouse liver using Goat Anti-Mouse CD45 Antigen Affinity-purified Polyclonal Antibody (Catalog # AF114) at 3 µg/mL for 1 hour at room temperature followed by incubation with the Anti-Goat IgG VisUCyte™ HRP Polymer Antibody (VC004). Before incubation with the primary antibody, tissue was subjected to heat-induced epitope retrieval using Antigen Retrieval Reagent-Basic (CTS013). Tissue was stained using DAB (brown) and counterstained with hematoxylin (blue). Specific staining was localized to Kupffer cells. View our protocol for IHC Staining with VisUCyte HRP Polymer Detection Reagents.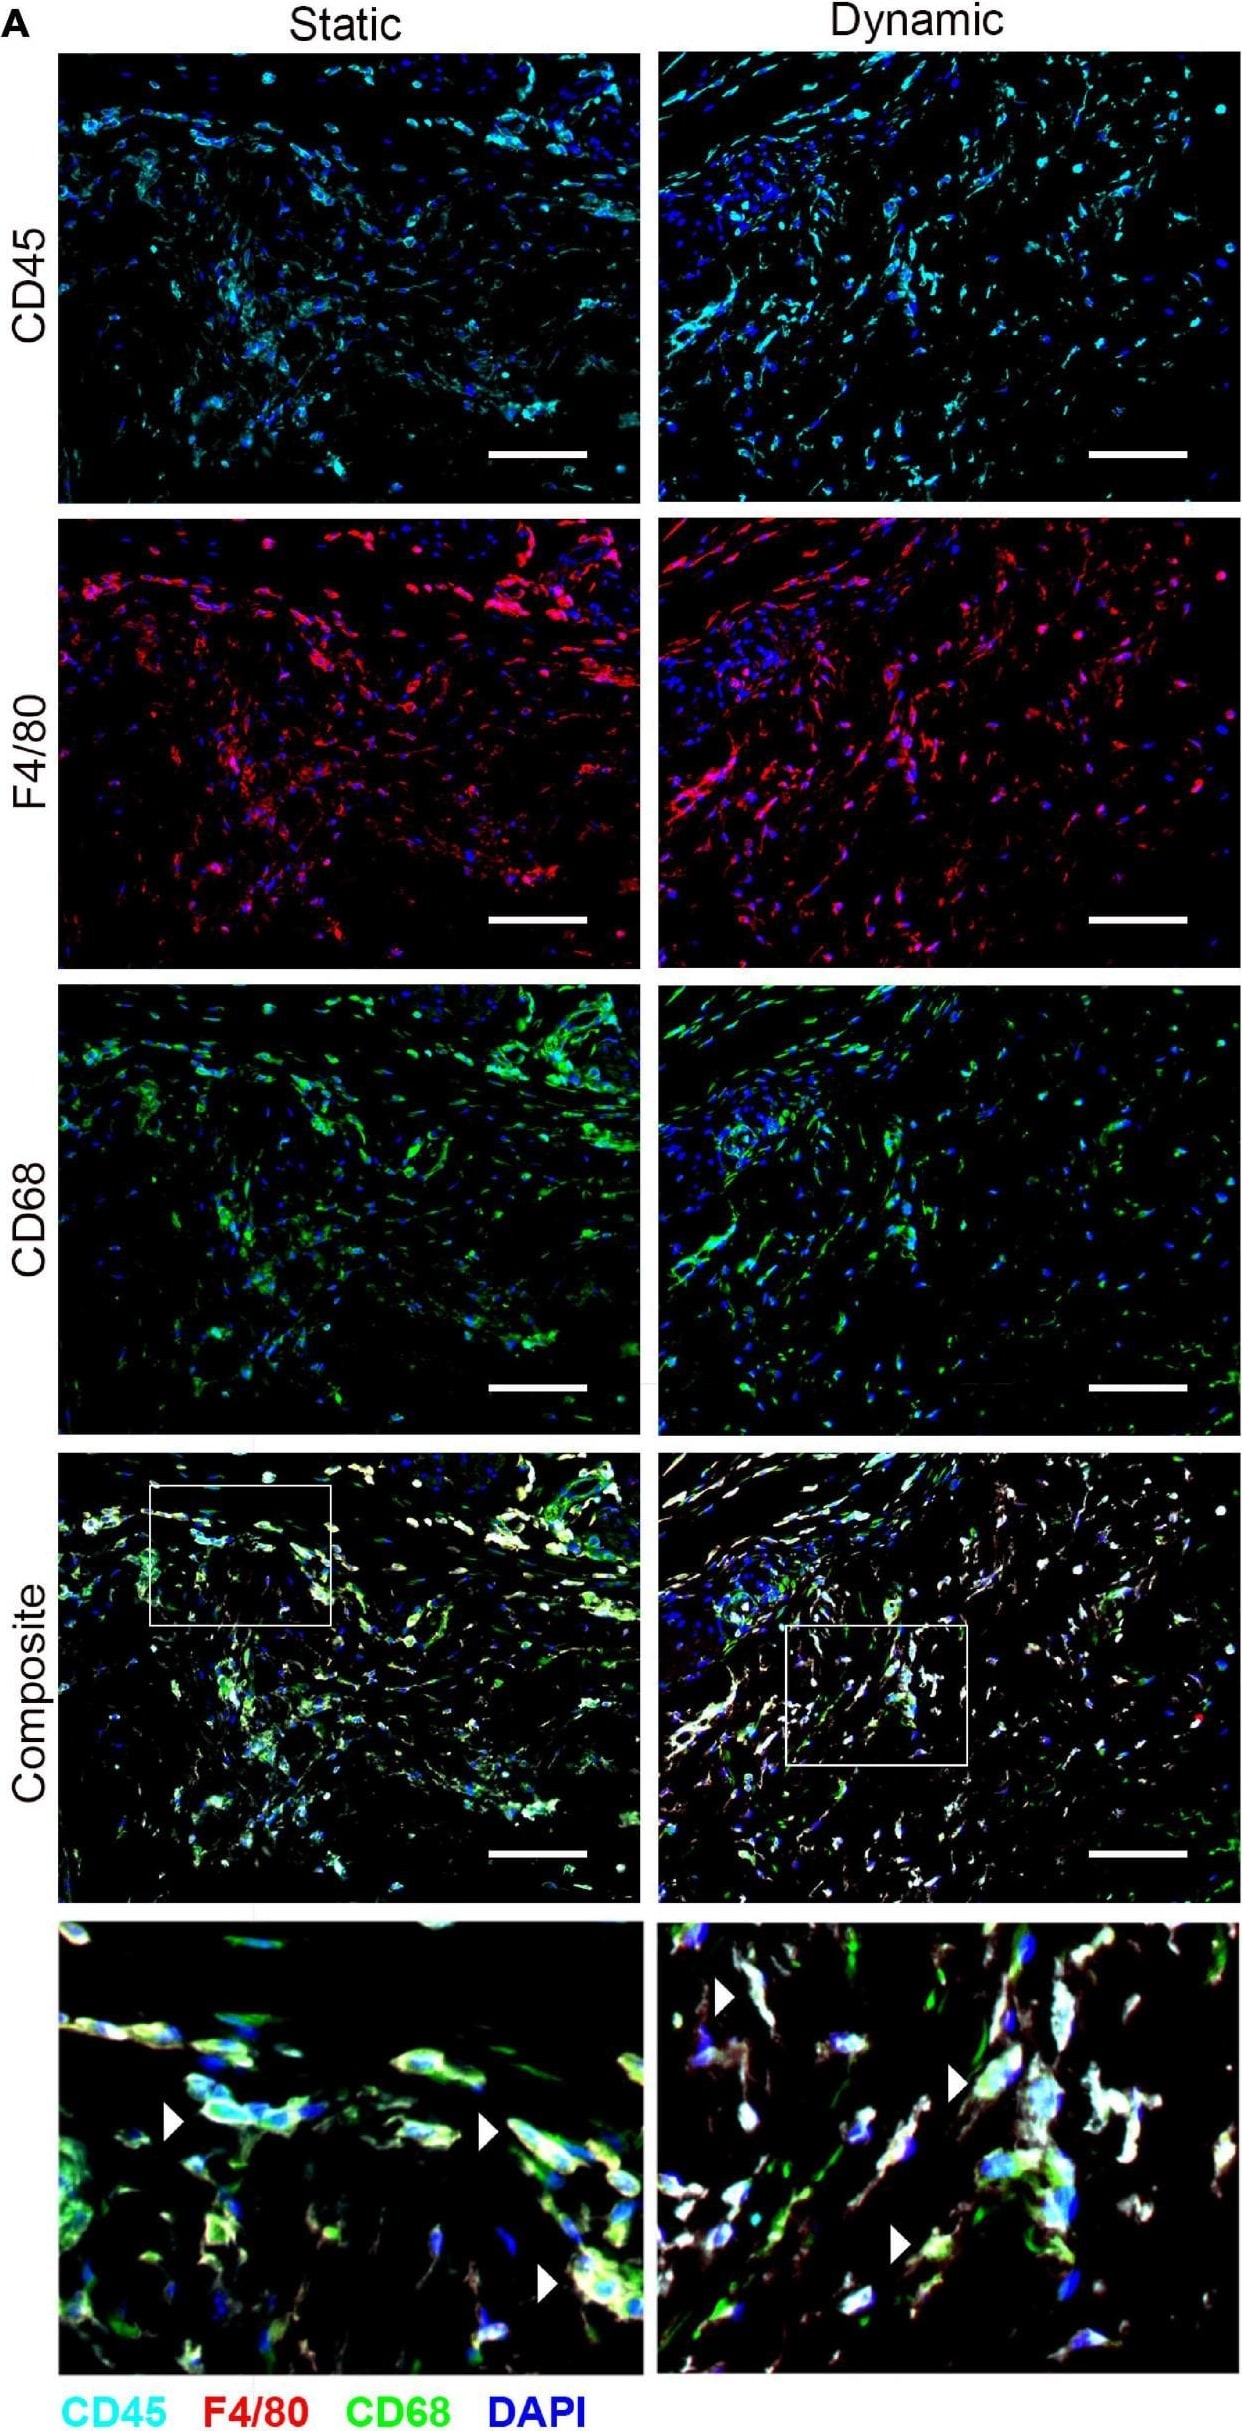
Detection of Mouse CD45 by Immunocytochemistry/Immunofluorescence
The recruitment of CD45+F4/80+CD68+ macrophages was similar in the ASC-seeded DAT scaffolds that were cultured dynamically and statically for 14 days prior to implantation in the nu/nu mouse model. (A) Representative images showing CD45 (cyan), F4/80 (red), and CD68 (green) expression with DAPI counterstaining (blue) at 1-week post-implantation. Scale bars represent 100 μm. Boxed regions in the composite images are shown at higher magnification below. White arrowheads highlight CD45+F4/80+CD68+DAPI+ cells. (B) CD45+F4/80+CD68+DAPI+ cell density in the static and dynamic groups. (C) The percentage of CD45+F4/80+CD68+DAPI+ cells relative to the total CD45+DAPI+ cell population at 1, 4, and 8 weeks. *p < 0.05, **p < 0.01, ***p < 0.001. Image collected and cropped by CiteAb from the following publication (https://pubmed.ncbi.nlm.nih.gov/33816453), licensed under a CC-BY license. Not internally tested by R&D Systems.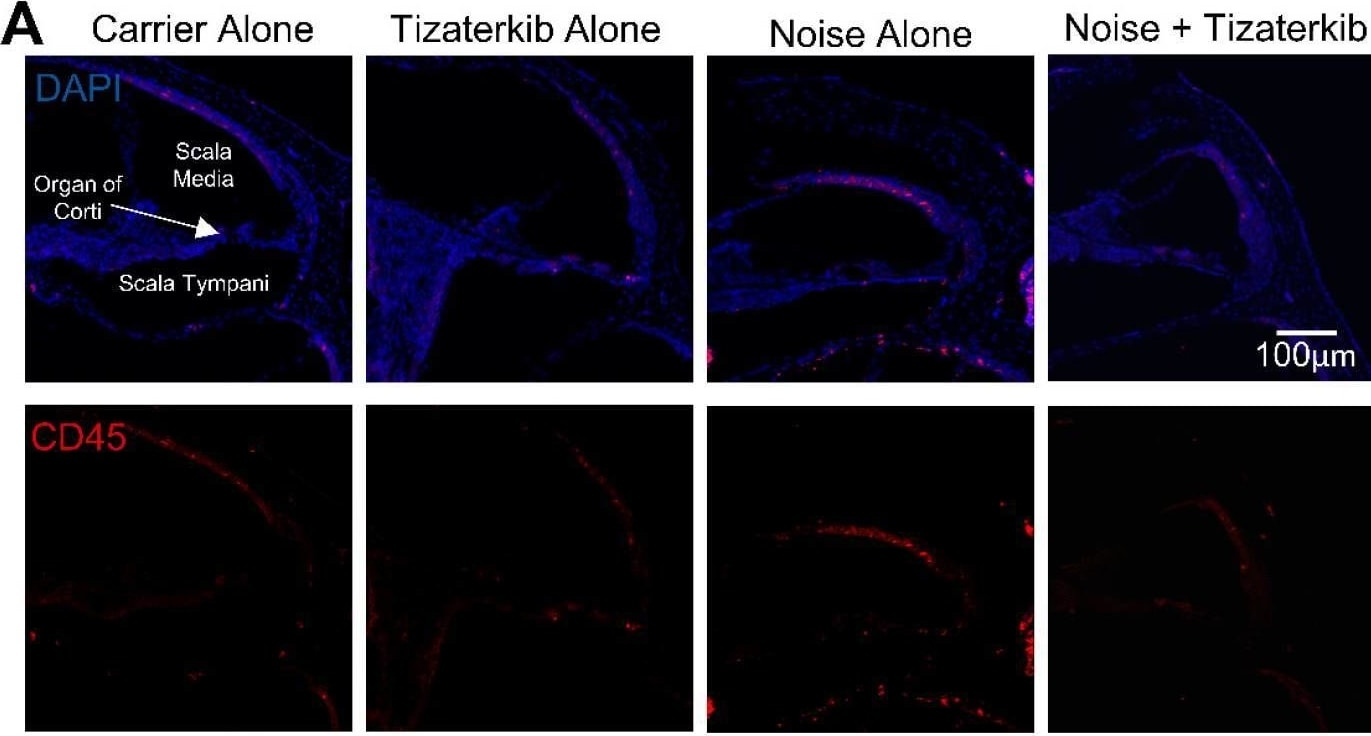
Detection of CD45 by Immunohistochemistry
Tizaterkib treatment lowers the number of CD45-positive cells in the cochlea 4 days post noise exposure. (A) Representative low-magnification images of cochlear cryosections stained with CD45 (red) and DAPI (blue). The treatment protocol shown in Figure 2A was utilized and mice were sacrificed 4 days after noise exposure, 1 h after the final tizaterkib treatment. (B) Quantification of the CD45-positive cells in the cochlear sections in (A). (C) Higher magnification of the images shown in (A) of the scala tympani. (D) Quantification of CD45-positive cells in the walls of the scala tympani as presented in (C). (E) Representative images of cochlear cryosections of the stria vascularis following noise and tizaterkib treatment. (F) Quantification of CD45-positive cells per experimental group from the images in (E). Carrier (black), tizaterkib alone (blue), noise alone (red), noise + tizaterkib (green). Data shown as means ± SEM, * p < 0.05 and *** p < 0.001 compared to noise alone by one-way ANOVA with a Bonferroni post hoc test. n = 3–6 mice, with 3 sections each per mouse. Image collected and cropped by CiteAb from the following open publication (https://pubmed.ncbi.nlm.nih.gov/38928015), licensed under a CC-BY license. Not internally tested by R&D Systems.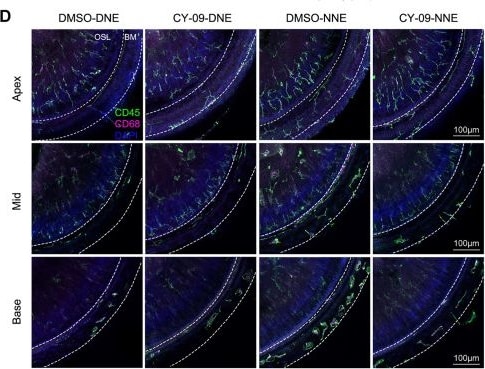
Detection of CD45 by Immunohistochemistry
Therapeutic potential of NLRP3 inhibition in the progression of nocturnal NIHL. A–C ABR thresholds were measured 14 days after DNE and NNE, comparing the CY-09-treated group and the control group. Grey shading indicates the range of noise frequencies. Data are presented as the mean ± SD, replicated across four independent noise exposures per group (n = 9 for DMSO-DNE, n = 7 for CY-09-DNE, n = 9 for DMSO-NNE, and n = 9 for CY-09-NNE; **P < 0.01, ***P < 0.001, ****P < 0.0001, two-way ANOVA, Bonferroni post hoc test). D Representative confocal images of CD45 (green) and CD68 (pink)-stained macrophages in the BM at 3 days after DNE and NNE. Scale bars, 100 μm. E Numbers of CD45+CD68+ cells in the BM at 3 days after DNE and NNE. Data are presented as the mean ± SD from 3 mice per group, replicated across three independent noise exposures (*P < 0.05, **P < 0.01, ***P < 0.001, ****P < 0.0001, one-way ANOVA, Bonferroni post hoc test). F, G Representative western blots and statistical analysis of pro-caspase-1, IL-1 beta, and IL-18 protein expression at 3 days after DNE and NNE. Protein levels are normalized to ACTB. Data are presented as the mean ± SD from 3–6 mice per group, replicated across three independent noise exposures (*P < 0.05, **P < 0.01, ***P < 0.001, ****P < 0.0001, one-way ANOVA, Bonferroni post hoc test). Image collected and cropped by CiteAb from the following open publication (https://link.springer.com/10.1007/s12264-025-01440-1), licensed under a CC-BY license. Not internally tested by R&D Systems.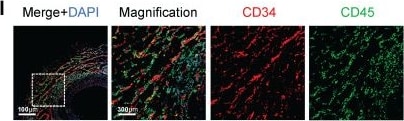
Detection of CD45 by Immunohistochemistry
Characterization of CD34+ cells in transplant arteriosclerosis. (A) The schematic diagram of arterial graft model (left); Zone map for grafted artery segment (middle); An overview of the in vivo experiment strategy (right). (B) The whole-mount immunostaining of CD34 in normal thoracic aortas (n = 6), isografts (n = 6) and allografts (n = 6). (C) The en-face immunostaining of CD34 in normal thoracic aortas (n = 6), isografts (n = 6) and allografts (n = 6). (D)Representative immunostaining images of CD34 on cryosections from normal thoracic aortas (n = 6), isografts (n = 6) and allografts (n = 6). (E) Representative HE staining images from normal thoracic aortas (n = 6), isografts (n = 6) and allografts (n = 6). (F-I) Representative co-immunofluorescence images of CD34 and the endothelial cell marker CD31, smooth muscle cell marker alpha -SMA ( alpha -smooth muscle actin), fibrotic cell marker PDGFR-alpha (platelet-derived growth factor receptor alpha ), and inflammatory cell marker CD45 in 4-week grafted arteries (n = 8). Nuclei were counterstained with DAPI. (J) Semi-quantification of the percentage of CD34+ cells that express CD31, alpha -SMA, PDGFR-alpha and CD45. Data were presented as the mean ± SEM. (K) Flow cytometry analysis of the proportion of CD31, alpha -SMA, PDGFR-alpha and CD45 positive cells expressing CD34 in 4-week grafted arteries (n = 6). (L) Cartoon image showing that CD34+ cells include a subset of endothelial cells (ECs), adventitial stem/progenitor cells (adSPCs), CD45+ cells and fibroblasts (FBs). Image collected and cropped by CiteAb from the following open publication (https://www.thno.org/v15p2523.htm), licensed under a CC-BY license. Not internally tested by R&D Systems.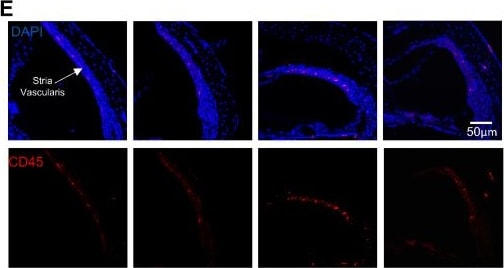
Detection of CD45 by Immunohistochemistry
Tizaterkib treatment lowers the number of CD45-positive cells in the cochlea 4 days post noise exposure. (A) Representative low-magnification images of cochlear cryosections stained with CD45 (red) and DAPI (blue). The treatment protocol shown in Figure 2A was utilized and mice were sacrificed 4 days after noise exposure, 1 h after the final tizaterkib treatment. (B) Quantification of the CD45-positive cells in the cochlear sections in (A). (C) Higher magnification of the images shown in (A) of the scala tympani. (D) Quantification of CD45-positive cells in the walls of the scala tympani as presented in (C). (E) Representative images of cochlear cryosections of the stria vascularis following noise and tizaterkib treatment. (F) Quantification of CD45-positive cells per experimental group from the images in (E). Carrier (black), tizaterkib alone (blue), noise alone (red), noise + tizaterkib (green). Data shown as means ± SEM, * p < 0.05 and *** p < 0.001 compared to noise alone by one-way ANOVA with a Bonferroni post hoc test. n = 3–6 mice, with 3 sections each per mouse. Image collected and cropped by CiteAb from the following open publication (https://pubmed.ncbi.nlm.nih.gov/38928015), licensed under a CC-BY license. Not internally tested by R&D Systems.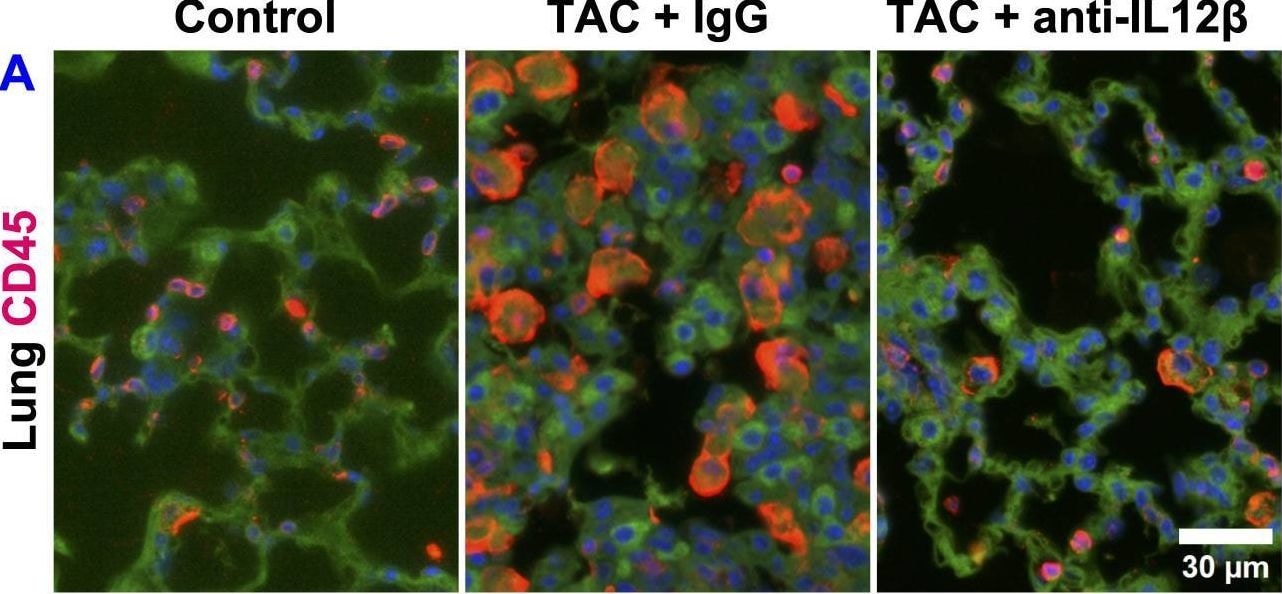
Detection of CD45 by Immunohistochemistry
Pharmacological inhibition of IL12 beta attenuated TAC-induced pulmonary inflammation. (A, B) Representative images and quantified data of infiltrated CD45+ leukocytes in the lung performed by immuno-histological staining. (C) The percentage of immune cell subsets within CD45+ leukocytes. (D) The percentage of different macrophage subsets within F4/80 macrophages. (E) The percentage of immune cell subsets within CD3+ T cells. *p<0.05; #p<0.05 IgG-treated TAC mice compared with the control; †p<0.05 anti-IL12 beta -treated TAC mice compared with IgG-treated TAC mice; $p<0.05 anti-IL12 beta -treated TAC mice compared with the control; Mφ, Macrophage; DCs, Dendritic Cells; NK, Natural Killer Cells; AMφ, Alveolar Mφ; IMφ, Interstitial Mφ; MdMφ, Monocyte-derived Mφ; NKT, Natural Killer T Cells; n = 4–5 mice per group. Image collected and cropped by CiteAb from the following open publication (https://www.frontiersin.org/articles/10.3389/fimmu.2025.1624940/full), licensed under a CC-BY license. Not internally tested by R&D Systems.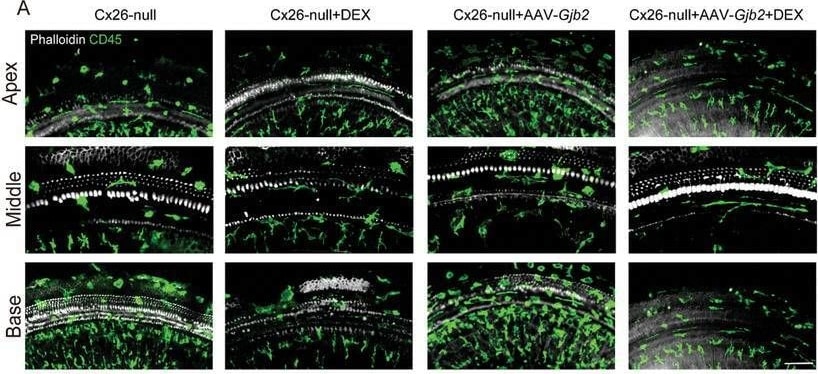
Detection of CD45 by Immunohistochemistry
Distribution of CD45+ macrophages in different group. The mice were injected subcutaneously with tamoxifen (TMX) at P0 and P1 and injected with AAV2.7m8‐gfaABC1D‐Gjb2 (5 × 10⁹ genome‐containing (particles) (GCs) per ear) at P2. Dexamethasone was administered to mice at a dose of 3 mg kg−1 every two days starting at P10‐24. All of the mice were tested for auditory brainstem response (ABR) and sacrificed at P24–P25. A) Immunofluorescent staining of CD45+ macrophages (green) in the apex, middle and base turns of different groups. White: F‐actin. Scale bars = 30 µm. B,C) Statistics of CD45+ cell number and macrophage size in different groups. Data are shown as mean ± SEM. *p < 0.05, **p < 0.01, and ***p < 0.001. ns: non‐significant. Image collected and cropped by CiteAb from the following open publication (https://pubmed.ncbi.nlm.nih.gov/39739601), licensed under a CC-BY license. Not internally tested by R&D Systems.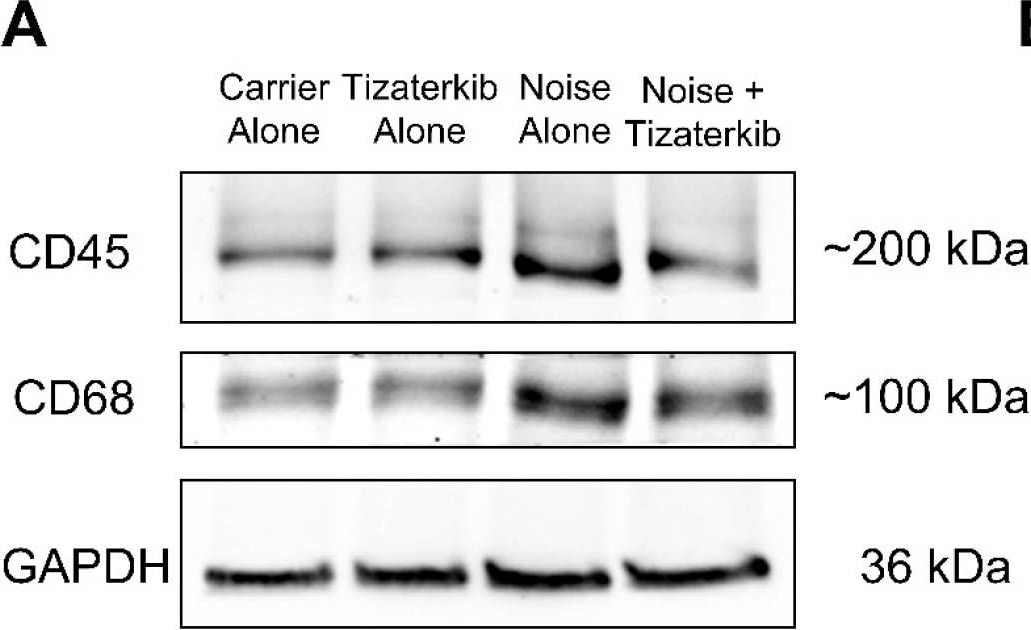
Detection of CD45 by Western Blot
Tizaterkib treatment lowers the amount of CD45 and CD68 in the cochlea 6 days post noise exposure. (A) Western blots showing the amount of CD45 and CD68 in the cochlea following noise exposure and tizaterkib treatment. The same treatment protocol shown in Figure 2A was utilized and mice were sacrificed 6 days after noise exposure. (B) CD45/GAPDH ratio, normalized to the carrier-alone lane. Band intensities were measured using ImageJ software (version 1.54g). (C) CD68/GAPDH ratio, normalized to the carrier-alone lane. Data shown as means ± SEM, * p < 0.05 and ** p < 0.01 compared to noise alone by one-way ANOVA with a Bonferroni post hoc test. The experimental groups, from left to right, are as follows: carrier alone, tizaterkib alone, noise alone, and noise + tizaterkib. Each group had the cochleae from 5 mice (10 cochleae) pooled together to make the tissue lysate. n = 5. Image collected and cropped by CiteAb from the following open publication (https://pubmed.ncbi.nlm.nih.gov/38928015), licensed under a CC-BY license. Not internally tested by R&D Systems.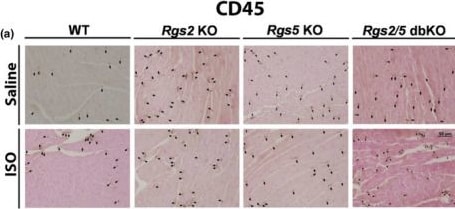
Detection of CD45 by Immunohistochemistry
Loss of RGS2 or RGS5 increases immune cell presence in ventricular tissue. Representative CD45 labeling (brown) (a, quantified in b (n = 8 hearts)) and CD68 labeling (c, quantified in d (n = 4–5 hearts)) demonstrates increased immune cell infiltration in saline‐treated Rgs2 and Rgs5 KO ventricular tissue. Symbols in the graphs represent individual samples from separate animals. Data in the summarized plots are mean ± standard deviation. Two‐way ANOVA mixed model, with Šidák post hoc analysis, was applied for multiple comparisons for statistical significance. Stated numbers in the graphs are p‐values for individual comparisons. SAL, saline; ISO, isoproterenol. Image collected and cropped by CiteAb from the following open publication (https://pubmed.ncbi.nlm.nih.gov/39746869), licensed under a CC-BY license. Not internally tested by R&D Systems.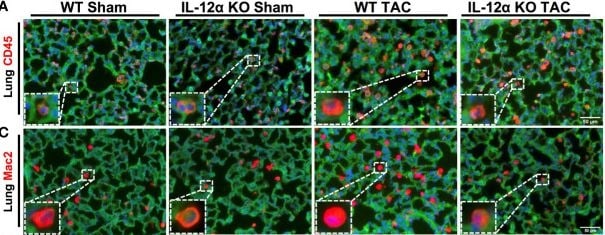
Detection of CD45 by Immunohistochemistry
IL-12 alpha KO significantly attenuated TAC-induced pulmonary inflammation, fibrosis, and vessel remodeling. (A–D) Representative images and quantified data of infiltrating leukocytes or macrophages in the lung performed by immuno-histological staining. (E, F) Representative images and quantified data of lung fibrosis performed by Sirius red/Fast green staining. (G, H) Representative images and quantified data of pulmonary vessel remodeling performed by immuno-histological staining. (I–L) Alterations of MCP1, IL-6, IL-1 alpha, and IL-1 beta per lungs sample. *p<0.05; ns, non-significant. Image collected and cropped by CiteAb from the following open publication (https://pubmed.ncbi.nlm.nih.gov/36860846), licensed under a CC-BY license. Not internally tested by R&D Systems.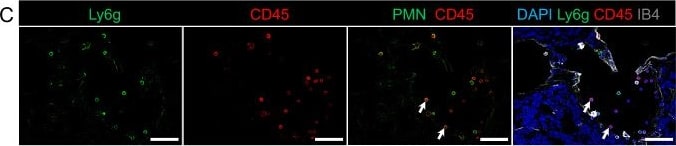
Detection of CD45 by Immunohistochemistry
Representative scanning electron microscopy and immunofluorescence showed recruitment of different immune cell subsets at CCM lesions in the cerebellum of the Ccm3iECKO mice at P28 for chronic CCM. A Leukocytes are attached to the endothelial cells of CCM lesions in chronic CCM. B-E Cerebellum in Ccm3iECKO mice at P28 in chronic CCM. DAPI staining (blue), together with: (B) MHC class II (green), CD45 (red) and isolectin-B4 (white); (C) Ly6g+ (green), CD45 (red) and isolectin-B4 (white); (D) F4/80 (green), CD45 (red) and isolectin-B4 (white); and (E) CD45R/B220 (red) and CD45 (white). White line in (E) shows the location of the lesions in the cerebellum; white arrows, examples of the immune cell subsets that are positive for both DAPI and CD45. Scale bars: 10 μm (A); 50 μm (B–E). Image collected and cropped by CiteAb from the following open publication (https://link.springer.com/10.1007/s00018-022-04224-2), licensed under a CC-BY license. Not internally tested by R&D Systems.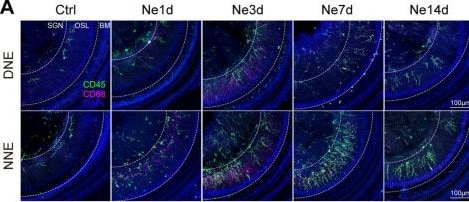
Detection of CD45 by Immunohistochemistry
Macrophage recruitment and activation in response to noise exposure, particularly after NNE. A Representative confocal images of activated OSL macrophages in the middle turn of cochleae at pre-exposure days 1, 3, 7, and 14 (Ctrl, Ne1d, Ne3d, Ne7d, and Ne14d) after DNE and NNE. Macrophages are stained with CD45 (green) and CD68 (pink). Scale bars, 100 μm. For representative images of other OSL and BM macrophages, see also Fig. S3A–J. B Quantification of CD45+CD68+ macrophages in the OSL of the middle turn. Macrophage counts increase significantly after 3 days of exposure, particularly in the NNE group. Data are presented as the mean ± SD from 3 mice per group, replicated across three independent noise exposures (ns, no significant difference, *P < 0.05, two-way ANOVA, Bonferroni post hoc test). C Schematic of macrophage depletion using CLs via caudal vein injection. D–F ABR thresholds were measured 14 days after DNE and NNE, comparing CL treatment with control. Grey represents the range of noise frequencies. Data are presented as the mean ± SD, replicated across 3–4 independent noise exposures per group (*P < 0.05, two-way ANOVA, Bonferroni post hoc test, n = 10 for Ctrl-DNE, n = 10 for CL treatment-DNE, n = 11 for Ctrl-NNE, and n = 12 for CL treatment-NNE). G Representative confocal images of macrophages stained by CD68 (green) in the mid-modiolar axis at 3 days after DNE and NNE, comparing CL treatment with control. Scale bars, 100 μm. H Numbers of macrophages per section in the apical, middle, and basal turns. Data are presented as the mean ± SD from 3 mice per group, replicated across three independent noise exposures (*P < 0.05, **P < 0.01, ***P < 0.001, one-way ANOVA, Bonferroni post hoc test). Image collected and cropped by CiteAb from the following open publication (https://link.springer.com/10.1007/s12264-025-01440-1), licensed under a CC-BY license. Not internally tested by R&D Systems.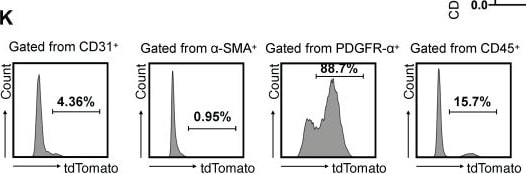
Detection of CD45 by Flow Cytometry
Characterization of CD34+ cells in transplant arteriosclerosis. (A) The schematic diagram of arterial graft model (left); Zone map for grafted artery segment (middle); An overview of the in vivo experiment strategy (right). (B) The whole-mount immunostaining of CD34 in normal thoracic aortas (n = 6), isografts (n = 6) and allografts (n = 6). (C) The en-face immunostaining of CD34 in normal thoracic aortas (n = 6), isografts (n = 6) and allografts (n = 6). (D)Representative immunostaining images of CD34 on cryosections from normal thoracic aortas (n = 6), isografts (n = 6) and allografts (n = 6). (E) Representative HE staining images from normal thoracic aortas (n = 6), isografts (n = 6) and allografts (n = 6). (F-I) Representative co-immunofluorescence images of CD34 and the endothelial cell marker CD31, smooth muscle cell marker alpha -SMA ( alpha -smooth muscle actin), fibrotic cell marker PDGFR-alpha (platelet-derived growth factor receptor alpha ), and inflammatory cell marker CD45 in 4-week grafted arteries (n = 8). Nuclei were counterstained with DAPI. (J) Semi-quantification of the percentage of CD34+ cells that express CD31, alpha -SMA, PDGFR-alpha and CD45. Data were presented as the mean ± SEM. (K) Flow cytometry analysis of the proportion of CD31, alpha -SMA, PDGFR-alpha and CD45 positive cells expressing CD34 in 4-week grafted arteries (n = 6). (L) Cartoon image showing that CD34+ cells include a subset of endothelial cells (ECs), adventitial stem/progenitor cells (adSPCs), CD45+ cells and fibroblasts (FBs). Image collected and cropped by CiteAb from the following open publication (https://www.thno.org/v15p2523.htm), licensed under a CC-BY license. Not internally tested by R&D Systems.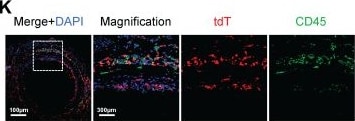
Detection of CD45 by Immunohistochemistry
Arterial CD34+ cells affect neointimal hyperplasia in the development of allograft arteriosclerosis. (A) Schematic showing genetic lineage tracing by CD34-CreERT2; Rosa26-tdTomato; iDTR. (B) Representative immunofluorescence images of tdT+ cells from cryosections of CD34-CreERT2; Rosa26-tdTomato; iDTR mice treated with (n = 6) or without (n = 6) DT. (C) Representative co-immunofluorescence images of tdTomato and CD34 in CD34-CreERT2; Rosa26-tdTomato; iDTR mice (n = 6); and semi-quantification of the percentage of tdTomato+ cells in CD34+ cells. Data were presented as the mean ± SEM. (D) Sketch of the experimental strategy. (E) Representative HE staining of grafted arteries (n = 6); and semi-quantification of neointimal area in the presence and ablation of CD34+ cells. Data were presented as the mean ± SEM and analyzed by using an unpaired two-tailed Student's t-test. (F-K) Representative co-immunofluorescence images of CD34 and PDGFR-alpha, CD31, and CD45 on cryosections from 4-week grafted arteries in the group with (n = 6) and without (n = 6) DT. (L) Semi-quantification of the percentage of PDGFR-alpha, CD31 and CD45 cells expressing tdTomato for F-K. Data were presented as the mean ± SEM and analyzed by using an unpaired two-tailed Student's t-test. * p < 0.05, ** p < 0.01, *** p < 0.001, **** p < 0.0001. (M) Cartoon image showing that CD34+ cells repair endothelial cells and promote neointimal thickening in allograft injury. Image collected and cropped by CiteAb from the following open publication (https://www.thno.org/v15p2523.htm), licensed under a CC-BY license. Not internally tested by R&D Systems.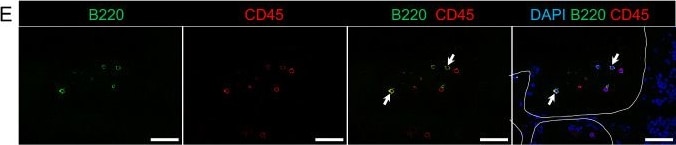
Detection of CD45 by Immunohistochemistry
Representative scanning electron microscopy and immunofluorescence showed recruitment of different immune cell subsets at CCM lesions in the cerebellum of the Ccm3iECKO mice at P28 for chronic CCM. A Leukocytes are attached to the endothelial cells of CCM lesions in chronic CCM. B-E Cerebellum in Ccm3iECKO mice at P28 in chronic CCM. DAPI staining (blue), together with: (B) MHC class II (green), CD45 (red) and isolectin-B4 (white); (C) Ly6g+ (green), CD45 (red) and isolectin-B4 (white); (D) F4/80 (green), CD45 (red) and isolectin-B4 (white); and (E) CD45R/B220 (red) and CD45 (white). White line in (E) shows the location of the lesions in the cerebellum; white arrows, examples of the immune cell subsets that are positive for both DAPI and CD45. Scale bars: 10 μm (A); 50 μm (B–E). Image collected and cropped by CiteAb from the following open publication (https://link.springer.com/10.1007/s00018-022-04224-2), licensed under a CC-BY license. Not internally tested by R&D Systems.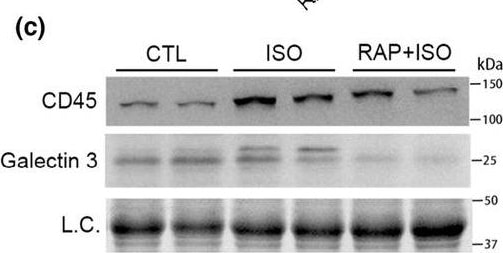
Detection of CD45 by Western Blot
Pretreatment with rapamycin (RAP) attenuates the isoproterenol (ISO)‐induced necrosis in mouse hearts. A and B, Evan's blue dye (EBD) uptake assays. Mice of the control (CTL), ISO, and RAP + ISO groups were subject to an intraperitoneal injection of EBD (100 μg/g, i.p.) 6 h after the second saline or ISO injection and sacrificed 18 h later for tissue collection. The cryosections of ventricular myocardium were counterstained with DAPI (blue) and Alexa 488‐conjugated phalloidin (green) before imaged with a confocal microscope. EBD showed red auto‐fluorescence. Shown are representative confocal micrographs taken from anatomically comparable locations (a) and a graph summarizing the percentage EBD‐positive area from 4 mice per group (b). mean ± SD; n = 4 mice (3 males and 1 female) per group. (c–e) Representative images (c) and pooled densitometry data (d, e) of western blot analyses for myocardial CD45 and Galectin 3. Total myocardial protein extracts were used L.C., loading control; mean ± SD; n = 3 mice per group. p Values are derived from one‐way ANOVA followed by Tukey's test. Image collected and cropped by CiteAb from the following open publication (https://pubmed.ncbi.nlm.nih.gov/38444056), licensed under a CC-BY license. Not internally tested by R&D Systems.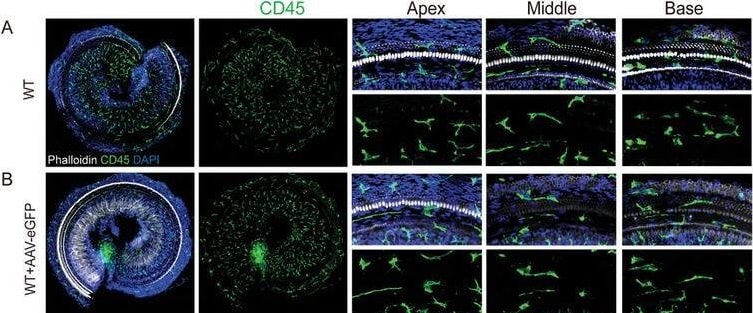
Detection of CD45 by Immunohistochemistry
Distribution of CD45+ macrophages in AAV2.7m8‐Gjb2 injection group. Mice were injected with AAV2.7m8‐gfaABC1D‐eGFP or AAV2.7m8‐gfaABC1D‐Gjb2 (5 × 10⁹ genome‐containing (particles) (GCs) at P2 and the cochlea was harvested at P24. Beginning at P10‐24, mice were administered dexamethasone at a dose of 3 mg kg−1 once every two days. A–D) Immunofluorescent staining of CD45+ macrophages (green) in the apical, middle, and basal turns of different groups. Blue: DAPI. White: F‐actin. Scale bars represent 200 and 30 µm, respectively. E,F) Comparison of the numbers and the macrophage size of CD45+ cells in the different groups. Data are shown as mean ± SEM. *p < 0.05, **p < 0.01, and ***p < 0.001. ns: non‐significant. Image collected and cropped by CiteAb from the following open publication (https://pubmed.ncbi.nlm.nih.gov/39739601), licensed under a CC-BY license. Not internally tested by R&D Systems.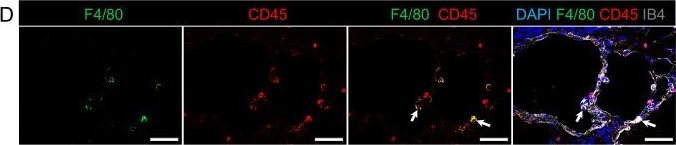
Detection of CD45 by Immunohistochemistry
Representative scanning electron microscopy and immunofluorescence showed recruitment of different immune cell subsets at CCM lesions in the cerebellum of the Ccm3iECKO mice at P28 for chronic CCM. A Leukocytes are attached to the endothelial cells of CCM lesions in chronic CCM. B-E Cerebellum in Ccm3iECKO mice at P28 in chronic CCM. DAPI staining (blue), together with: (B) MHC class II (green), CD45 (red) and isolectin-B4 (white); (C) Ly6g+ (green), CD45 (red) and isolectin-B4 (white); (D) F4/80 (green), CD45 (red) and isolectin-B4 (white); and (E) CD45R/B220 (red) and CD45 (white). White line in (E) shows the location of the lesions in the cerebellum; white arrows, examples of the immune cell subsets that are positive for both DAPI and CD45. Scale bars: 10 μm (A); 50 μm (B–E). Image collected and cropped by CiteAb from the following open publication (https://link.springer.com/10.1007/s00018-022-04224-2), licensed under a CC-BY license. Not internally tested by R&D Systems.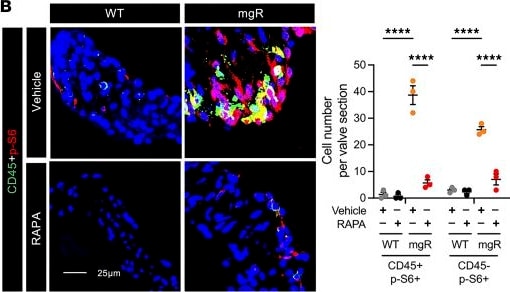
Detection of CD45 by Immunohistochemistry
Inhibition of mTOR and TGF-beta signaling and leukocyte recruitment by rapamycin during early mitral valve disease in 5-week-old mgR mice.(A) Experimental design: WT and mgR mice were treated with vehicle or rapamycin (RAPA) for 1 week from 4 to 5 weeks of age. Representative IF for (B) number of CD45+ and p-S6+ cells and (C) mean fluorescence density measurement (AU) for p-Smad2 in 5-week-old mice (n = 3–5). Scale bars: 25 μm. Pathway analysis from bulk RNA-Seq in (D) vehicle-treated WT versus mgR mice and (E) vehicle-treated versus rapamycin-treated mgR mice; input genes with adjusted P < 0.05. Data are represented as individual values with mean ± SEM; **P < 0.01, ****P < 0.0001 by 2-way ANOVA. Image collected and cropped by CiteAb from the following open publication (https://www.jci.org/articles/view/183558), licensed under a CC-BY license. Not internally tested by R&D Systems.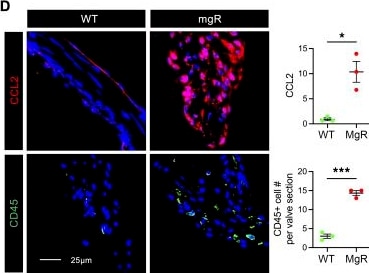
Detection of CD45 by Immunohistochemistry
TGF-beta and mTOR signaling activation and leukocyte accumulation without mitral valve leaflet degenerative changes in 4-week-old mgR mice.(A) Representative Movat pentachrome staining of mitral valve leaflets with maximal leaflet thickness measurement in 4-week-old WT versus mgR mice (n = 6). Scale bar: 100 μm. (B) Morphometric analysis of anterior mitral leaflet area (n = 4). Representative IF and mean fluorescence density measurement (AU) for (C) p-Smad2 and p-S6 (n = 6) and (D) CCL2 and number of CD45+ cells (n = 3). Scale bars: 25 μm. Data are represented as individual values with mean ± SEM; *P < 0.05, ***P < 0.001, ****P < 0.0001 by unpaired t test. Image collected and cropped by CiteAb from the following open publication (https://www.jci.org/articles/view/183558), licensed under a CC-BY license. Not internally tested by R&D Systems.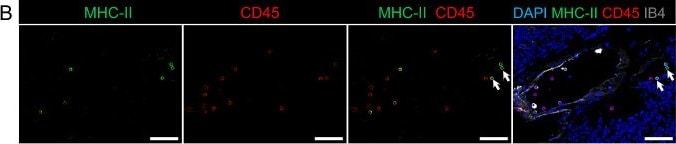
Detection of CD45 by Immunohistochemistry
Representative scanning electron microscopy and immunofluorescence showed recruitment of different immune cell subsets at CCM lesions in the cerebellum of the Ccm3iECKO mice at P28 for chronic CCM. A Leukocytes are attached to the endothelial cells of CCM lesions in chronic CCM. B-E Cerebellum in Ccm3iECKO mice at P28 in chronic CCM. DAPI staining (blue), together with: (B) MHC class II (green), CD45 (red) and isolectin-B4 (white); (C) Ly6g+ (green), CD45 (red) and isolectin-B4 (white); (D) F4/80 (green), CD45 (red) and isolectin-B4 (white); and (E) CD45R/B220 (red) and CD45 (white). White line in (E) shows the location of the lesions in the cerebellum; white arrows, examples of the immune cell subsets that are positive for both DAPI and CD45. Scale bars: 10 μm (A); 50 μm (B–E). Image collected and cropped by CiteAb from the following open publication (https://link.springer.com/10.1007/s00018-022-04224-2), licensed under a CC-BY license. Not internally tested by R&D Systems.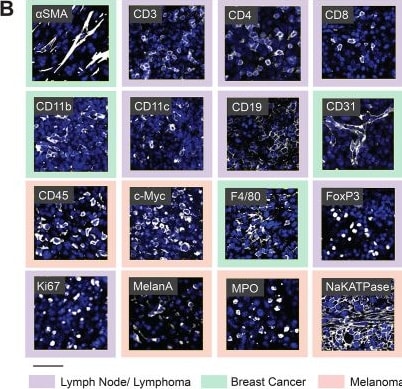
Detection of CD45 by Immunocytochemistry/ Immunofluorescence
16-plex PhenoCycler staining of murine FFPE tissues. (A) Table showing the antibodies included in our Murine FFPE PhenoCycler staining panel, and the cell type they are used to identify. (B) Images showing successful PhenoCycler staining of each antibody in the staining panel. In each image, DAPI is blue, and each individual marker is white. The colour of the outer border indicates the tissue type in the image. Scale bar is 50 µM. Image collected and cropped by CiteAb from the following open publication (https://cellandbioscience.biomedcentral.com/articles/10.1186/s13578-024…), licensed under a CC-BY license. Not internally tested by R&D Systems.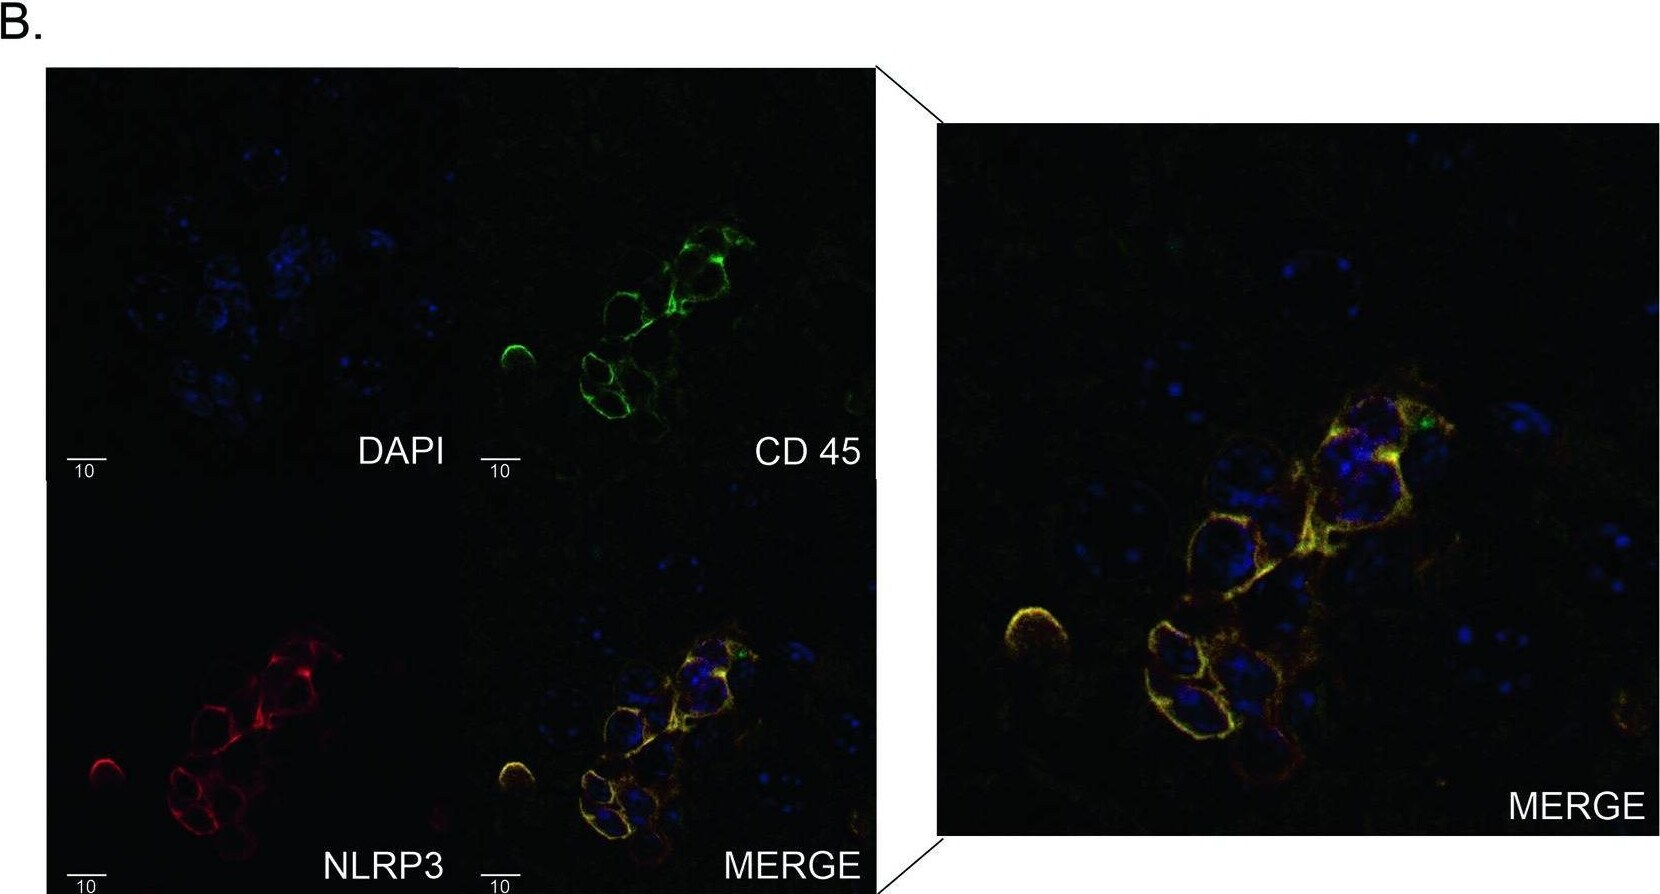
Detection of CD45 by Immunohistochemistry
Activation of the NLRP3 inflammasome in the livers of ICI-treated mice.A (left) Representative western blot from whole liver lysates of treated CTLA4+/- mice for indicated proteins and loading control (GAPDH). (right) Densitometry. B Immunofluorescence for NLRP3 and CD45 on CTLA4+/- liver treated with ICI, and overlay (bottom-right, enlarged in cutout). 40x magnification. Data are mean ± SEM n = 6/group. P-values were calculated using an unpaired t-test. P-value ** (<0.01), *** (<0.001), **** (<0.0001). Image collected and cropped by CiteAb from the following open publication (https://www.nature.com/articles/s41419-024-06535-7), licensed under a CC-BY license. Not internally tested by R&D Systems.Applications for Mouse CD45 Antibody
CyTOF-ready
Flow Cytometry
Sample: Mouse splenocytes
Immunocytochemistry
Sample: Immersion fixed RAW 264.7 mouse monocyte/macrophage cell line
Immunohistochemistry
Sample: Immersion fixed paraffin-embedded sections of mouse liver
Western Blot
Sample: Recombinant Mouse CD45 (Catalog # 114-CD)
Reviewed Applications
Read 4 reviews rated 4.8 using AF114 in the following applications:
Flow Cytometry Panel Builder
Bio-Techne Knows Flow Cytometry
Save time and reduce costly mistakes by quickly finding compatible reagents using the Panel Builder Tool.
Advanced Features
- Spectra Viewer - Custom analysis of spectra from multiple fluorochromes
- Spillover Popups - Visualize the spectra of individual fluorochromes
- Antigen Density Selector - Match fluorochrome brightness with antigen density

Formulation, Preparation, and Storage
Purification
Reconstitution
Reconstitute at 0.2 mg/mL in sterile PBS. For liquid material, refer to CoA for concentration.
Formulation
Shipping
Stability & Storage
- 12 months from date of receipt, -20 to -70 °C as supplied.
- 1 month, 2 to 8 °C under sterile conditions after reconstitution.
- 6 months, -20 to -70 °C under sterile conditions after reconstitution.
Calculators
Background: CD45
Long Name
Alternate Names
Gene Symbol
UniProt
Additional CD45 Products
Product Documents for Mouse CD45 Antibody
Certificate of Analysis
To download a Certificate of Analysis, please enter a lot or batch number in the search box below.
Note: Certificate of Analysis not available for kit components.
Product Specific Notices for Mouse CD45 Antibody
For research use only
Related Research Areas
Citations for Mouse CD45 Antibody
 Powered by Bioz
Customer Reviews for Mouse CD45 Antibody (4)
Have you used Mouse CD45 Antibody?
Submit a review and receive an Amazon gift card!
$25/€18/£15/$25CAN/¥2500 for a review with an image
$10/€7/£6/$10CAN/¥1110 for a review without an image
Submit a review
Customer Images
-
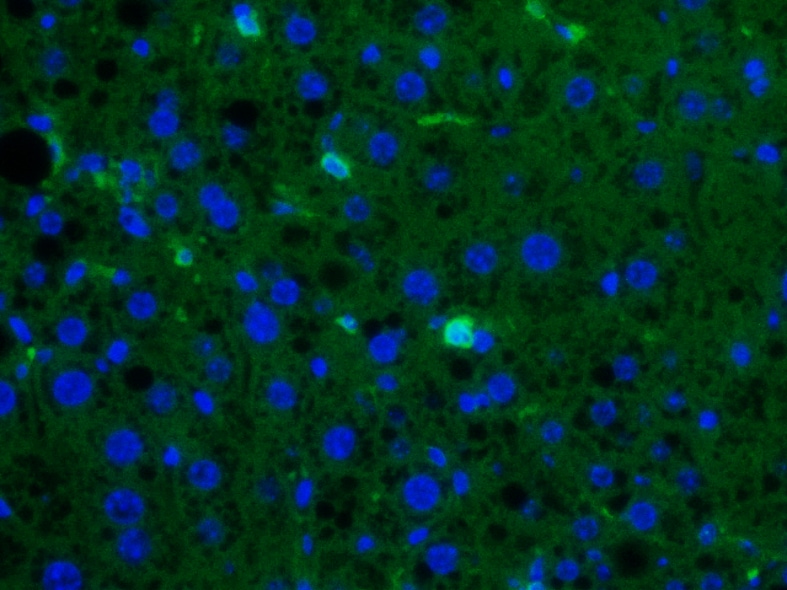
Application: ImmunofluorescenceSample Tested: Liver tissueSpecies: MouseVerified Customer | Posted 06/26/2026Immunofluorescence micrograph of ex vivo mouse liver tissue section. Bright green spots show CD45+ cells (AF488 secondary), and blue spots are nuclei (DAPI). Specific signal is clear.Used for ex vivo IF staining on mouse liver tissue sections to detect CD45+ cells. Primary antibody (AF114) was diluted at 10 µg/mL and visualized with a 488 secondary antibody.

-
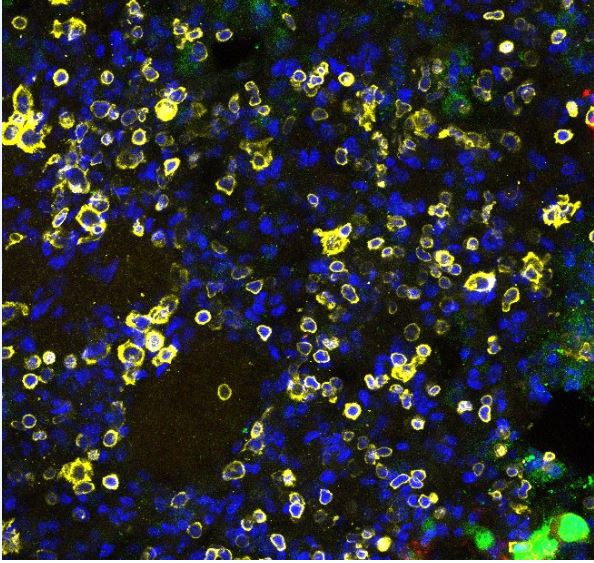
Application: Immunocytochemistry/ImmunofluorescenceSample Tested: Lung tissueSpecies: MouseVerified Customer | Posted 10/05/2023DAPI (Blue) CD45 (Yellow)
-
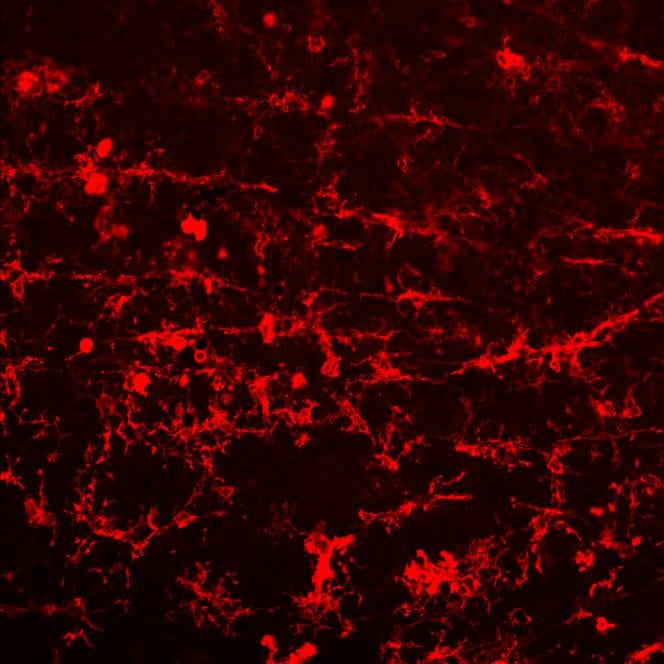
Application: ImmunohistochemistrySample Tested: retinal faltmountsSpecies: miceVerified Customer | Posted 11/08/2022
-
Application: ImmunoprecipitationSample Tested: See PMID 22345665Species: OtherVerified Customer | Posted 01/05/2015
There are no reviews that match your criteria.
Protocols
Find general support by application which include: protocols, troubleshooting, illustrated assays, videos and webinars.
- 7-Amino Actinomycin D (7-AAD) Cell Viability Flow Cytometry Protocol
- Antigen Retrieval Protocol (PIER)
- Antigen Retrieval for Frozen Sections Protocol
- Appropriate Fixation of IHC/ICC Samples
- Cellular Response to Hypoxia Protocols
- Chromogenic IHC Staining of Formalin-Fixed Paraffin-Embedded (FFPE) Tissue Protocol
- Chromogenic Immunohistochemistry Staining of Frozen Tissue
- ClariTSA™ Fluorophore Kits
- Detection & Visualization of Antibody Binding
- Extracellular Membrane Flow Cytometry Protocol
- Flow Cytometry Protocol for Cell Surface Markers
- Flow Cytometry Protocol for Staining Membrane Associated Proteins
- Flow Cytometry Staining Protocols
- Flow Cytometry Troubleshooting Guide
- Fluorescent IHC Staining of Frozen Tissue Protocol
- Graphic Protocol for Heat-induced Epitope Retrieval
- Graphic Protocol for the Preparation and Fluorescent IHC Staining of Frozen Tissue Sections
- Graphic Protocol for the Preparation and Fluorescent IHC Staining of Paraffin-embedded Tissue Sections
- Graphic Protocol for the Preparation of Gelatin-coated Slides for Histological Tissue Sections
- ICC Cell Smear Protocol for Suspension Cells
- ICC Immunocytochemistry Protocol Videos
- ICC for Adherent Cells
- IHC Sample Preparation (Frozen sections vs Paraffin)
- Immunocytochemistry (ICC) Protocol
- Immunocytochemistry Troubleshooting
- Immunofluorescence of Organoids Embedded in Cultrex Basement Membrane Extract
- Immunofluorescent IHC Staining of Formalin-Fixed Paraffin-Embedded (FFPE) Tissue Protocol
- Immunohistochemistry (IHC) and Immunocytochemistry (ICC) Protocols
- Immunohistochemistry Frozen Troubleshooting
- Immunohistochemistry Paraffin Troubleshooting
- Intracellular Flow Cytometry Protocol Using Alcohol (Methanol)
- Intracellular Flow Cytometry Protocol Using Detergents
- Intracellular Nuclear Staining Flow Cytometry Protocol Using Detergents
- Intracellular Staining Flow Cytometry Protocol Using Alcohol Permeabilization
- Intracellular Staining Flow Cytometry Protocol Using Detergents to Permeabilize Cells
- Preparing Samples for IHC/ICC Experiments
- Preventing Non-Specific Staining (Non-Specific Binding)
- Primary Antibody Selection & Optimization
- Propidium Iodide Cell Viability Flow Cytometry Protocol
- Protocol for Heat-Induced Epitope Retrieval (HIER)
- Protocol for Liperfluo
- Protocol for Making a 4% Formaldehyde Solution in PBS
- Protocol for VisUCyte™ HRP Polymer Detection Reagent
- Protocol for the Characterization of Human Th22 Cells
- Protocol for the Characterization of Human Th9 Cells
- Protocol for the Fluorescent ICC Staining of Cell Smears - Graphic
- Protocol for the Fluorescent ICC Staining of Cultured Cells on Coverslips - Graphic
- Protocol for the Preparation & Fixation of Cells on Coverslips
- Protocol for the Preparation and Chromogenic IHC Staining of Frozen Tissue Sections
- Protocol for the Preparation and Chromogenic IHC Staining of Frozen Tissue Sections - Graphic
- Protocol for the Preparation and Chromogenic IHC Staining of Paraffin-embedded Tissue Sections
- Protocol for the Preparation and Chromogenic IHC Staining of Paraffin-embedded Tissue Sections - Graphic
- Protocol for the Preparation and Fluorescent ICC Staining of Cells on Coverslips
- Protocol for the Preparation and Fluorescent ICC Staining of Non-adherent Cells
- Protocol for the Preparation and Fluorescent ICC Staining of Stem Cells on Coverslips
- Protocol for the Preparation and Fluorescent IHC Staining of Frozen Tissue Sections
- Protocol for the Preparation and Fluorescent IHC Staining of Paraffin-embedded Tissue Sections
- Protocol for the Preparation of Gelatin-coated Slides for Histological Tissue Sections
- Protocol for the Preparation of a Cell Smear for Non-adherent Cell ICC - Graphic
- Protocol: Annexin V and PI Staining by Flow Cytometry
- Protocol: Annexin V and PI Staining for Apoptosis by Flow Cytometry
- R&D Systems Quality Control Western Blot Protocol
- TUNEL and Active Caspase-3 Detection by IHC/ICC Protocol
- The Importance of IHC/ICC Controls
- Troubleshooting Guide: Fluorokine Flow Cytometry Kits
- Troubleshooting Guide: Immunohistochemistry
- Troubleshooting Guide: Western Blot Figures
- Western Blot Conditions
- Western Blot Protocol
- Western Blot Protocol for Cell Lysates
- Western Blot Troubleshooting
- Western Blot Troubleshooting Guide
- View all Protocols, Troubleshooting, Illustrated assays and Webinars
Associated Pathways