HIF-1 alpha Antibody (H1alpha67)
Novus Biologicals | Catalog # NB100-105
Key Product Details
Validated by
Knockout/Knockdown, Biological Validation
Species Reactivity
Validated:
Human, Mouse, Rat, Porcine, Bovine, Canine, Feline, Ferret, Monkey, Primate, Rabbit, Sheep, Xenopus
Cited:
Human, Mouse, Rat, Porcine, Bovine, Canine, Frog - Xenopus (African Clawed Frog), Ovine, Primate, Rabbit
Applications
Validated:
Knockout Validated, Immunohistochemistry, Immunohistochemistry-Paraffin, Immunohistochemistry-Frozen, Immunohistochemistry Free-Floating, Western Blot, Immunoblotting, ELISA, Immunoassay, Flow Cytometry, Immunocytochemistry/ Immunofluorescence, Simple Western, Immunoprecipitation, Chromatin Immunoprecipitation, Chromatin Immunoprecipitation (ChIP), In vitro assay, Proximity Ligation Assay, Ligand Activation, Gel Super Shift Assays, Knockdown Validated, Tissue Culture Substratum
Cited:
Immunohistochemistry, Immunohistochemistry-Paraffin, Immunohistochemistry-Frozen, Immunohistochemistry Free-Floating, Western Blot, Immunoblotting, ELISA, Immunoassay, Flow Cytometry, Immunocytochemistry/ Immunofluorescence, Simple Western, Immunoprecipitation, Chemotaxis, EMSA, Proximity Ligation Assay, Gel Supershift Assay, IF/IHC, IHC/IF, Knockdown Validated, SDS-Page
Label
Unconjugated
Antibody Source
Monoclonal Mouse IgG2B Clone # H1alpha67
Loading...
Product Specifications
Immunogen
This HIF-1 alpha Antibody (H1alpha67) was developed against a fusion protein containing amino acids 432 - 528 of human HIF-1 alpha [Uniprot# Q16665].
Reactivity Notes
Use in Rat reported in scientific literature (PMID:33816617).
Localization
HIF-1 is a nuclear protein
Clonality
Monoclonal
Host
Mouse
Isotype
IgG2B
Theoretical MW
93 kDa.
Disclaimer note: The observed molecular weight of the protein may vary from the listed predicted molecular weight due to post translational modifications, post translation cleavages, relative charges, and other experimental factors.
Disclaimer note: The observed molecular weight of the protein may vary from the listed predicted molecular weight due to post translational modifications, post translation cleavages, relative charges, and other experimental factors.
Scientific Data Images for HIF-1 alpha Antibody (H1alpha67)


Knockout Validation of HIF-1 alpha Antibody in HeLa and HIF-1 Knockout HeLa Cells
HIF-1 alpha was detected in immersion fixed DFO treated Hela cells (left) but was not detected in HIF-1 knockout HeLa cells (right) using Mouse Anti-human HIF-1 alpha monoclonal antibody (Catalog # NB100-105) at 25 ug/mL for 3 hours at room temperature. Cells were stained using a NorthernLights (TM) 557-conjugated Donkey Anti-Mouse IgG Secondary Antibody (red; Catalog # NL007) and counterstained with DAPI (blue). Specific staining was localized to nuclei.
Detection of HIF-1 alpha in WT and HIF-1 alpha Knockout Mouse Cells by Western Blot
Naive CD4 T cells from WT, VHL-deficient (Vhl KO), or HIF-1 alpha-deficient (HIF-1 alpha KO) mice were differentiated under IL-22-skewing conditions for a total of 60 h. Some cells remained at normoxia for the duration of the culture (N); others were at normoxia for 35 h and then hypoxia (1% O2) for 24 h (H). At 60 h, nuclear extracts were harvested, and HIF-1 alpha and Lamin B1 levels were analyzed by Western blot. Image from verified customer review.
Immunohistochemical Staining of HIF-1 alpha in Human Kidney
Staining of HIF-1 alpha in human kidney using NB100-105. Renal tubular epithelium showed moderate membranous, cytoplasmic and nuclear staining, and glomeruli showed faint to moderate nuclear staining.
Flow Cytometry of Myeloma Cells Stained with Alexa Fluor 488 Conjugated HIF-1 alpha Antibody
Analysis using the Alexa Fluor (R) 488 conjugate of NB100-105. Staining of HIF-1 alpha in multiple myeloma cells: H929 cells (0.5 x 10^6) were stained with Alexa Fluor 488(R) conjugated HIF-1 alpha antibody (NB100-105AF488). Image courtesy of Dr. Barbara Muz at Washington University in St. Louis School of Medicine.
Western Blot Analysis of HIF-1 alpha in Nuclear-Enriched and Whole Cell Extracts from Non-Diabetic and T2D Donor Islets
HIF-1-alpha-Antibody-H1alpha67-Western-Blot-NB100-105-img0029.jpg
Immunohistological Staining of HIF-1 alpha in Paraffin Embedded Human Glioblastoma Multiforme
Analysis using the biotin conjugate of NB100-105. Staining of human glioblastoma multiforme.
Staining of HIF-1 alpha in DFOA Treated and non-Treated HeLa Cells
HIF-1 alpha was detected in immersion fixed HeLa human cervical epithelial carcinoma cell line treated with DFOA using 1 ug/mL of mouse anti-HIF-1 alpha monoclonal antibody NB100-105. Cells were stained using a donkey anti-rabbit secondary antibody and counterstained with DAPI (blue).

Staining of HIF-1 alpha in Paraffin Embedded Human Throat Cancer
Analysis using HIF-1 alpha Antibody on human throat cancer tissue. PFA fixed paraffin-embedded sections. Primary antibody dilution 1:100. Image from verified customer review.


Western Blot of HIF-1 alpha in CD11c+ Cells from C57BL/6 Mice and Densitometric Analysis
HIF-1-alpha-Antibody-H1alpha67-Western-Blot-NB100-105-img0030.jpg
Western Blot Detection of HIF-1 alpha in Nonmalignant and PCa Cell Lines
HIF-1-alpha-Antibody-H1alpha67-Western-Blot-NB100-105-img0031.jpg
Immunohistological Detection of HIF-1 alpha in PDAC and Adjacent Normal Pancreatic Tissue
HIF-1-alpha-Antibody-H1alpha67-Immunohistochemistry-NB100-105-img0033.jpg
Flow Cytometry of H929 Cells Stained with Alexa Fluor 488 Conjugated HIF-1 alpha Antibody
Analysis using the Alexa Fluor(R) 488 conjugate of NB100-105. Staining of HIF-1 alpha in H929 cells using HIF-1 alpha antibody. Flow cytometry image submitted by a verified customer review. [NB100-105] -")
Western Blot: HIF-1 alpha Antibody (H1alpha67) [NB100-105] -
Effects of one- and five-dosage dry needling (1D, 5D) on iNOS, HIF-1 alpha, COX-2, and VEGF expressions in a needling-treated muscle. (a) Representative Western blot images. The quantification of the protein levels for (b) iNOS, (c) HIF-1 alpha, (d) COX-2, and (e) VEGF. Values are expressed as mean ± SD. *Indicates the significant difference (P < 0.05) between the sham groups (s1D and s5D). #Represents the significant difference (P < 0.05) between the 1D and 5D groups. DN: dry needling. [NB100-105] -")
Western Blot: HIF-1 alpha Antibody (H1alpha67) [NB100-105] -
Hypoxia is implicated in the adaptive response after short-term bevacizumab treatment. Expression of HIF-1 alpha in pulmonary tumor nodules of the four groups. (A) A representative western blot is shown. beta -actin was used as a loading control. (B) While most tumors showed little expression of HIF-1 alpha protein in PBS and cisplatin groups, mice that received bevacizumab and bevacizumab + cisplatin therapy showed a markedly increased level of HIF-1 alpha expression.. *P < 0.05, **P < 0.01. [NB100-105] -")
Immunohistochemistry-Paraffin: HIF-1 alpha Antibody (H1alpha67) [NB100-105] -
Effects of F2 on tumor-related biomarkers in vivoImmunohistochemical analysis of tumor-related proteins (HIF-1 alpha, VEGF, MMP-2, CD31 and KI67) in tumor sections from U87 xenograft mice treated with F2 (mg/kg i.g.). Red arrows indicate the related protein detected in the tissue samples. Values are means ± SEM of three experiments. * P<0.05 compared with DDW group. [NB100-105] -")
Western Blot: HIF-1 alpha Antibody (H1alpha67) [NB100-105] -
AAM inhibits hypoxia-induced VM formation involving HIF-1 alpha and MMP2. The HCT-116 (A) and LoVo (B) cells were treated with different concentrations of AAM under hypoxia and normoxia; the protein expression of HIF-1 alpha and MMP2 was detected by western blotting. (C, D) The mRNA expression of HIF-1 alpha and MMP2 was measured by RT-PCR (*P < 0.05, **P < 0.01, ***P < 0.001). [NB100-105] -")
Immunohistochemistry: HIF-1 alpha Antibody (H1alpha67) [NB100-105] -
Immunohistochemical analysis of STC1 expression in esophageal cancer. (A) Normal squamous epithelium was negative for STC1 expression. (B) Normal gastric glands showed positive staining for STC1, which was used as a positive control. (C) Positive staining for STC1 in esophageal squamous cell carcinoma (ESCC). (D) Negative staining for STC1 in ESCC. (E) Positive staining for HIF-1 alpha in ESCC. (F) Positive staining for p53 in ESCC. Magnification, ×100. [NB100-105] -")
Simple Western: HIF-1 alpha Antibody (H1alpha67) [NB100-105] -
Simple Western: HIF-1 alpha Antibody (H1alpha67) [NB100-105] - Effect of hypoxia on human airway epithelial cells (A549).A549 cells were subjected to hypoxia for 6, 24, and 48 hours. Cell lysates were collected and analyzed for the expression levels of various hypoxic markers by qPCR (n = 4). (A-C) The expression levels of HIF-1 alpha (A), GLUT-1 (B), and VEGFA (C) were measured. (D-G) Additionally, whole-lung lysate was used for Western blots to determine the protein expression of HIF-1 alpha, VEGFA, and FIH-1. After analyzing the data, we used the unpaired t test with Welch's correction to determine its statistical significance. *P < 0.05, ***P < 0.001, ****P < 0.0001. Image collected and cropped by CiteAb from the following publication (https://pubmed.ncbi.nlm.nih.gov/37737265 ), licensed under a CC-BY license. Not internally tested by Novus Biologicals. [NB100-105] -")
Western Blot: HIF-1 alpha Antibody (H1alpha67) [NB100-105] -
The HIF-1 alpha -BNIP3 pathway was activated during hypoxia. (a) Analysis of mitophagy-related protein expression in Neuro-2a cells by immunoblotting. Neuro-2a cells were exposed to hypoxia and/or high glucose for 48 h. Total cellular extracts were analysed by immunoblotting with antibodies against HIF-1 alpha, BNIP3, PINK1 & TOMM20. (b) The ImageJ densitometric analysis is shown. “C” represented control conditions (25 mM glucose), “G” represented high glucose conditions (75 mM glucose). The results are expressed as the mean ± SEM from three independent experiments. Two-way ANOVA, **p < 0.01, *p < 0.05, Hypoxia vs Normoxia. Full-length blots are presented in Supplementary Fig. S2. Image collected & cropped by CiteAb from the following publication (https://www.nature.com/articles/s41598-018-20162-1), licensed under a CC-BY license. Not internally tested by Novus Biologicals. [NB100-105] -")
Western Blot: HIF-1 alpha Antibody (H1alpha67) [NB100-105] -
Western Blot: HIF-1 alpha Antibody (H1alpha67) [NB100-105] - Inhibition of tumor growth in vivo by various treatments. (a) Macroscopic view of mouse tumors at the end of the study. (b) Tumor growth curves from day 0 to 40, with tumor sizes measured every 5 days, in various treatment groups as indicated. (c) Wet weight of tumors measured at the end of the study. (d) Protein expression of HIF-1 alpha examined by western blot in PC-3 xenografts exposed to various treatments. Data were presented as mean ± SD (n = 6). *p < 0.05 versus control group; #p < 0.05 versus si-HIF-1 alpha or DDP group. The original blots are presented in Supplementary Figure 6. Image collected & cropped by CiteAb from the following publication (https://www.nature.com/articles/s41598-017-07973-4), licensed under a CC-BY license. Not internally tested by Novus Biologicals. [NB100-105] -")
Western Blot: HIF-1 alpha Antibody (H1alpha67) [NB100-105] -
Western Blot: HIF-1 alpha Antibody (H1alpha67) [NB100-105] - AAM inhibits hypoxia-induced VM formation involving HIF-1 alpha & MMP2. The HCT-116 (A) & LoVo (B) cells were treated with different concentrations of AAM under hypoxia & normoxia; the protein expression of HIF-1 alpha & MMP2 was detected by western blotting. (C, D) The mRNA expression of HIF-1 alpha & MMP2 was measured by RT-PCR (*P < 0.05, **P < 0.01, ***P < 0.001). Image collected & cropped by CiteAb from the following publication (https://pubmed.ncbi.nlm.nih.gov/32499699), licensed under a CC-BY license. Not internally tested by Novus Biologicals. [NB100-105] -")
Immunocytochemistry/ Immunofluorescence: HIF-1 alpha Antibody (H1alpha67) [NB100-105] -
Immunocytochemistry/ Immunofluorescence: HIF-1 alpha Antibody (H1alpha67) [NB100-105] - Muscle repair following eccentric contraction–induced injury is concomitant with dynamic alterations of HIF2A & HIF1A expression in SCs.(A–C) Representative images of EDL myofibers from injured muscles at various time points (n >50 myofibers from 3 mice/group/time point) & stained for Pax7, DAPI, & EdU (A), HIF2A (B), or HIF1A (C). Scale bars: 20 μm. Arrowheads indicate SCs. (D) Number of Pax7+ SCs per myofiber at various time points. (E) Percentage of EdU+ SCs at various time points. (F) Percentage of HIF2A+ SCs at various time points. (G) Percentage of HIF1A+ SCs at various time points. Data represent the mean ± SEM. Image collected & cropped by CiteAb from the following publication (https://www.jci.org/articles/view/96208), licensed under a CC-BY license. Not internally tested by Novus Biologicals. [NB100-105] -")
Western Blot: HIF-1 alpha Antibody (H1alpha67) [NB100-105] -
Western Blot: HIF-1 alpha Antibody (H1alpha67) [NB100-105] - mTORC2 not mTORC1 regulates HIF‐2 alpha, GOT1 in PDAC under prolonged hypoxia. (A & B) HIF‐2 alpha mRNA & protein levels determined by qRT‐PCR (mRNA) & Western blot (protein) after treatment of Panc‐1 & Capan‐2 cells with mTORC1 inhibitor rapamycin for 48 hrs at 3% or 1% O2. beta ‐Actin was used as loading control. (C & D) Panc‐1 & Capan‐2 cells were treated with mTORC1/mTORC2 inhibitor PP242 & cultured for 48 hrs at 20%, 3% or 1% O2, & HIF‐2 alpha, GOT1 mRNA & protein levels were determined by qRT‐PCR (mRNA) & Western blot (protein). beta ‐Actin was used as loading control. Data are presented as mean ± S.D. from three independent experiments. *P < 0.05, **P < 0.01. Image collected & cropped by CiteAb from the following publication (https://pubmed.ncbi.nlm.nih.gov/28544376), licensed under a CC-BY license. Not internally tested by Novus Biologicals. [NB100-105] -")
Western Blot: HIF-1 alpha Antibody (H1alpha67) [NB100-105] -
Western Blot: HIF-1 alpha Antibody (H1alpha67) [NB100-105] - Murine tumor cells express connexin 43 (Cx43) & hypoxic-induced factor-1 alpha (HIF-1 alpha ). The expression of Cx43 & HIF-1 alpha was measured by Western blot analysis. beta -actin expression served as loading controls & total protein. Inserted values indicated relative protein expression in comparison with beta -actin. Image collected & cropped by CiteAb from the following publication (http://www.mdpi.com/1422-0067/16/1/439), licensed under a CC-BY license. Not internally tested by Novus Biologicals. [NB100-105] -")
Immunohistochemistry: HIF-1 alpha Antibody (H1alpha67) [NB100-105] -
Immunohistochemistry: HIF-1 alpha Antibody (H1alpha67) [NB100-105] - Representative microscopy images of staining for hypoxia markers in prostate tissues (MO, 400×). A) HIF-1 alpha - notice the granular cytoplasmic immunoreactivity of the malignant epithelial cells. In this case, more than 50% of the glands stained. B) LOX - strong & diffuse nuclear immunoreactivity of the epithelial cells. C) CAIX - note a focal apical cytoplasmic immunoreactivity in epithelial cells. D) VEGFR2 - moderate nuclear & weak cytoplasmic expression of the epithelial cells Image collected & cropped by CiteAb from the following publication (https://pubmed.ncbi.nlm.nih.gov/28143503), licensed under a CC-BY license. Not internally tested by Novus Biologicals. [NB100-105] -")
Western Blot: HIF-1 alpha Antibody (H1alpha67) [NB100-105] -
Western Blot: HIF-1 alpha Antibody (H1alpha67) [NB100-105] - Effect of renal medullary transfection of PHD2 plasmids on the levels of PHD2 & HIF-1 alpha in the renal medulla. (A) PHD2 mRNA levels. (B) Representative ECL gel documents of Western blot analyses depicting the protein levels of HIF-1 alpha. (C) Summarized intensities of the HIF-1 alpha blots (normalized to LS). *P < 0.05 versus others (n = 7–8). LS = low salt, HS = high salt, Ctrl = control vectors, PHD2 = PHD2 expression vectors, CoCl2 = sample from cells treated with CoCl2 as positive control. Renal medullary tissues were obtained at the end of blood pressure recording after 3 week high salt challenge. Image collected & cropped by CiteAb from the following publication (https://pubmed.ncbi.nlm.nih.gov/22686466), licensed under a CC-BY license. Not internally tested by Novus Biologicals. [NB100-105] -")
Immunohistochemistry: HIF-1 alpha Antibody (H1alpha67) [NB100-105] -
Immunohistochemistry: HIF-1 alpha Antibody (H1alpha67) [NB100-105] - Immunohistochemical analysis of STC1 expression in esophageal cancer. (A) Normal squamous epithelium was negative for STC1 expression. (B) Normal gastric glands showed positive staining for STC1, which was used as a positive control. (C) Positive staining for STC1 in esophageal squamous cell carcinoma (ESCC). (D) Negative staining for STC1 in ESCC. (E) Positive staining for HIF-1 alpha in ESCC. (F) Positive staining for p53 in ESCC. Magnification, ×100. Image collected & cropped by CiteAb from the following publication (https://www.spandidos-publications.com/10.3892/or.2011.1607), licensed under a CC-BY license. Not internally tested by Novus Biologicals. [NB100-105] -")
Immunohistochemistry-Paraffin: HIF-1 alpha Antibody (H1alpha67) [NB100-105] -
Immunohistochemistry-Paraffin: HIF-1 alpha Antibody (H1alpha67) [NB100-105] - HIF-1alpha & CAIX expression in PDAC & adjacent normal pancreatic tissue. Adjacent normal exocrine pancreas with weak nuclear & cytoplasmic HIF-1alpha staining (a). Adjacent normal pancreatic tissue with weak membranous CAIX staining in the ducts & absent staining in exocrine pancreatic tissue (b). PDAC with weak (intensity 1) nuclear & cytoplasmic HIF-1alpha staining (c). PDAC with strong (intensity 3) nuclear & moderate (intensity 2) cytoplasmic HIF-1alpha staining (d). PDAC with weak to moderate (intensity 1–2) membranous CAIX staining (e). PDAC with strong (intensity 3) membranous CAIX staining (f) Image collected & cropped by CiteAb from the following publication (https://pubmed.ncbi.nlm.nih.gov/29973215), licensed under a CC-BY license. Not internally tested by Novus Biologicals. [NB100-105] -")
Immunohistochemistry: HIF-1 alpha Antibody (H1alpha67) [NB100-105] -
Immunohistochemistry: HIF-1 alpha Antibody (H1alpha67) [NB100-105] - HIF-1 alpha staining within injured muscle area (representative figure).The animal was ventilated with 100% O2. 450 minutes after trauma, the Musculus gastrocnemius of the traumatized right hind limb was harvested & section of the muscle specimen was analyzed for HIF-1 alpha expression within the injured area. No significant staining for HIF-1 alpha of the muscle cells. Scale bar: 150 µm. Inlet: Positive staining for HIF-1 alpha expression by myeloid cells (brown), invading to the traumatized muscle. Scale bar: 10 µm. Image collected & cropped by CiteAb from the following publication (https://dx.plos.org/10.1371/journal.pone.0111151), licensed under a CC-BY license. Not internally tested by Novus Biologicals. [NB100-105] -")
Immunocytochemistry/ Immunofluorescence: HIF-1 alpha Antibody (H1alpha67) [NB100-105] -
Immunocytochemistry/ Immunofluorescence: HIF-1 alpha Antibody (H1alpha67) [NB100-105] - HIF1 alpha is activated in VSMCs during Ang II-induced vascular remodeling.WT mice were infused with saline or 1000 ng/kg/min Ang II for 28 days. a Immunofluorescence analysis of representative cross-sections of mice aortas for HIF1 alpha (red) & alpha -SMA (green), nuclei was stained with DAPI. VSMCs were isolated form WT mice & treated with 1 μM Ang II for 24 h. bHif1a mRNA was measured by qPCR analysis. c HIF1 alpha protein was detected by western blot. **P < 0.01, ***P < 0.001, n = 3 per group, statistical significance was determined by the unpaired t-test Image collected & cropped by CiteAb from the following publication (https://pubmed.ncbi.nlm.nih.gov/31320613), licensed under a CC-BY license. Not internally tested by Novus Biologicals. [NB100-105] -")
Western Blot: HIF-1 alpha Antibody (H1alpha67) [NB100-105] -
Western Blot: HIF-1 alpha Antibody (H1alpha67) [NB100-105] - Hypoxia is implicated in the adaptive response after short-term bevacizumab treatment. Expression of HIF-1 alpha in pulmonary tumor nodules of the four groups. (A) A representative western blot is shown. beta -actin was used as a loading control. (B) While most tumors showed little expression of HIF-1 alpha protein in PBS & cisplatin groups, mice that received bevacizumab & bevacizumab + cisplatin therapy showed a markedly increased level of HIF-1 alpha expression.. *P < 0.05, **P < 0.01. Image collected & cropped by CiteAb from the following publication (https://pubmed.ncbi.nlm.nih.gov/22357313), licensed under a CC-BY license. Not internally tested by Novus Biologicals. [NB100-105] -")
Immunohistochemistry-Paraffin: HIF-1 alpha Antibody (H1alpha67) [NB100-105] -
Immunohistochemistry-Paraffin: HIF-1 alpha Antibody (H1alpha67) [NB100-105] - HIF-1alpha & CAIX expression in PDAC & adjacent normal pancreatic tissue. Adjacent normal exocrine pancreas with weak nuclear & cytoplasmic HIF-1alpha staining (a). Adjacent normal pancreatic tissue with weak membranous CAIX staining in the ducts & absent staining in exocrine pancreatic tissue (b). PDAC with weak (intensity 1) nuclear & cytoplasmic HIF-1alpha staining (c). PDAC with strong (intensity 3) nuclear & moderate (intensity 2) cytoplasmic HIF-1alpha staining (d). PDAC with weak to moderate (intensity 1–2) membranous CAIX staining (e). PDAC with strong (intensity 3) membranous CAIX staining (f) Image collected & cropped by CiteAb from the following publication (https://pubmed.ncbi.nlm.nih.gov/29973215), licensed under a CC-BY license. Not internally tested by Novus Biologicals. [NB100-105] -")
Immunohistochemistry: HIF-1 alpha Antibody (H1alpha67) [NB100-105] -
Immunohistochemistry: HIF-1 alpha Antibody (H1alpha67) [NB100-105] - DC101, evofosfamide, & low dose doxorubicin multimodal treatment of KP sarcomasA. Tumor volume of KP sarcomas. Groups were treated by intraperitoneal injection of control IgG 20 mg/kg 3 times per week, DC101 20 mg/kg 3 times per week, evofosfamide (Evo) 50 mg/kg 5 times per week, and/or low dose doxorubicin (Dox) 1 mg/kg 3 times per week. Photos B. & graphs C. of PCNA immunohistochemistry for proliferation, TUNEL immunofluorescence for apoptosis, CD31 immunohistochemistry for microvessel density, CD31 & TUNEL immunofluorescence for endothelial cell (EC)-specific apoptosis, & nuclear HIF-1 alpha immunohistochemistry for HIF-1 alpha activity. Bars represent standard deviation. **p < 0.05 compared to all other groups. Image collected & cropped by CiteAb from the following publication (https://www.oncotarget.com/lookup/doi/10.18632/oncotarget.10212), licensed under a CC-BY license. Not internally tested by Novus Biologicals. [NB100-105] -")
Western Blot: HIF-1 alpha Antibody (H1alpha67) [NB100-105] -
Western Blot: HIF-1 alpha Antibody (H1alpha67) [NB100-105] - Overexpression of HIF alpha proteins increases IL-1 alpha transcription in A549 & HeLa cells but not in WI-38 fibroblasts.(A) Western blot using anti-HIF-1 alpha or anti-HIF-2 alpha antibodies of nuclear fractions obtained from HEK-T293 cells transfected with the annotated vectors. WI-38 (B), A549 (C), or HeLa (D) cells were transfected with either control vector or with HIF-1 alpha (P402A/P564A) & HIF-2 alpha (P405A/P531A), & 24 h later were analyzed for IL-1 alpha & VEGF RQ of mRNA levels by real-time PCR. Graphs represent mean ± SEM of four independent experiments for each cell type. P values of HIF alpha -transfected cells vs. control (Ct) transfected are annotated in the graphs. Image collected & cropped by CiteAb from the following publication (https://pubmed.ncbi.nlm.nih.gov/23049530), licensed under a CC-BY license. Not internally tested by Novus Biologicals. [NB100-105] -")
Immunohistochemistry-Paraffin: HIF-1 alpha Antibody (H1alpha67) [NB100-105] -
Immunohistochemistry-Paraffin: HIF-1 alpha Antibody (H1alpha67) [NB100-105] - Effects of F2 on tumor-related biomarkers in vivoImmunohistochemical analysis of tumor-related proteins (HIF-1 alpha, VEGF, MMP-2, CD31 & KI67) in tumor sections from U87 xenograft mice treated with F2 (mg/kg i.g.). Red arrows indicate the related protein detected in the tissue samples. Values are means ± SEM of three experiments. * P<0.05 compared with DDW group. Image collected & cropped by CiteAb from the following publication (https://www.oncotarget.com/lookup/doi/10.18632/oncotarget.19654), licensed under a CC-BY license. Not internally tested by Novus Biologicals. [NB100-105] -")
Immunohistochemistry: HIF-1 alpha Antibody (H1alpha67) [NB100-105] -
Immunohistochemistry: HIF-1 alpha Antibody (H1alpha67) [NB100-105] - Immunohistochemical labeling of normal brain & glioma tissueRepresentative images of normal temporal lobe, anaplastic astrocytoma grade II & grade III (AAII & AAIII), & three GBMs with low, medium, & high labeling of (A) MAOB, (B) HiF-1 alpha, & (C) GFAP are shown, along with (D) Sp1 & e) Sp3. The antibodies were detected with DAB & the nuclei were labeled with hematoxylin. Each image in a column was taken from a single slide, where each tissue slice was treated identically & imaged using the same microscope setting & with no electronic image manipulation. Arrows indicate nuclear HiF-1 alpha. Image collected & cropped by CiteAb from the following publication (https://www.oncotarget.com/lookup/doi/10.18632/oncotarget.6582), licensed under a CC-BY license. Not internally tested by Novus Biologicals. [NB100-105] -")
Western Blot: HIF-1 alpha Antibody (H1alpha67) [NB100-105] -
Western Blot: HIF-1 alpha Antibody (H1alpha67) [NB100-105] - Expression of PACAP, VIP, VIPRs, HIF-1 alpha, HIF-2 alpha, & EGFR in glioblastoma multiforme (GBM). (A) Representative immunoblot of PACAP & VIP precursor peptides & PAC1R, VPAC1R, & VPAC2R expression on frozen glioblastoma sample. (B) Representative immunoblot & photomicrographs of signals detected by antibodies direct against HIF-1 alpha, HIF-2 alpha, & EGFR in a frozen glioblastoma sample. Image collected & cropped by CiteAb from the following publication (http://journal.frontiersin.org/Article/10.3389/fphar.2016.00139/abstract), licensed under a CC-BY license. Not internally tested by Novus Biologicals. [NB100-105] -")
Immunocytochemistry/ Immunofluorescence: HIF-1 alpha Antibody (H1alpha67) [NB100-105] -
Immunocytochemistry/ Immunofluorescence: HIF-1 alpha Antibody (H1alpha67) [NB100-105] - Regulation of cartilage degradation by HIF-1 alpha. (A) Amount of glycosaminoglycans released into the medium determined by the dimethylmethylene blue assay during 3 days culture of Hif1afl/fl (Cntl) & Col2a1-CreERT2;Hif1afl/fl (KO) femoral heads treated with or without 10 ng/mL IL-1 beta under the hypoxic condition (3% O2). Tamoxifen induction was performed three days before sacrifice. Bars show the mean ± SD of three samples per group. *P < 0.05. (B) Immunofluorescence of Mmp13, Hif2a, & Hif1a in the Cntl & KO femoral head cartilage after 3-day culture with or without 10 ng/mL IL-1 beta. Scale bars, 50 µm. Image collected & cropped by CiteAb from the following publication (https://pubmed.ncbi.nlm.nih.gov/32214220), licensed under a CC-BY license. Not internally tested by Novus Biologicals. [NB100-105] -")
Western Blot: HIF-1 alpha Antibody (H1alpha67) [NB100-105] -
Western Blot: HIF-1 alpha Antibody (H1alpha67) [NB100-105] - HIF1 alpha /PFKFB3 is upregulated in beta -cells of HIP rats & humans with type 2 diabetes. Representative immunofluorescence images of islets from a WT & HIP rats & b non-diabetic (ND) & T2D patients stained for PFKFB3 (red), insulin (green), & nuclei (blue). c Frequency of PFKFB3 positive beta -cells in HIP versus WT rats (left panel) & T2D versus ND patients (right panel). d Representative Western blot of PFKFB3 & HIF1 alpha levels in nuclear-enriched- & whole cell extracts from non-diabetic (ND) & T2D donor islets. Data are presented as mean ± SEM, n = 3 independent biological samples for each group. Statistical significance was analyzed by Student t-test (*p < 0.05, ***p < 0.001) Image collected & cropped by CiteAb from the following publication (https://pubmed.ncbi.nlm.nih.gov/31213603), licensed under a CC-BY license. Not internally tested by Novus Biologicals. [NB100-105] -")
Western Blot: HIF-1 alpha Antibody (H1alpha67) [NB100-105] -
Western Blot: HIF-1 alpha Antibody (H1alpha67) [NB100-105] - HIF-1 alpha & HIF-2 alpha expression is differentially modulated by Hsp90 inhibition in CCRCC cells. UMRC2 & 786-O cells were treated for 20 h with the Hsp90 inhibitors 17-AAG (1 μM), EC154 (100 nM), the HDAC inhibitor LBH589 (100 nM), or DMSO vehicle control. Nuclear protein was analyzed for HIF-1 alpha & HIF-2 alpha & cytosolic protein was analyzed for RACK1 by SDS-PAGE & Western blot. Topoisomerase II & GAPDH were used as nuclear & cytosolic loading controls, respectively. Bands corresponding to HIF-1 alpha & HIF-2 alpha Western blots were quantified, normalized to TOPOII, & are expressed as a percentage of control samples. Image collected & cropped by CiteAb from the following publication (https://pubmed.ncbi.nlm.nih.gov/22172030), licensed under a CC-BY license. Not internally tested by Novus Biologicals. [NB100-105] -")
Immunocytochemistry/ Immunofluorescence: HIF-1 alpha Antibody (H1alpha67) [NB100-105] -
Immunocytochemistry/ Immunofluorescence: HIF-1 alpha Antibody (H1alpha67) [NB100-105] - Comparison of MAOB expression, HiF-1 alpha expression, & peroxide generation in response to a MAOB substrate in normal human astrocytes & glioma cellsHiF-1 alpha (i, red), MAOB (ii, green), & superimposed HiF-1 alpha /MAOB signals with blue DAPI labeling (iii) of NHAs (A) & GBM cells (B). (C) Relative expression of HiF-1 alpha (white bars) & MAOB (black bars) in NHAs & in three GBM low-passage cultures, n = 6, mean ± SD. (D) MAOB inhibited (gray bars), endogenous (white bars) & 4-FBA-stimulated (black bars) reactive oxygen species (hydrogen peroxide) generation, shown as DCF per cell, in NHA & the three GBM cultures, n = 16, mean ± SD. Image collected & cropped by CiteAb from the following publication (https://www.oncotarget.com/lookup/doi/10.18632/oncotarget.6582), licensed under a CC-BY license. Not internally tested by Novus Biologicals. [NB100-105] -")
Western Blot: HIF-1 alpha Antibody (H1alpha67) [NB100-105] -
Western Blot: HIF-1 alpha Antibody (H1alpha67) [NB100-105] - HIF1 alpha is activated in VSMCs during Ang II-induced vascular remodeling.WT mice were infused with saline or 1000 ng/kg/min Ang II for 28 days. a Immunofluorescence analysis of representative cross-sections of mice aortas for HIF1 alpha (red) & alpha -SMA (green), nuclei was stained with DAPI. VSMCs were isolated form WT mice & treated with 1 μM Ang II for 24 h. bHif1a mRNA was measured by qPCR analysis. c HIF1 alpha protein was detected by western blot. **P < 0.01, ***P < 0.001, n = 3 per group, statistical significance was determined by the unpaired t-test Image collected & cropped by CiteAb from the following publication (https://pubmed.ncbi.nlm.nih.gov/31320613), licensed under a CC-BY license. Not internally tested by Novus Biologicals. [NB100-105] -")
Western Blot: HIF-1 alpha Antibody (H1alpha67) [NB100-105] -
Western Blot: HIF-1 alpha Antibody (H1alpha67) [NB100-105] - Effects of one- & five-dosage dry needling (1D, 5D) on iNOS, HIF-1 alpha, COX-2, & VEGF expressions in a needling-treated muscle. (a) Representative Western blot images. The quantification of the protein levels for (b) iNOS, (c) HIF-1 alpha, (d) COX-2, & (e) VEGF. Values are expressed as mean ± SD. *Indicates the significant difference (P < 0.05) between the sham groups (s1D & s5D). #Represents the significant difference (P < 0.05) between the 1D & 5D groups. DN: dry needling. Image collected & cropped by CiteAb from the following publication (https://pubmed.ncbi.nlm.nih.gov/23346198), licensed under a CC-BY license. Not internally tested by Novus Biologicals. [NB100-105] -")
Western Blot: HIF-1 alpha Antibody (H1alpha67) [NB100-105] -
Western Blot: HIF-1 alpha Antibody (H1alpha67) [NB100-105] - Effect of ENMD-1198 on tumor vascularization & tumor cell proliferation. A) Immunohistochemical analysis of tumor vascularization (CD31-positive vessels). Densitometric analysis of images from CD31-stained tissue sections from all tumors showed that vessel area was significantly reduced in ENMD-1198-treated tumors (*P < 0.01). B) ENMD-1198 significantly decreased the number of proliferating (BrdUrd-positive) tumor cells in tissue sections (*P < 0.01). For both vessel area & cell proliferation, representative images are illustrated. Results shown are the mean ± SEM. C) Western blot analysis for HIF-1 alpha expression in HCC tumors showed a substantial reduction of HIF-1 alpha in ENMD-1198 treated tumors. Image collected & cropped by CiteAb from the following publication (https://pubmed.ncbi.nlm.nih.gov/18651980), licensed under a CC-BY license. Not internally tested by Novus Biologicals. [NB100-105] -")
Immunohistochemistry-Paraffin: HIF-1 alpha Antibody (H1alpha67) [NB100-105] -
Immunohistochemistry-Paraffin: HIF-1 alpha Antibody (H1alpha67) [NB100-105] - Enhanced expression of glycolytic genes in livers of DEN-Wwox delta Hep mice.a mRNA expression levels of HIF1 alpha glycolytic target genes in DEN-treated control & Wwox delta Hep (cKO) mice at the age of 1 a, 3 b, 6 c & 10 d months (n = 3 for each group). e Immunohistochemical staining of HIF1 alpha, PKM2, & GLUT1 in 6 & 10 months of DEN-treated Wwox delta Hep & control liver tissues. Images were taken at × 40 magnification (Bar = 100μm). f ChIP experiment with HIF1 alpha antibody on DEN-treated control & Wwox delta Hep (cKO) mice followed by qRT-PCR analysis of HIF1 alpha target genes. * P value < 0.05, ** P value < 0.01, *** P value < 0.001. Error bars indicate ± SEM Image collected & cropped by CiteAb from the following publication (https://www.nature.com/articles/s41419-018-0510-4), licensed under a CC-BY license. Not internally tested by Novus Biologicals. [NB100-105] -")
Immunohistochemistry-Paraffin: HIF-1 alpha Antibody (H1alpha67) [NB100-105] -
Immunohistochemistry-Paraffin: HIF-1 alpha Antibody (H1alpha67) [NB100-105] - HIF-1alpha & CAIX expression in PDAC & adjacent normal pancreatic tissue. Adjacent normal exocrine pancreas with weak nuclear & cytoplasmic HIF-1alpha staining (a). Adjacent normal pancreatic tissue with weak membranous CAIX staining in the ducts & absent staining in exocrine pancreatic tissue (b). PDAC with weak (intensity 1) nuclear & cytoplasmic HIF-1alpha staining (c). PDAC with strong (intensity 3) nuclear & moderate (intensity 2) cytoplasmic HIF-1alpha staining (d). PDAC with weak to moderate (intensity 1–2) membranous CAIX staining (e). PDAC with strong (intensity 3) membranous CAIX staining (f) Image collected & cropped by CiteAb from the following publication (https://pubmed.ncbi.nlm.nih.gov/29973215), licensed under a CC-BY license. Not internally tested by Novus Biologicals. [NB100-105] -")
Chromatin Immunoprecipitation: HIF-1 alpha Antibody (H1alpha67) [NB100-105] -
Chromatin Immunoprecipitation: HIF-1 alpha Antibody (H1alpha67) [NB100-105] - Involvement of CBP in BNIP3 expression regulated by HIF-1 alpha & FOXO3 under hypoxia. (A) UCB-hMSCs were incubated with hypoxia condition for 24 h. Co-immunoprecipitation of HIF-1 alpha & FOXO3 with IgG & CBP were shown in left panel. IgG was used as a negative control. The total protein expressions of HIF-1 alpha, FOXO3, CBP & beta -actin in lysate were shown in right panel. n = 3. (B) CBP (20 μM) was pretreated to UCB-hMSCs, & cells were incubated with hypoxia for 24 h. The BNIP3 mRNA expression level was analyzed by qPCR. n = 6. (C) BNIP3 & beta -actin protein expressions were analyzed by western blot. Data represent mean ± S.E. n = 4. (D, E) Sample DNA was immuno-precipitated with RNA polymerase, IgG, HIF-1 alpha & FOXO3 specific antibodies. CHIP (top panel) & lysate (bottom panel) samples were amplified with the primers of GAPDH & BNIP3 promoters. Quantitative CHIP data was analyzed by qPCR, & shown in the right panel. n = 4. Western blot data were normalized by beta -actin, & qPCR data were normalized by ACTB mRNA expression level. Quantitative data are presented as a mean ± S.E.M. All blot images are representative. *p < 0.05 versus control, #p < 0.05 versus hypoxia. Image collected & cropped by CiteAb from the following publication (https://linkinghub.elsevier.com/retrieve/pii/S2213231717303804), licensed under a CC-BY license. Not internally tested by Novus Biologicals. [NB100-105] -")
Western Blot: HIF-1 alpha Antibody (H1alpha67) [NB100-105] -
Western Blot: HIF-1 alpha Antibody (H1alpha67) [NB100-105] - Lack of HIF-P4H-1 increases the amount of p53. (a) Western blot analysis of p53 in wt & Hif-p4h-1−/− MEFs cultured in 21% or 1% O2 for 24 h. (b,c) Western blot analysis of p53 in Hif-p4h-1 & scrambled (Scrm) siRNA transfected HEK293 cells (b) & wt MEFs treated with 50 µM FG4497 for 24 h (c). (d) qPCR analysis of p53 mRNA in wt & Hif-p4h-1−/− MEFs cultured in 21% or 1% O2 for 24 h. (e) Analysis of p53 protein turnover rate. Hif-p4h-1−/− & wt MEFs were treated with 200 μg/ml of cycloheximide for the indicated time points & whole cell lysates were blotted for p53. (f) Western blot analysis of MDM2 in wt & Hif-p4h-1−/− MEFs cultured in 21% or 1% O2 for 24 h. (g) Western blot analysis of p53 & MDM2 in wt MEFs treated with 10 μM nutlin-3a for 24 h with or without overexpression of human HIF-P4H-1 (OE). (h,i) Western blot analysis of HIF1 alpha in wt & Hif-p4h-1−/− MEFs cultured in 21% or 1% O2 for 24 h (h) & in scrambled & Hif-p4h-1 siRNA transfected HEK293 cells (i). (j) Western blot analysis of ubiquitination of p53 in Hif-p4h-1 & scrambled siRNA transfected HEK293 cells. The cells were transfected with HA-ubiquitin & endogenous p53 was immunoprecipitated followed by Western blotting with anti-HA & anti-P53 antibodies. (k) Western blot analysis of p53 in Hif-p4h-1−/− & wt MEFs were treated with or without 10 μM MG132 for 5 h. Data are presented as representative Western blots & as mean ± s.d., n = at least 3 individual MEF isolates or experiments. *P < 0.05, **P < 0.01 & ***P < 0.001, two-tailed Student’s t-test. Unprocessed original scans of blots are shown in Supplementary Fig. 5. Image collected & cropped by CiteAb from the following publication (https://www.nature.com/articles/s41598-017-17376-0), licensed under a CC-BY license. Not internally tested by Novus Biologicals. [NB100-105] -")
Western Blot: HIF-1 alpha Antibody (H1alpha67) [NB100-105] -
Western Blot: HIF-1 alpha Antibody (H1alpha67) [NB100-105] - HIF-1 alpha -mediated repression of ENT1 expression in Caki-1 cells under hypoxia. Comparison of HIF-1 alpha & HIF-2 alpha protein expression in human matched renal normal-tumor samples (n=11) (A) & 3 RCC cell lines (786-O, 769-P, Caki-1) under normoxia or hypoxia for 6 h (B). (C) Schematic diagram of two hypoxia response elements (HRE) in the promoter of ENT1. (D) CHIP-qPCR analysis of HIF-1 alpha at the promoter of ENT1 in Caki-1 cells, exposed under normoxia or hypoxia for 48 h. Two different HIF-1 alpha antibodies (610958, BD Biosciences; NB100-105, Novus) were used to pull down HIF-1 alpha. The protein expression level of HIF-1 alpha (E) & mRNA expression level of SLC29A1 (F) in Caki-1 under normoxia or hypoxia & HIF-1 alpha knockout-Caki-1 cells. (G) The expression level of ARNT1 (HIF-1 beta ) was detected in Caki-1, transfected with ARNT1 specific siRNAs or NC. Student's t test (two-tailed) was used. (H, I) The expression level of ENT1 in Caki-1, transfected with ARNT1 specific siRNAs or NC, under normoxia or hypoxia. Oneway-ANOVA analysis was used. The results are expressed as mean ± SEM (n=3). ***P<0.001. Image collected & cropped by CiteAb from the following publication (https://pubmed.ncbi.nlm.nih.gov/32206108), licensed under a CC-BY license. Not internally tested by Novus Biologicals. [NB100-105] -")
Western Blot: HIF-1 alpha Antibody (H1alpha67) [NB100-105] -
Western Blot: HIF-1 alpha Antibody (H1alpha67) [NB100-105] - L. donovani infection induces HIF-1 alpha expression in CD11chi splenic DCs in an IRF-5 dependent manner.Mice were infected with 2x10⁷ amastigotes intravenously. (A) Real-time PCR analysis of HIF-1 alpha mRNA expression in CD11c+ cells purified from C57BL/6 mice at various time points after infection. (B) Immunoblot analysis of HIF-1 alpha expression in CD11c+ cells from C57BL/6 mice (upper panel) & densitometric analysis normalized to beta -actin expression & expressed as fold increase to results obtained with naïve mice (lower panel). (C) Real-time PCR analysis of HIF-1 alpha expression in sorted CD11c+ cells from Irf-5flox/floxCre- & Irf-5flox/floxCMV-Cre+. (D) Immunoblot analysis of Hif-1 alpha expression in CD11c+ cells population of Irf5flox/floxCre- (left upper panel) & Irf-5flox/floxCMV-Cre+ (right upper panel), & densitometric analysis normalized to beta -actin expression & expressed as fold increase to results obtained with naïve mice (lower panels). (E) Real-time PCR analysis of Hif-1 alpha expression in CD11c- splenocytes from Irf-5flox/floxCre- & Irf-5flox/floxCMV-Cre+. (F) Real-time PCR analysis of HIF-1 alpha mRNA expression in BMDC from Irf-5flox/floxCMV-Cre+ & Cre- mice. All data represent mean ± SEM combined from 3 independent experiments. Image collected & cropped by CiteAb from the following publication (https://dx.plos.org/10.1371/journal.ppat.1004938), licensed under a CC-BY license. Not internally tested by Novus Biologicals. [NB100-105] -")
Western Blot: HIF-1 alpha Antibody (H1alpha67) [NB100-105] -
Western Blot: HIF-1 alpha Antibody (H1alpha67) [NB100-105] - Optical redox ratio (ORR) demonstrates reduced glycolytic phenotype following 24 hours of YC-1 treatment. ORR of A549 & A549RR cells before, 12 & 24 hours following 50 μM YC-1 treatment to inhibit HIF-1 (a,b). Immunoblotting for HIF-1 alpha (c) & PDK-1 (d) before & 24 hours following YC-1 treatment to verify in of HIF-1 alpha. Representative immunoblots were horizontally cropped at the molecular weight indicated (e). Uncropped exposures can be seen in Supplemental Fig. 1. Experiments were performed in triplicate across 3 independent experiments. *p < 0.05 compared to A549 0 hr control, †p < 0.05 compared to A549RR 0hrs. Scale bar in images represents 50 μm. ME – Main effect of cell type & time; however, no significant interactions were found between the two main effects. Image collected & cropped by CiteAb from the following publication (https://www.nature.com/articles/s41598-018-27262-y), licensed under a CC-BY license. Not internally tested by Novus Biologicals. [NB100-105] -")
Western Blot: HIF-1 alpha Antibody (H1alpha67) [NB100-105] -
Western Blot: HIF-1 alpha Antibody (H1alpha67) [NB100-105] - A beta facilitates HIF1 alpha synthesis & autophagy inhibition via mTOR activation. (A) SK-N-MC cells exposed to A beta (5 μM) for 0–48 h. HIF1 alpha & beta -actin expression analyzed by WB. n = 3. (B) Cells pretreated w/ NAC (1 mM) for 30 min prior to A beta treatment for 24 h. HIF1 alpha & beta -actin expression analyzed by WB. n = 3. (C,E) Cells incubated w/ rapamycin (10 nM) for 30 min prior to A beta treatment for 24 h. Phosphorylation of 4EBP1 (Thr 37/46) & 4EBP1, phosphorylation of p70S6K1 (Thr 389), HIF1 alpha & beta -actin analyzed by WB. n = 6. (D) Protein samples immunoprecipitated by eukaryotic translation initiation factor 4E (eIF4E) antibody-conjugated protein A/G agarose beads. Samples blotted w/ 4EBP1 & eIF4E-specific antibodies. n = 3. (F) Cells exposed to PF4708671 (10 μM) for 30 min prior to A beta treatment for 24 h. HIF1 alpha & beta -actin expression detected by WB. n = 6. (G) Cells exposed to cycloheximide (4 μM) for 30 min prior to A beta treatment for 24 h. HIF1 alpha & beta -actin expressions detected by WB. n = 6. (H) Cells pretreated w/ rapamycin (10 nM) for 30 min, incubated w/ A beta for 24 h & analyzed by WB w/ LC3, p62 & beta -actin specific antibodies. n = 3–6. (I) LC3 puncta visualized by confocal microscopy. Presented results merged images. Green & red fluorescents indicate LC3 & PI respectively. Scale bars, 50 μm (magnification × 600). (J) Cells pretreated w/ trehalose (10 μM) for 30 min prior to A beta treatment for 24 h. Cytotoxicity measured by MTT assay at an absorbance of 545 nm using a microplate reader. Data present the mean ± SE. n = 6. (K) Cell viability measured by trypan blue exclusion assay. Data presented as a mean ± SE. n = 6. Each blot image presented as representative image. *p < 0.05 vs. control, #p < 0.05 vs. A beta treatment. Image collected & cropped by CiteAb from the following publication (https://pubmed.ncbi.nlm.nih.gov/28790888), licensed under a CC-BY license. Not internally tested by Novus Biologicals. [NB100-105] -")
Western Blot: HIF-1 alpha Antibody (H1alpha67) [NB100-105] -
Western Blot: HIF-1 alpha Antibody (H1alpha67) [NB100-105] - FDFT1 inhibits glycolysis through suppressing AKT-mTOR-HIF1 alpha pathway in CRC.aFDFT1 overexpression reduced glucose uptake in CT26 cells. bFDFT1 overexpression decreased lactate production via glycolysis in CT26 cells. c ECAR reduced when FDFT1 overexpressed in CT26 cells. d OCR increased when FDFT1 overexpressed in CT26 cells. eFDFT1 knockdown increased glucose uptake in CT26 cells. fFDFT1 knockdown increased lactate production via glycolysis in CT26 cells. g ECAR increased when FDFT1 knocked down in CT26 cells. h OCR decreased when FDFT1 knocked down in CT26 cells. i, mFDFT1 overexpression inhibited protein & mRNA expression of mTOR-targeted glycolytic enzymes, including GLUT1, HK2, PGK1, GPI, & LDHA, in CT26 cells. j, mFDFT1 knockdown increased protein & mRNA expression of mTOR-targeted glycolytic enzymes, including GLUT1, HK2, PGK1, GPI, & LDHA, in CT26 cells. k, nFDFT1 overexpression decreased protein & mRNA expression of AKT, mTOR, & HIF1 alpha. l, nFDFT1 knockdown increased protein & mRNA expression of AKT, mTOR, & HIF1 alpha. o Photograph of dissected tumors (the first line: normal diet, second line: FMD + glucose, third line: FMD, n = 5). p The tumor volumes measured every 2 days after 13th day. The FMD + glucose group can reverse tumor growth inhibition induced by FMD (n = 5; ns: P = 0.1838; P = 0.0001). q The protein level of FDFT1 & mTOR in dissected tumor samples from normal diet group, FMD group & FMD + glucose group measured by western blotting. r The glucose level in these three groups. Error bars, mean ± SD, data are from three independent experiments. Two-sided t tests. *P < 0.05, **P < 0.01, ***P < 0.001, compared w/ control group (or normal diet group). #P < 0.05, ##P < 0.01. Image collected & cropped by CiteAb from following publication (https://pubmed.ncbi.nlm.nih.gov/32313017), licensed under a CC-BY license. Not internally tested by Novus Biologicals. [NB100-105] -")
Western Blot: HIF-1 alpha Antibody (H1alpha67) [NB100-105] -
Western Blot: HIF-1 alpha Antibody (H1alpha67) [NB100-105] - L. donovani infection induces HIF-1 alpha expression in CD11chi splenic DCs in an IRF-5 dependent manner.Mice were infected with 2x10⁷ amastigotes intravenously. (A) Real-time PCR analysis of HIF-1 alpha mRNA expression in CD11c+ cells purified from C57BL/6 mice at various time points after infection. (B) Immunoblot analysis of HIF-1 alpha expression in CD11c+ cells from C57BL/6 mice (upper panel) & densitometric analysis normalized to beta -actin expression & expressed as fold increase to results obtained with naïve mice (lower panel). (C) Real-time PCR analysis of HIF-1 alpha expression in sorted CD11c+ cells from Irf-5flox/floxCre- & Irf-5flox/floxCMV-Cre+. (D) Immunoblot analysis of Hif-1 alpha expression in CD11c+ cells population of Irf5flox/floxCre- (left upper panel) & Irf-5flox/floxCMV-Cre+ (right upper panel), & densitometric analysis normalized to beta -actin expression & expressed as fold increase to results obtained with naïve mice (lower panels). (E) Real-time PCR analysis of Hif-1 alpha expression in CD11c- splenocytes from Irf-5flox/floxCre- & Irf-5flox/floxCMV-Cre+. (F) Real-time PCR analysis of HIF-1 alpha mRNA expression in BMDC from Irf-5flox/floxCMV-Cre+ & Cre- mice. All data represent mean ± SEM combined from 3 independent experiments. Image collected & cropped by CiteAb from the following publication (https://dx.plos.org/10.1371/journal.ppat.1004938), licensed under a CC-BY license. Not internally tested by Novus Biologicals. [NB100-105] -")
Western Blot: HIF-1 alpha Antibody (H1alpha67) [NB100-105] -
Western Blot: HIF-1 alpha Antibody (H1alpha67) [NB100-105] - WNT11 is induced by hypoxia or hypoxic mimetics in different cell types.(A) Increased Wnt11 mRNA in EMSC adipocytes (Day 12) after hypoxia-mimetic treatments. EMSC adipocytes were treated with CoCl2 (0.1 mM), DFO (0.1 mM) or DMOG (0.1 mM) for 24 hrs. Values were normalized to Tbp mRNA & are expressed relative to control (n = 3). (B,C) Increased Wnt11 mRNA by hypoxia in EMSC preadipocytes & adipocytes (Day 0–12 after differentiation) (B), & C2C12 myoblast & myocyte (Day 0 & 8 after differentiation) (C). Wnt11 mRNA was assessed by quantitative PCR in cells exposed to air (21% O2) or hypoxia (1% O2) for 24 hrs. (n = 4). Values were normalized to Tbp mRNA & are expressed relative to 21% O2 samples (left panel). (D) Immunoblot analyses of HeLa cells under normal air or hypoxia for 24 hrs. (E,F) Induction of Wnt11 by increasing concentrations of DMOG in MDA-MB-231 cells (E) & 4T1 cells (F). (G) EMSCs treated with 0.1 mM DMOG for the indicated times. Wnt11 & Vegf mRNA expression was measured by qPCR & normalized to Tbp mRNA (n = 4). (H) WNT11 protein levels after DMOG treatment normalized to alpha -Tubulin (upper panel; n = 4). Representative immunoblots of EMSCs treated with 0.1 mM DMOG for the indicated times (Lower panel). (I) Protein expression in MDA-MB-231 cells treated with 0.1 mM DMOG. (J) Induction of Wnt11 promoter activity by hypoxia or hypoxia mimetics. pGL3-Wnt11 promoter plasmid was transfected into C2C12 cells. Cells were incubated with DMOG (left panel, n = 4) or under 21% O2 or 1% O2 (right panel, n = 8) for 24 hrs. For panels (A–C,G,H,J), values are mean ± s.e.m. *p < 0.05, **p < 0.01. For panels of immunoblotting, laminin, alpha -tubulin, & ERK were used as loading controls, WNT11 normalized to alpha -Tubulin was shown. Image collected & cropped by CiteAb from the following publication (https://www.nature.com/articles/srep21520), licensed under a CC-BY license. Not internally tested by Novus Biologicals. [NB100-105] -")
Western Blot: HIF-1 alpha Antibody (H1alpha67) [NB100-105] -
Western Blot: HIF-1 alpha Antibody (H1alpha67) [NB100-105] - Ccl7 is a HIF1 alpha direct target gene.a qPCR analysis of Ccl7 mRNA expression in Hif1afl/fl & Hif1a delta SMC VSMCs treated with vehicle, CoCl2, normoxia, or hypoxia (2% O2) for 6, 12, & 24 h. *P < 0.05, **P < 0.01, ***P < 0.001, n = 6 (independent experiments) per group. VSMCs isolated from Hif1afl/fl mice & Hif1a delta SMC mice were infected with oxygen-stable HIF1 alpha -expressing lentivirus, & then treated with Ang II for 24 h, bCcl7 mRNA was measured by qPCR & c CCL7 protein was detected by ELISA. d qPCR analysis of Ccl7 mRNA expression in vehicle or Ang II-treated Hif2afl/fl & Hif2a delta SMC VSMCs. e Schematic diagram of the mouse Ccl7 promoter illustrating the HREs in the regulatory region; the upstream regions were numbered in relation to the transcription initiation site. f Luciferase-reporter constructs under the control of the mouse Ccl7 promoter. HEK293T human embryonic kidney cells transiently transfected with the luciferase construct, & cotransfected with empty vector or HIF1a expression plasmids. Standard dual-luciferase assays were performed. EV, empty vector. **P < 0.01, n = 3. g, h ChIP assays of vehicle or Ang II-treated wild-type VSMCs using HIF1 alpha or HIF2 alpha antibodies. Data were normalized to input. *P < 0.05, **P < 0.01, n = 6 per group. i, j ChIP assays of vehicle or Ang II-treated Hif1afl/fl & Hif1a delta SMC VSMCs using HIF1 alpha antibody. Data were normalized to input. *P < 0.05, **P < 0.01, n = 6 per group. Statistical significance was determined by one-way ANOVA test followed by the unpaired t-test Image collected & cropped by CiteAb from the following publication (https://pubmed.ncbi.nlm.nih.gov/31320613), licensed under a CC-BY license. Not internally tested by Novus Biologicals. [NB100-105] -")
Immunohistochemistry: HIF-1 alpha Antibody (H1alpha67) [NB100-105] -
Immunohistochemistry: HIF-1 alpha Antibody (H1alpha67) [NB100-105] - Hypoxic/necrotic core in GemOE tumors enhances Ac-HMGB1 secretion(A–C) Adjacent sections from a GemOE tumor IHC stained for geminin (A), c-Abl (B) & HMGB1 (C). (D) The level of circulating HMGB1 measured using specific ELISA assay performed on serum isolated from samples collected 7 weeks after mice were injected in mammary fat pads with naïve HME cells (n = 10, no tumors developed) or GemOE cells (n = 30, tumor-bearing, p = 0.00042). Two different sets (E, G, I & K) & (F, H, J & L) of adjacent sections from GemOE orthotopic mammary tumors stained with H & E (E & F), or IHC stained for geminin (G & H), HMGB1 (I & J) as well as HIF-1 alpha (K) or hypoxyprobe (L). N denotes necrosis within these tumors that are shown adjacent to the hypoxic cells as indicated by high HIF-1 alpha or hypoxyprobe staining. These cells are also expressing cytoplasmic HMGB1. (M) The levels of HMGB1 detected using specific ELISA assay released from iGem9, iG197, iG240 or iG257 cells grown under normoxic (N) or hypoxic (H) conditions. Experiments were done in triplicates 3 different times, **represents p < 0.001. (N) The level of acetylated HMGB1 passively diffused from naïve HME, iG197, iG240 or iG257 cells after repeated freeze & thaw cycles. Image collected & cropped by CiteAb from the following publication (https://pubmed.ncbi.nlm.nih.gov/26989079), licensed under a CC-BY license. Not internally tested by Novus Biologicals. [NB100-105] -")
Western Blot: HIF-1 alpha Antibody (H1alpha67) [NB100-105] -
Western Blot: HIF-1 alpha Antibody (H1alpha67) [NB100-105] - A beta induces the expression of cell cycle regulatory proteins. (A) SK-N-MC cells were exposed to A beta (5 μM) for 24 h. The mRNA expression levels of CDK5, P35 & P39 were analyzed by real-time PCR. The mRNA expression level was normalized by beta -actin mRNA expression level. Data represent the mean ± SE. n = 4. (B)hif1 alpha specific- & non-targeting (NT) siRNA were transfected to the cells for 24 h prior to A beta treatment. Cyclin D1, CDK4, cyclin E, CDK2, HIF1 alpha & beta -actin was detected by western blot. n = 3. (C–F) Cells were pretreated with trehalose (10 μM), rapamycin (10 nM), PF4708671 (10 μM) & cycloheximide (4 μM) for 30 min prior to A beta treatment for 24 h. Cyclin D1, CDK4, cyclin E, CDK2 & beta -actin were detected by western blot. n = 3–6. (G) Mouse hippocampal neurons were transfected with hif1 alpha specific- & NT siRNAs for 24 h prior to A beta treatment for 24 h. Samples were blotted with Cyclin D1, CDK4, cyclin E, CDK2 & beta -actin specific antibodies. n = 3–6. (H) Mouse hippocampal neurons were pretreated with trehalose (10 μM) for 30 min & incubated with A beta for 24 h. cyclin D1, CDK4, cyclin E, CDK2, HIF1 alpha & beta -actin were analyzed by western blot. n = 3–6. Data are presented as a mean ± SE. *p < 0.05 vs. control, #p < 0.05 vs. A beta treatment. Image collected & cropped by CiteAb from the following publication (https://pubmed.ncbi.nlm.nih.gov/28790888), licensed under a CC-BY license. Not internally tested by Novus Biologicals. [NB100-105] -")
Western Blot: HIF-1 alpha Antibody (H1alpha67) [NB100-105] -
Western Blot: HIF-1 alpha Antibody (H1alpha67) [NB100-105] - Hypoxia induces expression of WNT11 through VHL.(A,B) Higher basal levels of WNT11 protein in Vhl-deleted cells (lenti-Cre infected Vhlf/f). EMSCs isolated from Vhlf/f mouse were infected with lentivirus carrying either GFP gene (for control) or Cre recombinase (for knockout). Non-infected cells were also used as a control. Immunoblot analysis of control or Vhl KO EMSCs treated with 0.1 mM DMOG (A), & EMSCs exposed to air (21% O2) or hypoxia (1% O2) for 24 hrs (B). Laminin, alpha -tubulin, & lamin A/C were used as loading controls, WNT11 normalized to alpha -Tubulin was shown. (C,D) Inactivation of the Vhl gene results in increased Wnt11 mRNA. Wnt11 & Vegf mRNA levels in liver (C) or duodenum (D) were measured by qPCR in Liver-VhlcKO or duodenum-VhlcKO & control mice (n = 5 per group). Values normalized to Tbp mRNA are expressed relative to tissues from control mice. For panels (C,D), values are mean ± s.e.m. *p < 0.05, **p < 0.01. Image collected & cropped by CiteAb from the following publication (https://www.nature.com/articles/srep21520), licensed under a CC-BY license. Not internally tested by Novus Biologicals. [NB100-105] -")
Immunocytochemistry/ Immunofluorescence: HIF-1 alpha Antibody (H1alpha67) [NB100-105] -
Immunocytochemistry/ Immunofluorescence: HIF-1 alpha Antibody (H1alpha67) [NB100-105] - QSCs are hypoxic in the niche & express HIF2A, but not HIF1A.(A) Timeline of in vivo pimonidazole labeling in SC-INTACT mice & representative confocal images of uninjured/resting EDL myofibers (n >50 myofibers from n = 3 mice) showing that nmGFP+ QSCs were pimonidazole+. Scale bars: 50 μm & 10 μm (insets). Inset images show that pimonidazole signals were relatively enriched in the cytoplasm of QSCs. Arrowheads indicate a QSC; asterisks indicate a myonucleus. (B) Percentage of pimonidazole+ QSCs. (C) Timeline of in vivo CCI-103F labeling in C57BL/6 mice & representative images of uninjured/resting EDL myofibers (n >50 myofibers from 3 mice) showing that nmGFP+ QSCs were CCI-103F+. Arrowheads indicate a QSC; asterisks indicate a myonucleus. Scale bar: 20 μm. (D) Percentage of CCI-103F+ QSCs. (E & F) Representative images of uninjured/resting EDL myofibers from C57BL/6 mice (n >50 myofibers from 6 mice/group) showing that most QSCs were HIF2A+, but HIF1A–. Scale bars: 10 μm. (G) Percentage of HIF1A+ & HIF2A+ QSCs. Data represent the mean ± SEM. Image collected & cropped by CiteAb from the following publication (https://www.jci.org/articles/view/96208), licensed under a CC-BY license. Not internally tested by Novus Biologicals. [NB100-105] -")
Western Blot: HIF-1 alpha Antibody (H1alpha67) [NB100-105] -
Western Blot: HIF-1 alpha Antibody (H1alpha67) [NB100-105] - FDFT1 inhibits glycolysis through suppressing AKT-mTOR-HIF1 alpha pathway in CRC.aFDFT1 overexpression reduced glucose uptake in CT26 cells. bFDFT1 overexpression decreased lactate production via glycolysis in CT26 cells. c ECAR reduced when FDFT1 overexpressed in CT26 cells. d OCR increased when FDFT1 overexpressed in CT26 cells. eFDFT1 knockdown increased glucose uptake in CT26 cells. fFDFT1 knockdown increased lactate production via glycolysis in CT26 cells. g ECAR increased when FDFT1 knocked down in CT26 cells. h OCR decreased when FDFT1 knocked down in CT26 cells. i, mFDFT1 overexpression inhibited protein & mRNA expression of mTOR-targeted glycolytic enzymes, including GLUT1, HK2, PGK1, GPI, & LDHA, in CT26 cells. j, mFDFT1 knockdown increased protein & mRNA expression of mTOR-targeted glycolytic enzymes, including GLUT1, HK2, PGK1, GPI, & LDHA, in CT26 cells. k, nFDFT1 overexpression decreased protein & mRNA expression of AKT, mTOR, & HIF1 alpha. l, nFDFT1 knockdown increased protein & mRNA expression of AKT, mTOR, & HIF1 alpha. o Photograph of dissected tumors (the first line: normal diet, second line: FMD + glucose, third line: FMD, n = 5). p The tumor volumes measured every 2 days after 13th day. The FMD + glucose group can reverse tumor growth inhibition induced by FMD (n = 5; ns: P = 0.1838; P = 0.0001). q The protein level of FDFT1 & mTOR in dissected tumor samples from normal diet group, FMD group & FMD + glucose group measured by western blotting. r The glucose level in these three groups. Error bars, mean ± SD, data are from three independent experiments. Two-sided t tests. *P < 0.05, **P < 0.01, ***P < 0.001, compared w/ control group (or normal diet group). #P < 0.05, ##P < 0.01. Image collected & cropped by CiteAb from following publication (https://pubmed.ncbi.nlm.nih.gov/32313017), licensed under a CC-BY license. Not internally tested by Novus Biologicals. [NB100-105] -")
Western Blot: HIF-1 alpha Antibody (H1alpha67) [NB100-105] -
Western Blot: HIF-1 alpha Antibody (H1alpha67) [NB100-105] - Role of HIF-1 alpha, FOXO3 in hypoxia-induced BNIP3 expression. (A) UCB-hMSCs were incubated with various durations of hypoxia (0–48 h). The protein expressions of HIF-1 alpha & beta -actin were detected by western blot. n = 4. (B) UCB-hMSCs were pretreated with NAC (5 mM) for 30 min prior to hypoxia incubation for 24 h. The protein expressions of HIF-1 alpha, lamin A/C & beta -tubulin in non-nuclear & nuclear fractionized cell samples were assessed by using western blot. n = 3. (C) UCB-hMSCs were immuno-stained with HIF-1 alpha & PI (magnification ×600). Scale bars, 37.5 µm. (D) HIF1A siRNA or NT siRNA was transfected to cells prior to hypoxia treatment for 24 h. The mRNA expression of BNIP3 was analyzed by qPCR. n = 6. (E) The protein expressions of BNIP3 & HIF-1 alpha were detected by western blot. n = 4. (F) NAC (5 mM) was pretreated to UCB-hMSCs prior to hypoxia treatment for 24 h. FOXO3, lamin A/C & beta -tubulin proteins expressions were assessed by western blot. n = 3. (G) FOXO3 siRNA transfected to UCB-hMSCs prior to hypoxia treatment for 24 h. The FOXO3 mRNA expression was measured by qPCR. n = 6. (H) BNIP3, FOXO3 & beta -actin expressions were detected by western blot. n = 3. Western blot data were normalized by beta -actin, & qPCR data were normalized by ACTB mRNA expression level. Lamin A/C & beta -tubulin were used as nuclear & non-nuclear protein controls, respectively. Quantitative data are presented as a mean ± S.E.M. All blots & confocal images are representative. *p < 0.05 versus control, #p < 0.05 versus hypoxia. Image collected & cropped by CiteAb from the following publication (https://linkinghub.elsevier.com/retrieve/pii/S2213231717303804), licensed under a CC-BY license. Not internally tested by Novus Biologicals. [NB100-105] -")
Western Blot: HIF-1 alpha Antibody (H1alpha67) [NB100-105] -
Western Blot: HIF-1 alpha Antibody (H1alpha67) [NB100-105] - ROS overproduction mediated apoptosis induced by combined treatment of DDP & HIF-1 alpha in PC-3 xenografts & cell culture. (a) ROS monitored by DHE (red) & nuclei by DAPI (blue) staining in PCa xenografts (scale bars, 50 µm). (b) MDA formation of PCa xenografts was examined after various treatments (c,d). PC-3 cells were treated with DDP, si-HIF-1 alpha plasmid, or both, in the presence or absence of NAC (5 mM) or DHLA (0.25 mM) for 24 h. Total lysates (c) & culture media (d) were used to detect cellular H2O2 level. (e,f) Western analysis for HIF-1 alpha as well as cleaved caspase-3 & PARP in PC-3 cells following various treatments. Data were presented as mean ± SD of three independent experiments. *p < 0.05 versus control group; #p < 0.05 versus si-HIF-1 alpha or DDP group; $p < 0.05 versus DDP/si-HIF-1 alpha group. The original blots are presented in Supplementary Figure 8. Image collected & cropped by CiteAb from the following publication (https://www.nature.com/articles/s41598-017-07973-4), licensed under a CC-BY license. Not internally tested by Novus Biologicals. [NB100-105] -")
Western Blot: HIF-1 alpha Antibody (H1alpha67) [NB100-105] -
Western Blot: HIF-1 alpha Antibody (H1alpha67) [NB100-105] - miR-128 downmodulation regulates MAFG increase in hypoxic condition both in vitro & in vivo. C2C12 cells exposed to hypoxia (2% O2) for 4 h, & miR-128 levels (a) determined by RT-qPCR on total RNAs after normalization w/ the small RNU6. Data are expressed as relative to values obtained in untreated control which set equal to 1. Each column in the panels represents the mean ± SD of 3 independent experiments. ∗p < 0.05. Western blotting analysis (b) of HIF-1 alpha, MAFG, & HMOX-1 performed on total extracts from the same cells, as described in Materials & Methods. Tubulin used as a loading control. mRNA levels of HMOX-1 & x-CT genes (c) determined by RT-qPCR on total RNAs, & relative changes calculated by comparing treated cells versus control, after normalization w/ c-ABL. Data reported as relative to values obtained in normoxia, which set equal to 1. Each column in the panel represents the mean ± SD of 3 independent experiments. ∗p < 0.05. Representative laser Doppler analysis (d) of blood flow before & 4 hours after (post 4 h) hindlimb ischemia procedure (n = 3-4 mice/group). Representative Western blot analysis & densitometric analysis (e) of MAFG & HMOX-1 protein levels performed on hindlimb muscle lysates from littermates after sham procedure (sham) or not-ischemic limb (NIL) & ischemic limb (IL) 4 h after femoral artieriectomy. Tubulin protein levels used as loading controls (∗p < 0.05 versus sham; n = 3-4 hindlimb/group). miR-128 levels (f) determined by RT-qPCR on total RNAs after normalization w/ the small RNU6. The values obtained in not-ischemic limb (NIL) set equal to 1. The data are expressed as the mean ± standard error & are representative of 3 independent experiments. ∗p < 0.05. Image collected & cropped by CiteAb from the following publication (https://pubmed.ncbi.nlm.nih.gov/29138682), licensed under a CC-BY license. Not internally tested by Novus Biologicals. [NB100-105] -")
Western Blot: HIF-1 alpha Antibody (H1alpha67) [NB100-105] -
Western Blot: HIF-1 alpha Antibody (H1alpha67) [NB100-105] - Effect of ENMD-1198 on HIF-1 alpha & VEGF expression in HCC cells. To determine effects of ENMD-1198 on nuclear HIF-1 alpha expression, HUH-7 cells were incubated for 16 h ± ENMD-1198 & subsequently exposed to hypoxia (1% O2, 4 h). A) Western blot analysis of whole protein showed that ENMD-1198 effectively blunted hypoxic induction of HIF-1 alpha protein. B) In addition, treatment with ENMD-1198 down-regulated constitutive VEGF-A mRNA levels in HCC cells (HepG2), as measured by real-time PCR (* P < 0.01) (n = 3/group). VEGF-A mRNA expression is normalized to beta -actin. C) ELISA analysis for VEGF in culture supernatants (HepG2). Hypoxia (20 h, 1% O2) markedly increased VEGF protein. ENMD-1198 treatment lowered VEGF secretion under hypoxic conditions (*P < 0.05). D) Western blot analysis for VEGF. Cells were incubated under either non-hypoxic, or hypoxic conditions ± ENMD-1198. Treatment with ENMD-1198 slightly lowered the hypoxic induction of VEGF, as determined by densitometry. Bars: SEM. Image collected & cropped by CiteAb from the following publication (https://pubmed.ncbi.nlm.nih.gov/18651980), licensed under a CC-BY license. Not internally tested by Novus Biologicals. [NB100-105] -")
Western Blot: HIF-1 alpha Antibody (H1alpha67) [NB100-105] -
Western Blot: HIF-1 alpha Antibody (H1alpha67) [NB100-105] - Upregulation of HIF-1 alpha in human PCa. (a) HIF-1 alpha protein was detected by western blot in nonmalignant (RWPE-1 & BPH1) & PCa cell lines (PC-3, DU145, LNCaP, & 22RV1) as indicated. (b–d) Total RNA extracted from RWPE-1, BPH1, PC-3, DU145, LNCaP, & 22RV1 cells was subjected to qRT-PCR for HIF-1 alpha (b), VEGF (c) & GLUT4 (d). (e) The HIF-1 alpha promoter-driven reporter (firefly luciferase) & a control vector (Renilla luciferase) were co-transfected into RWPE-1, BPH1, PC-3, DU145, LNCaP, & 22RV1 cells for measurement of luciferase activity. HIF-1 alpha promoter activity was calculated as a ratio of firefly to Renilla activity. (f) Human normal & malignant tissue (Gleason score 9) sections were probed with HIF-1 alpha antibody (scale bars, 100 µm). (g) Protein expression of HIF-1 alpha, VEGF, & GLUT4 were examined with western blot, in PC-3, DU145, & LNCaP cells after various treatments as indicated. Data are expressed as mean ± SD of seven independent experiments. $p < 0.05 versus RWPE-1 or BPH1 cells or normal tissue. *p < 0.05 versus control group. #p < 0.05 versus si-HIF-1 alpha or DDP group. Original blots are shown in Supplementary Figure 5. C: Ctrl; D: DDP; S: si-HIF-1 alpha ; D/S: DDP/si-HIF-1 alpha. Image collected & cropped by CiteAb from the following publication (https://www.nature.com/articles/s41598-017-07973-4), licensed under a CC-BY license. Not internally tested by Novus Biologicals. [NB100-105] -")
Western Blot: HIF-1 alpha Antibody (H1alpha67) [NB100-105] -
Western Blot: HIF-1 alpha Antibody (H1alpha67) [NB100-105] - Cx43-overexpressing cells regulate the expression of HIF-1 alpha, vascular endothelial growth factor (VEGF), & the proliferation of endothelial cells. (a) The expression of Cx43 & HIF-1 alpha was measured in Cx43-overexpressing cells by Western blot analysis. beta -actin expression served as loading controls for & total protein. Inserted values indicated relative proteins expression in comparison with beta -actin; (b) Cx43-overexpressing cells were cotransfected with pCLNCX-6× HRELuc & pTCYLacZ plasmids. At 6 h post-transfection, their luciferase activities were determined & normalized with beta -gal activity. Data shown were the mean ± SD (n = 4); (c) The conditioned medium of Cx43-overexpressing cells was measured by ELISA. Data shown were the mean ± SD (n = 4); & (d) The conditioned medium of Cx43-overexpressing cells reduced the proliferation of endothelial cells. The HEMC-1 cells treated with conditioned medium of Cx43-overexpressing cells were examined the proliferation activity. Cell viability was assessed by the WST-1 assay. Data shown were the mean ± SD (n = 4). * p < 0.05; *** p < 0.001. Image collected & cropped by CiteAb from the following publication (http://www.mdpi.com/1422-0067/16/1/439), licensed under a CC-BY license. Not internally tested by Novus Biologicals. [NB100-105] -")
Western Blot: HIF-1 alpha Antibody (H1alpha67) [NB100-105] -
Western Blot: HIF-1 alpha Antibody (H1alpha67) [NB100-105] - Prolonged hypoxia increases glutamine metabolism in PDAC cells, & HIF‐2 alpha can promote non‐canonical glutamine metabolism in chronic hypoxic conditions. (A) Time course of glutamine consumption at 1%, 3% or 20% O2, each time data point is an average of triplicate experiments. (B) Panc‐1 & Capan‐2 were incubated for 48 hrs at 1%, 3% or 20% O2, GLS1, GOT1 & GOT2 protein were measured by Western blot. beta ‐Actin was used as loading control. (C) Panc‐1 & Capan‐2 were incubated for 48 hrs at 1%, 3% or 20% O2, GLS1, GOT1 & GOT2 mRNA were measured by qRT‐PCR. Data are presented as mean ± S.D. from three independent experiments. (D & F) Si‐HIF‐2 alpha ‐transfected Panc‐1 & Capan‐2 cultured at 1% or 3%O2 for 48 hrs. The level of HIF‐2 alpha & glutamine metabolism enzymes mRNA & protein were determined by qRT‐PCR (mRNA) & Western blot (protein), & beta ‐actin was used as loading control. Data are presented as mean ± S.D. from three independent experiments. *P < 0.05, **P < 0.01. Image collected & cropped by CiteAb from the following publication (https://pubmed.ncbi.nlm.nih.gov/28544376), licensed under a CC-BY license. Not internally tested by Novus Biologicals. [NB100-105] -")
Western Blot: HIF-1 alpha Antibody (H1alpha67) [NB100-105] -
Western Blot: HIF-1 alpha Antibody (H1alpha67) [NB100-105] - HIF1 alpha & PFKFB3 are protective against hIAPP mediated beta -cell death. a Representative immunoblotting (left) & quantification (right) of the whole cell extract (WCE) from asynchronous INS 832/13 cells treated with either HIF1 alpha inhibitor KC7F2 (10 μM) or PFKFB3 siRNA (75 nM) for 56 h versus control. Cells were transduced with hIAPP adenovirus (75 MOI) or LacZ adenovirus as control (75 MOI) for last 32 h of culture. DMSO or CTRL siRNA, respectively were added to LacZ or hIAPP to equal DMSO or PFKFB3 siRNA used in experimental groups. GAPDH was used as a loading control. Data are presented as mean ± SEM, n = 4, *p < 0.05, **p < 0.01. b Quantification of DNA content distribution after FACS analysis of INS 832/13 cells treated as described in (a). Data are the mean ± SEM, n = 4, *p < 0.05, **p < 0.01. c The frequency of TUNEL positive INS 832/13 cells treated as described in (a). Data are the mean ± SEM, n = 4 in (a) & (b), & n = 3 independent experiments in (c). Statistical significance was analyzed by one-way ANOVA test with Tukey’s post-test (*p < 0.05, **p < 0.01). See Supplementary Fig. 10 for additional supportive data Image collected & cropped by CiteAb from the following publication (https://pubmed.ncbi.nlm.nih.gov/31213603), licensed under a CC-BY license. Not internally tested by Novus Biologicals. [NB100-105] -")
Immunohistochemistry: HIF-1 alpha Antibody (H1alpha67) [NB100-105] -
Immunohistochemistry: HIF-1 alpha Antibody (H1alpha67) [NB100-105] - Immunohistochemical & Western blot analysis of HIF-1 alpha & VEGF expression in OVA-challenged mice.(A & B) Immunostaining for HIF-1 alpha & VEGF in nasal mucosa following the last challenge. Positive HIF-1 alpha signals are brown & are predominantly nuclear & VEGF is predominantly cytoplasmic (magnification 400×, scale bar = 20 µm). (C & D) Representative Western blot analysis showing HIF-1 alpha & VEGF (with beta -actin as a loading control) expression in the nasal mucosa 24 h after the last challenge. All densitometric analyses are presented as the relative ratio of each molecule to beta -actin & the ratio in negative control mice was set to 100. Values represent means±SEM (n = 6 mice). *Significantly different from negative control, p<0.05; #significantly different from positive control, p<0.05. Image collected & cropped by CiteAb from the following publication (https://dx.plos.org/10.1371/journal.pone.0048618), licensed under a CC-BY license. Not internally tested by Novus Biologicals. [NB100-105] -")
Immunohistochemistry: HIF-1 alpha Antibody (H1alpha67) [NB100-105] -
Immunohistochemistry: HIF-1 alpha Antibody (H1alpha67) [NB100-105] - DC101, evofosfamide, & HIF-1 alpha shRNA treatment of HT1080 sarcomasA. Western blot of HT1080 cells stably transduced with HIF-1 alpha shRNA (sh.HIF-1 alpha ) or scrambled control shRNA (sh.Scr) & grown in 21% oxygen or 1% oxygen. beta -actin serves as loading control. B. Growth of HT1080 cells stably transduced with sh.HIF-1 alpha or sh.Scr in athymic nude mice. Groups were treated with control IgG 20 mg/kg 3 times per week, DC101 20 mg/kg 3 times per week, and/or evofosfamide (Evo) 50 mg/kg 5 times per week. C. Photos of H&E staining, cleaved caspase 3 IF, cleaved caspase 3 & CD31 IF, CD31 IHC, pimonidazole IHC, & HIF-1 alpha IHC. D. Graphs of microvessel density, pimondizale area, & nuclear HIF-1a expression. Bars represent standard deviation. **p < 0.05 compared to all other groups. Image collected & cropped by CiteAb from the following publication (https://www.oncotarget.com/lookup/doi/10.18632/oncotarget.10212), licensed under a CC-BY license. Not internally tested by Novus Biologicals. [NB100-105] -")
Western Blot: HIF-1 alpha Antibody (H1alpha67) [NB100-105] -
Western Blot: HIF-1 alpha Antibody (H1alpha67) [NB100-105] - WNT11 is induced by hypoxia or hypoxic mimetics in different cell types.(A) Increased Wnt11 mRNA in EMSC adipocytes (Day 12) after hypoxia-mimetic treatments. EMSC adipocytes were treated with CoCl2 (0.1 mM), DFO (0.1 mM) or DMOG (0.1 mM) for 24 hrs. Values were normalized to Tbp mRNA & are expressed relative to control (n = 3). (B,C) Increased Wnt11 mRNA by hypoxia in EMSC preadipocytes & adipocytes (Day 0–12 after differentiation) (B), & C2C12 myoblast & myocyte (Day 0 & 8 after differentiation) (C). Wnt11 mRNA was assessed by quantitative PCR in cells exposed to air (21% O2) or hypoxia (1% O2) for 24 hrs. (n = 4). Values were normalized to Tbp mRNA & are expressed relative to 21% O2 samples (left panel). (D) Immunoblot analyses of HeLa cells under normal air or hypoxia for 24 hrs. (E,F) Induction of Wnt11 by increasing concentrations of DMOG in MDA-MB-231 cells (E) & 4T1 cells (F). (G) EMSCs treated with 0.1 mM DMOG for the indicated times. Wnt11 & Vegf mRNA expression was measured by qPCR & normalized to Tbp mRNA (n = 4). (H) WNT11 protein levels after DMOG treatment normalized to alpha -Tubulin (upper panel; n = 4). Representative immunoblots of EMSCs treated with 0.1 mM DMOG for the indicated times (Lower panel). (I) Protein expression in MDA-MB-231 cells treated with 0.1 mM DMOG. (J) Induction of Wnt11 promoter activity by hypoxia or hypoxia mimetics. pGL3-Wnt11 promoter plasmid was transfected into C2C12 cells. Cells were incubated with DMOG (left panel, n = 4) or under 21% O2 or 1% O2 (right panel, n = 8) for 24 hrs. For panels (A–C,G,H,J), values are mean ± s.e.m. *p < 0.05, **p < 0.01. For panels of immunoblotting, laminin, alpha -tubulin, & ERK were used as loading controls, WNT11 normalized to alpha -Tubulin was shown. Image collected & cropped by CiteAb from the following publication (https://www.nature.com/articles/srep21520), licensed under a CC-BY license. Not internally tested by Novus Biologicals. [NB100-105] -")
Western Blot: HIF-1 alpha Antibody (H1alpha67) [NB100-105] -
Western Blot: HIF-1 alpha Antibody (H1alpha67) [NB100-105] - CAPE inhibits MCT-induced HIF-1 alpha expression & PDGF-BB production in rats. (A) Rats were treated with PBS or CAPE (5 or 10 mg/kg) from days 14–28 after MCT treatment 14 days (60 mg/kg). Preparation of lung tissues was analyzed by Western blot to determine the levels of HIF-1 alpha protein. Glyceraldehyde-3-phosphate dehydrogenase (GAPDH)was used as a loading control. (B) Serum levels of PDGF-BB in rat was assayed by an ELISA kit. (C) Representative images of immunohistochemical staining for HIF-1 alpha in lung sections from the rats. Scale bars, 50 μm. (D) Immunofluorescence staining of alpha-smooth muscle actin ( alpha -SMA) & HIF-1 alpha in lung sections from rats. Scale bars, 50 μm. Data in (A,B) are expressed as mean ± SEM of three independent experiments. *** p < 0.01, as compared with the PBS group. ### p < 0.01, as compared with the rats exposed to MCT alone. Results are representative of three rats per experimental group. Image collected & cropped by CiteAb from the following publication (https://pubmed.ncbi.nlm.nih.gov/30909527), licensed under a CC-BY license. Not internally tested by Novus Biologicals. [NB100-105] -")
Western Blot: HIF-1 alpha Antibody (H1alpha67) [NB100-105] -
Western Blot: HIF-1 alpha Antibody (H1alpha67) [NB100-105] - mTOR expression is inversely correlated with FDFT1 expression.aFDFT1 overexpression inhibited the protein level of mTOR, whereas FDFT1 knockdown increased the protein level of mTOR in CT26 & SW620 cells. bFDFT1 expression & mTOR expression were negatively correlated in CRC patient samples. Scale bar: 200 µm. c The mTOR silencing efficiency of the siRNA in CT26 & SW620 cells was validated by western blotting. d The effect of mTOR silencing on FDFT1 expression level in CT26 was evaluated by western blotting. e The protein level of mTOR when FDFT1 knockdown combined with or without mTOR inhibitor in CT26. f The protein level of pS6k, S6k, pS6, & S6 under the effect of fasting & FDFT1 overexpression in CRC cells. g, h CCK8 proliferation assays showed that the silencing of mTOR decreased the proliferation of CT26 & SW620 cells. k, n The silencing of mTOR reduced glucose uptake & lactate production in CT26 & SW620 cells. i, j, l, o The silencing of mTOR decreased the ECAR & increased the OCR in CT26 & SW620 cells. m The silencing of mTOR decreased the expression of AKT, HIF1 alpha, & proteins encoded by relevant glycolytic genes, such as GLUT1, HK2, LDHA, GPI, PGK1, in CT26 & SW620 cells. p–t Based on TCGA data set analysis, mTOR expression was positively correlated with AKT1, HIF1 alpha, GLUT1, HK2, & LDHA expression. Error bars, mean ± SD, the data are from three independent experiments. Two-sided t tests. *P < 0.05, **P < 0.01, ***P < 0.001, compared with the control group. Image collected & cropped by CiteAb from the following publication (https://pubmed.ncbi.nlm.nih.gov/32313017), licensed under a CC-BY license. Not internally tested by Novus Biologicals. [NB100-105] -")
Chromatin Immunoprecipitation: HIF-1 alpha Antibody (H1alpha67) [NB100-105] -
Chromatin Immunoprecipitation: HIF-1 alpha Antibody (H1alpha67) [NB100-105] - HIF-1 alpha -mediated repression of ENT1 expression in Caki-1 cells under hypoxia. Comparison of HIF-1 alpha & HIF-2 alpha protein expression in human matched renal normal-tumor samples (n=11) (A) & 3 RCC cell lines (786-O, 769-P, Caki-1) under normoxia or hypoxia for 6 h (B). (C) Schematic diagram of two hypoxia response elements (HRE) in the promoter of ENT1. (D) CHIP-qPCR analysis of HIF-1 alpha at the promoter of ENT1 in Caki-1 cells, exposed under normoxia or hypoxia for 48 h. Two different HIF-1 alpha antibodies (610958, BD Biosciences; NB100-105, Novus) were used to pull down HIF-1 alpha. The protein expression level of HIF-1 alpha (E) & mRNA expression level of SLC29A1 (F) in Caki-1 under normoxia or hypoxia & HIF-1 alpha knockout-Caki-1 cells. (G) The expression level of ARNT1 (HIF-1 beta ) was detected in Caki-1, transfected with ARNT1 specific siRNAs or NC. Student's t test (two-tailed) was used. (H, I) The expression level of ENT1 in Caki-1, transfected with ARNT1 specific siRNAs or NC, under normoxia or hypoxia. Oneway-ANOVA analysis was used. The results are expressed as mean ± SEM (n=3). ***P<0.001. Image collected & cropped by CiteAb from the following publication (https://pubmed.ncbi.nlm.nih.gov/32206108), licensed under a CC-BY license. Not internally tested by Novus Biologicals. [NB100-105] -")
Western Blot: HIF-1 alpha Antibody (H1alpha67) [NB100-105] -
Western Blot: HIF-1 alpha Antibody (H1alpha67) [NB100-105] - Upregulation of HIF-1 alpha in human PCa. (a) HIF-1 alpha protein was detected by western blot in nonmalignant (RWPE-1 & BPH1) & PCa cell lines (PC-3, DU145, LNCaP, & 22RV1) as indicated. (b–d) Total RNA extracted from RWPE-1, BPH1, PC-3, DU145, LNCaP, & 22RV1 cells was subjected to qRT-PCR for HIF-1 alpha (b), VEGF (c) & GLUT4 (d). (e) The HIF-1 alpha promoter-driven reporter (firefly luciferase) & a control vector (Renilla luciferase) were co-transfected into RWPE-1, BPH1, PC-3, DU145, LNCaP, & 22RV1 cells for measurement of luciferase activity. HIF-1 alpha promoter activity was calculated as a ratio of firefly to Renilla activity. (f) Human normal & malignant tissue (Gleason score 9) sections were probed with HIF-1 alpha antibody (scale bars, 100 µm). (g) Protein expression of HIF-1 alpha, VEGF, & GLUT4 were examined with western blot, in PC-3, DU145, & LNCaP cells after various treatments as indicated. Data are expressed as mean ± SD of seven independent experiments. $p < 0.05 versus RWPE-1 or BPH1 cells or normal tissue. *p < 0.05 versus control group. #p < 0.05 versus si-HIF-1 alpha or DDP group. Original blots are shown in Supplementary Figure 5. C: Ctrl; D: DDP; S: si-HIF-1 alpha ; D/S: DDP/si-HIF-1 alpha. Image collected & cropped by CiteAb from the following publication (https://www.nature.com/articles/s41598-017-07973-4), licensed under a CC-BY license. Not internally tested by Novus Biologicals. [NB100-105] -")
Western Blot: HIF-1 alpha Antibody (H1alpha67) [NB100-105] -
Western Blot: HIF-1 alpha Antibody (H1alpha67) [NB100-105] - Upregulation of HIF-1 alpha in the spleen restricts CD8+ T cell expansion.(A-B) Mice were infected with 2x10⁷ amastigotes intravenously & euthanized at various time points after infection. HIF-1 alpha expression in splenocytes was assessed by real-time PCR (A) & immunoblot analysis (B). (C-F) 2x10⁴ OT-I CD8+ T cells were adoptively transferred into recipient mice a day prior to infection with ovalbumin-transgenic (PINK) L. donovani amastigotes. (C) Graphs represent the average number of OT-I CD8+ T cells found in the spleen from Hif1aflox/flox & Hif1a+/-mice at d7 & d14 p.i.. (D) Percentage of OT-I CD8+ T cells at d7 & d14 p.i.. (E) Percentage of gated OT-I CD8+ expressing CD62Llo/int & negative for CD127. (F) Percentage of OT-I CD8+ T cells that were CD44+ CD127+CD62Lhi. All data represent mean ± SEM of one of 3 independent experiments, n = 5. * denotes p<0.05 & ** denotes p<0.01. Image collected & cropped by CiteAb from the following publication (https://dx.plos.org/10.1371/journal.ppat.1004938), licensed under a CC-BY license. Not internally tested by Novus Biologicals. [NB100-105] -")
Western Blot: HIF-1 alpha Antibody (H1alpha67) [NB100-105] -
Western Blot: HIF-1 alpha Antibody (H1alpha67) [NB100-105] - Ccl7 is a HIF1 alpha direct target gene.a qPCR analysis of Ccl7 mRNA expression in Hif1afl/fl & Hif1a delta SMC VSMCs treated with vehicle, CoCl2, normoxia, or hypoxia (2% O2) for 6, 12, & 24 h. *P < 0.05, **P < 0.01, ***P < 0.001, n = 6 (independent experiments) per group. VSMCs isolated from Hif1afl/fl mice & Hif1a delta SMC mice were infected with oxygen-stable HIF1 alpha -expressing lentivirus, & then treated with Ang II for 24 h, bCcl7 mRNA was measured by qPCR & c CCL7 protein was detected by ELISA. d qPCR analysis of Ccl7 mRNA expression in vehicle or Ang II-treated Hif2afl/fl & Hif2a delta SMC VSMCs. e Schematic diagram of the mouse Ccl7 promoter illustrating the HREs in the regulatory region; the upstream regions were numbered in relation to the transcription initiation site. f Luciferase-reporter constructs under the control of the mouse Ccl7 promoter. HEK293T human embryonic kidney cells transiently transfected with the luciferase construct, & cotransfected with empty vector or HIF1a expression plasmids. Standard dual-luciferase assays were performed. EV, empty vector. **P < 0.01, n = 3. g, h ChIP assays of vehicle or Ang II-treated wild-type VSMCs using HIF1 alpha or HIF2 alpha antibodies. Data were normalized to input. *P < 0.05, **P < 0.01, n = 6 per group. i, j ChIP assays of vehicle or Ang II-treated Hif1afl/fl & Hif1a delta SMC VSMCs using HIF1 alpha antibody. Data were normalized to input. *P < 0.05, **P < 0.01, n = 6 per group. Statistical significance was determined by one-way ANOVA test followed by the unpaired t-test Image collected & cropped by CiteAb from the following publication (https://pubmed.ncbi.nlm.nih.gov/31320613), licensed under a CC-BY license. Not internally tested by Novus Biologicals. [NB100-105] -")
Western Blot: HIF-1 alpha Antibody (H1alpha67) [NB100-105] -
Western Blot: HIF-1 alpha Antibody (H1alpha67) [NB100-105] - WNT11 is induced by hypoxia or hypoxic mimetics in different cell types.(A) Increased Wnt11 mRNA in EMSC adipocytes (Day 12) after hypoxia-mimetic treatments. EMSC adipocytes were treated with CoCl2 (0.1 mM), DFO (0.1 mM) or DMOG (0.1 mM) for 24 hrs. Values were normalized to Tbp mRNA & are expressed relative to control (n = 3). (B,C) Increased Wnt11 mRNA by hypoxia in EMSC preadipocytes & adipocytes (Day 0–12 after differentiation) (B), & C2C12 myoblast & myocyte (Day 0 & 8 after differentiation) (C). Wnt11 mRNA was assessed by quantitative PCR in cells exposed to air (21% O2) or hypoxia (1% O2) for 24 hrs. (n = 4). Values were normalized to Tbp mRNA & are expressed relative to 21% O2 samples (left panel). (D) Immunoblot analyses of HeLa cells under normal air or hypoxia for 24 hrs. (E,F) Induction of Wnt11 by increasing concentrations of DMOG in MDA-MB-231 cells (E) & 4T1 cells (F). (G) EMSCs treated with 0.1 mM DMOG for the indicated times. Wnt11 & Vegf mRNA expression was measured by qPCR & normalized to Tbp mRNA (n = 4). (H) WNT11 protein levels after DMOG treatment normalized to alpha -Tubulin (upper panel; n = 4). Representative immunoblots of EMSCs treated with 0.1 mM DMOG for the indicated times (Lower panel). (I) Protein expression in MDA-MB-231 cells treated with 0.1 mM DMOG. (J) Induction of Wnt11 promoter activity by hypoxia or hypoxia mimetics. pGL3-Wnt11 promoter plasmid was transfected into C2C12 cells. Cells were incubated with DMOG (left panel, n = 4) or under 21% O2 or 1% O2 (right panel, n = 8) for 24 hrs. For panels (A–C,G,H,J), values are mean ± s.e.m. *p < 0.05, **p < 0.01. For panels of immunoblotting, laminin, alpha -tubulin, & ERK were used as loading controls, WNT11 normalized to alpha -Tubulin was shown. Image collected & cropped by CiteAb from the following publication (https://www.nature.com/articles/srep21520), licensed under a CC-BY license. Not internally tested by Novus Biologicals. [NB100-105] -")
Immunocytochemistry/ Immunofluorescence: HIF-1 alpha Antibody (H1alpha67) [NB100-105] -
Immunocytochemistry/ Immunofluorescence: HIF-1 alpha Antibody (H1alpha67) [NB100-105] - CAPE inhibits MCT-induced HIF-1 alpha expression & PDGF-BB production in rats. (A) Rats were treated with PBS or CAPE (5 or 10 mg/kg) from days 14–28 after MCT treatment 14 days (60 mg/kg). Preparation of lung tissues was analyzed by Western blot to determine the levels of HIF-1 alpha protein. Glyceraldehyde-3-phosphate dehydrogenase (GAPDH)was used as a loading control. (B) Serum levels of PDGF-BB in rat was assayed by an ELISA kit. (C) Representative images of immunohistochemical staining for HIF-1 alpha in lung sections from the rats. Scale bars, 50 μm. (D) Immunofluorescence staining of alpha-smooth muscle actin ( alpha -SMA) & HIF-1 alpha in lung sections from rats. Scale bars, 50 μm. Data in (A,B) are expressed as mean ± SEM of three independent experiments. *** p < 0.01, as compared with the PBS group. ### p < 0.01, as compared with the rats exposed to MCT alone. Results are representative of three rats per experimental group. Image collected & cropped by CiteAb from the following publication (https://pubmed.ncbi.nlm.nih.gov/30909527), licensed under a CC-BY license. Not internally tested by Novus Biologicals. [NB100-105] -")
Western Blot: HIF-1 alpha Antibody (H1alpha67) [NB100-105] -
Western Blot: HIF-1 alpha Antibody (H1alpha67) [NB100-105] - Role of HIF-1 alpha, FOXO3 in hypoxia-induced BNIP3 expression. (A) UCB-hMSCs were incubated with various durations of hypoxia (0–48 h). The protein expressions of HIF-1 alpha & beta -actin were detected by western blot. n = 4. (B) UCB-hMSCs were pretreated with NAC (5 mM) for 30 min prior to hypoxia incubation for 24 h. The protein expressions of HIF-1 alpha, lamin A/C & beta -tubulin in non-nuclear & nuclear fractionized cell samples were assessed by using western blot. n = 3. (C) UCB-hMSCs were immuno-stained with HIF-1 alpha & PI (magnification ×600). Scale bars, 37.5 µm. (D) HIF1A siRNA or NT siRNA was transfected to cells prior to hypoxia treatment for 24 h. The mRNA expression of BNIP3 was analyzed by qPCR. n = 6. (E) The protein expressions of BNIP3 & HIF-1 alpha were detected by western blot. n = 4. (F) NAC (5 mM) was pretreated to UCB-hMSCs prior to hypoxia treatment for 24 h. FOXO3, lamin A/C & beta -tubulin proteins expressions were assessed by western blot. n = 3. (G) FOXO3 siRNA transfected to UCB-hMSCs prior to hypoxia treatment for 24 h. The FOXO3 mRNA expression was measured by qPCR. n = 6. (H) BNIP3, FOXO3 & beta -actin expressions were detected by western blot. n = 3. Western blot data were normalized by beta -actin, & qPCR data were normalized by ACTB mRNA expression level. Lamin A/C & beta -tubulin were used as nuclear & non-nuclear protein controls, respectively. Quantitative data are presented as a mean ± S.E.M. All blots & confocal images are representative. *p < 0.05 versus control, #p < 0.05 versus hypoxia. Image collected & cropped by CiteAb from the following publication (https://linkinghub.elsevier.com/retrieve/pii/S2213231717303804), licensed under a CC-BY license. Not internally tested by Novus Biologicals. [NB100-105] -")
Western Blot: HIF-1 alpha Antibody (H1alpha67) [NB100-105] -
Western Blot: HIF-1 alpha Antibody (H1alpha67) [NB100-105] - Cx43-knockdown cells regulate the expression of HIF-1 alpha, c-Src, VEGF & the proliferation of endothelial cells. (a) The expression of Cx43, c-Src, & HIF-1 alpha was measured in Cx43-knocknown cells by Western blot analysis. beta -actin expression served as loading controls for & total protein. Inserted values indicated relative protein expression in comparison with beta -actin; (b) Cx43-knockdown cells were cotransfected with pCLNCX-6× HRELuc & pTCYLacZ plasmids. Then, cells were treated with 100 ng/μL PP2 or DMSO for 1 h. At 6 h post-transfection, their luciferase activities were determined & normalized with beta -gal activity. Data shown were the mean ± SD (n = 4); (c) The conditioned medium of Cx43-knockdown cells was measured by ELISA. Data shown were the mean ± SD (n = 4); (d) The conditioned medium of Cx43-knockdown cells reduced the proliferation of endothelial cells. The HEMC-1 cells treated with conditioned medium of Cx43-knockdown cells were examined for proliferation activity. Cell viability was assessed by the WST-1 assay. Data shown were the mean ± SD (n = 4). * p < 0.05; ** p < 0.01; *** p < 0.001. Image collected & cropped by CiteAb from the following publication (http://www.mdpi.com/1422-0067/16/1/439), licensed under a CC-BY license. Not internally tested by Novus Biologicals. [NB100-105] -")
Western Blot: HIF-1 alpha Antibody (H1alpha67) [NB100-105] -
Western Blot: HIF-1 alpha Antibody (H1alpha67) [NB100-105] - Involvement of CBP in BNIP3 expression regulated by HIF-1 alpha & FOXO3 under hypoxia. (A) UCB-hMSCs were incubated with hypoxia condition for 24 h. Co-immunoprecipitation of HIF-1 alpha & FOXO3 with IgG & CBP were shown in left panel. IgG was used as a negative control. The total protein expressions of HIF-1 alpha, FOXO3, CBP & beta -actin in lysate were shown in right panel. n = 3. (B) CBP (20 μM) was pretreated to UCB-hMSCs, & cells were incubated with hypoxia for 24 h. The BNIP3 mRNA expression level was analyzed by qPCR. n = 6. (C) BNIP3 & beta -actin protein expressions were analyzed by western blot. Data represent mean ± S.E. n = 4. (D, E) Sample DNA was immuno-precipitated with RNA polymerase, IgG, HIF-1 alpha & FOXO3 specific antibodies. CHIP (top panel) & lysate (bottom panel) samples were amplified with the primers of GAPDH & BNIP3 promoters. Quantitative CHIP data was analyzed by qPCR, & shown in the right panel. n = 4. Western blot data were normalized by beta -actin, & qPCR data were normalized by ACTB mRNA expression level. Quantitative data are presented as a mean ± S.E.M. All blot images are representative. *p < 0.05 versus control, #p < 0.05 versus hypoxia. Image collected & cropped by CiteAb from the following publication (https://linkinghub.elsevier.com/retrieve/pii/S2213231717303804), licensed under a CC-BY license. Not internally tested by Novus Biologicals. [NB100-105] -")
Immunohistochemistry: HIF-1 alpha Antibody (H1alpha67) [NB100-105] -
Immunohistochemistry: HIF-1 alpha Antibody (H1alpha67) [NB100-105] - Precision quantitative image analysis workflow for the characterization of functional ITH.(a) Representative areas with positive immunohistochemical (IHC) staining for HIF-1 alpha, HIF-2 alpha, phospho-mTOR S2448, phospho-S6RP S235/236 & Ki-67. Only nuclear HIF-1 alpha & HIF-2 alpha expression was included in the analysis. Scale bar, 100 μm. (b) Overview of the quantitative IHC analysis process using a representative image of a whole-slide scanned pT1M1 tumour after phospho-mTOR S2448 staining. The image was overlaid with a virtual grid consisting of 1 mm2 squares that defines the tumour regions to be analysed. Non-cancerous tissue was subtracted manually (dark grey) & a positive pixel count was performed on the corrected area. Positivity per square was expressed as percentage of positive pixels. If a square contained non-tumorous tissue, the positivity was normalized to the corrected square area. Computed values were depicted as a heat map. Coloured squares represent tumour, whereas open squares indicate completely non-tumorous areas. Squares defined as peripheral tumour zone are marked by a black line. Scale bar, 1 cm. Image collected & cropped by CiteAb from the following publication (https://pubmed.ncbi.nlm.nih.gov/27291893), licensed under a CC-BY license. Not internally tested by Novus Biologicals. [NB100-105] -")
Western Blot: HIF-1 alpha Antibody (H1alpha67) [NB100-105] -
Western Blot: HIF-1 alpha Antibody (H1alpha67) [NB100-105] - ROS overproduction mediated apoptosis induced by combined treatment of DDP & HIF-1 alpha in PC-3 xenografts & cell culture. (a) ROS monitored by DHE (red) & nuclei by DAPI (blue) staining in PCa xenografts (scale bars, 50 µm). (b) MDA formation of PCa xenografts was examined after various treatments (c,d). PC-3 cells were treated with DDP, si-HIF-1 alpha plasmid, or both, in the presence or absence of NAC (5 mM) or DHLA (0.25 mM) for 24 h. Total lysates (c) & culture media (d) were used to detect cellular H2O2 level. (e,f) Western analysis for HIF-1 alpha as well as cleaved caspase-3 & PARP in PC-3 cells following various treatments. Data were presented as mean ± SD of three independent experiments. *p < 0.05 versus control group; #p < 0.05 versus si-HIF-1 alpha or DDP group; $p < 0.05 versus DDP/si-HIF-1 alpha group. The original blots are presented in Supplementary Figure 8. Image collected & cropped by CiteAb from the following publication (https://www.nature.com/articles/s41598-017-07973-4), licensed under a CC-BY license. Not internally tested by Novus Biologicals. [NB100-105] -")
Immunocytochemistry/ Immunofluorescence: HIF-1 alpha Antibody (H1alpha67) [NB100-105] -
Immunocytochemistry/ Immunofluorescence: HIF-1 alpha Antibody (H1alpha67) [NB100-105] - Regulation of OA development by HIF-1 alpha. Plain radiographs of the entire bodies at 8 weeks of age (A), & knee joints 8 weeks after OA surgery (B) of Cntl & cKO littermates. Scale bars, 10 mm & 1 mm, respectively. (C) Safranin O & TUNEL staining’s of Cntl & KO knee joints at 8 weeks after OA surgery (n = 9 & 11, respectively). Tamoxifen induction was performed at 7 weeks. Inset boxes in top images indicate the regions of high magnification Safranin O & TUNEL images. Inset boxes in middle images indicate the regions of immunofluorescence in (G). White dotted lines in TUNEL images indicate the cartilage area. Scale bars, 400 µm & 100 µm, respectively. (D) OARSI (Osteoarthritis Research Society International) score of OA development. Lines show the mean ± SD. *P < 0.05. (E) Rate of TUNEL-positive cells in the cartilage area. Bars show the mean ± SD. *P < 0.05. (F) mRNA levels of Hif1a in articular cartilage tissues of Cntl & KO. Bars show the mean ± SD. *P < 0.05. (G) Immunofluorescence of Hif1a, Mmp13, Hif2a, I kappa B alpha, Ser 32 & 36 dual phosphorylated I kappa B alpha, Rela, & C1qtnf3. Scale bars, 20 µm. The percentage of positive cells in the immunofluorescence is shown below. *P < 0.05. Image collected & cropped by CiteAb from the following publication (https://pubmed.ncbi.nlm.nih.gov/32214220), licensed under a CC-BY license. Not internally tested by Novus Biologicals. [NB100-105] -")
Western Blot: HIF-1 alpha Antibody (H1alpha67) [NB100-105] -
Western Blot: HIF-1 alpha Antibody (H1alpha67) [NB100-105] - A beta facilitates HIF1 alpha synthesis & autophagy inhibition via mTOR activation. (A) SK-N-MC cells exposed to A beta (5 μM) for 0–48 h. HIF1 alpha & beta -actin expression analyzed by WB. n = 3. (B) Cells pretreated w/ NAC (1 mM) for 30 min prior to A beta treatment for 24 h. HIF1 alpha & beta -actin expression analyzed by WB. n = 3. (C,E) Cells incubated w/ rapamycin (10 nM) for 30 min prior to A beta treatment for 24 h. Phosphorylation of 4EBP1 (Thr 37/46) & 4EBP1, phosphorylation of p70S6K1 (Thr 389), HIF1 alpha & beta -actin analyzed by WB. n = 6. (D) Protein samples immunoprecipitated by eukaryotic translation initiation factor 4E (eIF4E) antibody-conjugated protein A/G agarose beads. Samples blotted w/ 4EBP1 & eIF4E-specific antibodies. n = 3. (F) Cells exposed to PF4708671 (10 μM) for 30 min prior to A beta treatment for 24 h. HIF1 alpha & beta -actin expression detected by WB. n = 6. (G) Cells exposed to cycloheximide (4 μM) for 30 min prior to A beta treatment for 24 h. HIF1 alpha & beta -actin expressions detected by WB. n = 6. (H) Cells pretreated w/ rapamycin (10 nM) for 30 min, incubated w/ A beta for 24 h & analyzed by WB w/ LC3, p62 & beta -actin specific antibodies. n = 3–6. (I) LC3 puncta visualized by confocal microscopy. Presented results merged images. Green & red fluorescents indicate LC3 & PI respectively. Scale bars, 50 μm (magnification × 600). (J) Cells pretreated w/ trehalose (10 μM) for 30 min prior to A beta treatment for 24 h. Cytotoxicity measured by MTT assay at an absorbance of 545 nm using a microplate reader. Data present the mean ± SE. n = 6. (K) Cell viability measured by trypan blue exclusion assay. Data presented as a mean ± SE. n = 6. Each blot image presented as representative image. *p < 0.05 vs. control, #p < 0.05 vs. A beta treatment. Image collected & cropped by CiteAb from the following publication (https://pubmed.ncbi.nlm.nih.gov/28790888), licensed under a CC-BY license. Not internally tested by Novus Biologicals. [NB100-105] -")
Western Blot: HIF-1 alpha Antibody (H1alpha67) [NB100-105] -
Western Blot: HIF-1 alpha Antibody (H1alpha67) [NB100-105] - TSA reduces HIF-1 alpha & VEGF expression & up-regulates the expression of PEDF.Real-time PCR (A) & Western blot assays (B) were performed on RPE cells treated with 0–0.5 μM TSA & 150 μM CoCl2. (A) Cells were treated with 0–0.5 μM TSA for 14 h & then co-treated with 150 μM CoCl2 for 6 h for the analysis of gene expression by real-time PCR. Changes in HIF-1 alpha mRNA levels were not statistically significant. CoCl2 causes a fourfold enhancement of VEGF mRNA expression; but at 0.5 μM TSA, the mRNA level of VEGF reduces to less than half of that in cells treated with CoCl2 only. TSA induces a statistically significant increase in the mRNA level of PEDF. (B) Cells were treated with 0–0.5 μM TSA for 18 h & then co-treated with 150 μM CoCl2 for 6 h for Western blot analysis. TSA reduces the CoCl2-induced HIF-1 alpha & VEGF protein levels by 4.3-fold & 5.7-fold, respectively, & up-regulates PEDF protein level by threefold. (C) Densitometry data for Western blot of HIF-1 alpha, VEGF & PEDF. (*: t test p<0.05; **: t test p<0.01). Image collected & cropped by CiteAb from the following publication (https://dx.plos.org/10.1371/journal.pone.0120587), licensed under a CC-BY license. Not internally tested by Novus Biologicals. [NB100-105] -")
Western Blot: HIF-1 alpha Antibody (H1alpha67) [NB100-105] -
Western Blot: HIF-1 alpha Antibody (H1alpha67) [NB100-105] - A beta facilitates HIF1 alpha synthesis & autophagy inhibition via mTOR activation. (A) SK-N-MC cells exposed to A beta (5 μM) for 0–48 h. HIF1 alpha & beta -actin expression analyzed by WB. n = 3. (B) Cells pretreated w/ NAC (1 mM) for 30 min prior to A beta treatment for 24 h. HIF1 alpha & beta -actin expression analyzed by WB. n = 3. (C,E) Cells incubated w/ rapamycin (10 nM) for 30 min prior to A beta treatment for 24 h. Phosphorylation of 4EBP1 (Thr 37/46) & 4EBP1, phosphorylation of p70S6K1 (Thr 389), HIF1 alpha & beta -actin analyzed by WB. n = 6. (D) Protein samples immunoprecipitated by eukaryotic translation initiation factor 4E (eIF4E) antibody-conjugated protein A/G agarose beads. Samples blotted w/ 4EBP1 & eIF4E-specific antibodies. n = 3. (F) Cells exposed to PF4708671 (10 μM) for 30 min prior to A beta treatment for 24 h. HIF1 alpha & beta -actin expression detected by WB. n = 6. (G) Cells exposed to cycloheximide (4 μM) for 30 min prior to A beta treatment for 24 h. HIF1 alpha & beta -actin expressions detected by WB. n = 6. (H) Cells pretreated w/ rapamycin (10 nM) for 30 min, incubated w/ A beta for 24 h & analyzed by WB w/ LC3, p62 & beta -actin specific antibodies. n = 3–6. (I) LC3 puncta visualized by confocal microscopy. Presented results merged images. Green & red fluorescents indicate LC3 & PI respectively. Scale bars, 50 μm (magnification × 600). (J) Cells pretreated w/ trehalose (10 μM) for 30 min prior to A beta treatment for 24 h. Cytotoxicity measured by MTT assay at an absorbance of 545 nm using a microplate reader. Data present the mean ± SE. n = 6. (K) Cell viability measured by trypan blue exclusion assay. Data presented as a mean ± SE. n = 6. Each blot image presented as representative image. *p < 0.05 vs. control, #p < 0.05 vs. A beta treatment. Image collected & cropped by CiteAb from the following publication (https://pubmed.ncbi.nlm.nih.gov/28790888), licensed under a CC-BY license. Not internally tested by Novus Biologicals. [NB100-105] -")
Western Blot: HIF-1 alpha Antibody (H1alpha67) [NB100-105] -
Western Blot: HIF-1 alpha Antibody (H1alpha67) [NB100-105] - Role of HIF-1 alpha, FOXO3 in hypoxia-induced BNIP3 expression. (A) UCB-hMSCs were incubated with various durations of hypoxia (0–48 h). The protein expressions of HIF-1 alpha & beta -actin were detected by western blot. n = 4. (B) UCB-hMSCs were pretreated with NAC (5 mM) for 30 min prior to hypoxia incubation for 24 h. The protein expressions of HIF-1 alpha, lamin A/C & beta -tubulin in non-nuclear & nuclear fractionized cell samples were assessed by using western blot. n = 3. (C) UCB-hMSCs were immuno-stained with HIF-1 alpha & PI (magnification ×600). Scale bars, 37.5 µm. (D) HIF1A siRNA or NT siRNA was transfected to cells prior to hypoxia treatment for 24 h. The mRNA expression of BNIP3 was analyzed by qPCR. n = 6. (E) The protein expressions of BNIP3 & HIF-1 alpha were detected by western blot. n = 4. (F) NAC (5 mM) was pretreated to UCB-hMSCs prior to hypoxia treatment for 24 h. FOXO3, lamin A/C & beta -tubulin proteins expressions were assessed by western blot. n = 3. (G) FOXO3 siRNA transfected to UCB-hMSCs prior to hypoxia treatment for 24 h. The FOXO3 mRNA expression was measured by qPCR. n = 6. (H) BNIP3, FOXO3 & beta -actin expressions were detected by western blot. n = 3. Western blot data were normalized by beta -actin, & qPCR data were normalized by ACTB mRNA expression level. Lamin A/C & beta -tubulin were used as nuclear & non-nuclear protein controls, respectively. Quantitative data are presented as a mean ± S.E.M. All blots & confocal images are representative. *p < 0.05 versus control, #p < 0.05 versus hypoxia. Image collected & cropped by CiteAb from the following publication (https://linkinghub.elsevier.com/retrieve/pii/S2213231717303804), licensed under a CC-BY license. Not internally tested by Novus Biologicals. [NB100-105] -")
Western Blot: HIF-1 alpha Antibody (H1alpha67) [NB100-105] -
Western Blot: HIF-1 alpha Antibody (H1alpha67) [NB100-105] - HIF1 alpha protein is suppressed by ED71 but not by 1,25(OH)2D3.(A) Western analysis of Raw264.7 cells cultured in hypoxic conditions with or without 10−7 M of ED71 or 1,25(OH)2D3 (1,25D). (B) Hif1 alpha mRNA levels in Raw264.7 cells cultured in hypoxic conditions were analyzed by realtime PCR in the presence or absence of 10−7 M ED71 or 1,25(OH)2D3. Data represent mean Hif1 alpha expression relative to that of Actb ± SD (n = 5). (C) Levels of VDR transcripts in Raw264.7 cells transfected with shRNA targeting the VDR (shVDR) or control shRNA (Control) were determined by realtime PCR. Data represent mean VDR expression relative to that of Actb ± SD (n = 5). (D) Western analysis of control (shControl) or VDR-suppressed (shVDR#1 or shVDR#2) Raw264.7 transformants cultured in hypoxic conditions with ED71 or 1,25(OH)2D3 (1,25D), both at 10−7 M. (E) M-CSF-dependent Ctsk Cre/Hifflox/flox cells were cultured in normoxic conditions to suppress HIF1 alpha in the presence of M-CSF (50 ng/ml) plus RANKL (25 ng/ml) with either ED71 or 1,25(OH)2D3 (1,25D) both at 10−7M for 4 days. Expression of Ctsk & NFATc1 was then assessed by realtime PCR. Data represent mean Ctsk or NFATc1 expression relative to that of Actb ± SD (n = 5). *P<0.05; **P<0.01; ***P<0.001. Image collected & cropped by CiteAb from the following publication (https://dx.plos.org/10.1371/journal.pone.0111845), licensed under a CC-BY license. Not internally tested by Novus Biologicals. [NB100-105] -")
Western Blot: HIF-1 alpha Antibody (H1alpha67) [NB100-105] -
Western Blot: HIF-1 alpha Antibody (H1alpha67) [NB100-105] - Lack of HIF-P4H-1 increases the amount of p53. (a) Western blot analysis of p53 in wt & Hif-p4h-1−/− MEFs cultured in 21% or 1% O2 for 24 h. (b,c) Western blot analysis of p53 in Hif-p4h-1 & scrambled (Scrm) siRNA transfected HEK293 cells (b) & wt MEFs treated with 50 µM FG4497 for 24 h (c). (d) qPCR analysis of p53 mRNA in wt & Hif-p4h-1−/− MEFs cultured in 21% or 1% O2 for 24 h. (e) Analysis of p53 protein turnover rate. Hif-p4h-1−/− & wt MEFs were treated with 200 μg/ml of cycloheximide for the indicated time points & whole cell lysates were blotted for p53. (f) Western blot analysis of MDM2 in wt & Hif-p4h-1−/− MEFs cultured in 21% or 1% O2 for 24 h. (g) Western blot analysis of p53 & MDM2 in wt MEFs treated with 10 μM nutlin-3a for 24 h with or without overexpression of human HIF-P4H-1 (OE). (h,i) Western blot analysis of HIF1 alpha in wt & Hif-p4h-1−/− MEFs cultured in 21% or 1% O2 for 24 h (h) & in scrambled & Hif-p4h-1 siRNA transfected HEK293 cells (i). (j) Western blot analysis of ubiquitination of p53 in Hif-p4h-1 & scrambled siRNA transfected HEK293 cells. The cells were transfected with HA-ubiquitin & endogenous p53 was immunoprecipitated followed by Western blotting with anti-HA & anti-P53 antibodies. (k) Western blot analysis of p53 in Hif-p4h-1−/− & wt MEFs were treated with or without 10 μM MG132 for 5 h. Data are presented as representative Western blots & as mean ± s.d., n = at least 3 individual MEF isolates or experiments. *P < 0.05, **P < 0.01 & ***P < 0.001, two-tailed Student’s t-test. Unprocessed original scans of blots are shown in Supplementary Fig. 5. Image collected & cropped by CiteAb from the following publication (https://www.nature.com/articles/s41598-017-17376-0), licensed under a CC-BY license. Not internally tested by Novus Biologicals. [NB100-105] -")
Western Blot: HIF-1 alpha Antibody (H1alpha67) [NB100-105] -
Western Blot: HIF-1 alpha Antibody (H1alpha67) [NB100-105] - NDRG1 was regulated by HIF‐1/2 alpha. (A‐E) The protein expression of the shown genes was detected by Western blot, respectively; beta ‐actin was used as the loading control. (A) RCC4 & 786‐O cells (B) were infected with VHL vector (VHL) or empty vector (EV). (C) Caki‐1 cells were transfected with VHL shRNAs (shVHL) or non‐specific control (NC). (D) RCC4 cells were infected with HIF‐1 alpha siRNAs (siHIF‐1 alpha ) or non‐specific control (NC). (E) 786‐O cells were transfected with HIF‐2 alpha shRNAs (shHIF‐2 alpha ) or non‐specific control (NC). (F) Representative images of HIF‐1 alpha, HIF‐2 alpha & NDRG1 protein expression from the IHC staining of human clear cell renal cell cancer specimens. Patient I: The protein levels of HIF‐1 alpha, HIF‐2 alpha & NDRG1 were low. Patient II: The protein levels of HIF‐1 alpha, HIF‐2 alpha & NDRG1 were medium. Patient III: The protein levels of HIF‐1 alpha, HIF‐2 alpha & NDRG1 were high (scale bar, 50 μm). (G & H) The protein level of NDRG1 is significantly correlated with HIF‐1 alpha (G) & HIF‐2 alpha (H). The protein levels were evaluated according to IHC scores, representing very low (score 0‐2), low (score 3‐4), high (score 5‐8) & strong (score 9‐12). The subjects were divided into four groups according to the IHC scores of HIFs in the tumours. (I) The protein level of NDRG1 is significantly correlated with the average of HIF‐1 alpha & HIF‐2 alpha in ccRCC tissues. The protein levels are evaluated according to IHC scores, representing very low (score < 3), low (score < 5), high (score < 8) & strong (score 8‐12). The subjects were divided into four groups according to the IHC scores of the average of HIF‐1 alpha & HIF‐2 alpha. Significance p‐values & r values according to Spearman's rank correlation Image collected & cropped by CiteAb from the following publication (https://pubmed.ncbi.nlm.nih.gov/32537867), licensed under a CC-BY license. Not internally tested by Novus Biologicals. [NB100-105] -")
Western Blot: HIF-1 alpha Antibody (H1alpha67) [NB100-105] -
Western Blot: HIF-1 alpha Antibody (H1alpha67) [NB100-105] - WNT11 is induced by hypoxia or hypoxic mimetics in different cell types.(A) Increased Wnt11 mRNA in EMSC adipocytes (Day 12) after hypoxia-mimetic treatments. EMSC adipocytes were treated with CoCl2 (0.1 mM), DFO (0.1 mM) or DMOG (0.1 mM) for 24 hrs. Values were normalized to Tbp mRNA & are expressed relative to control (n = 3). (B,C) Increased Wnt11 mRNA by hypoxia in EMSC preadipocytes & adipocytes (Day 0–12 after differentiation) (B), & C2C12 myoblast & myocyte (Day 0 & 8 after differentiation) (C). Wnt11 mRNA was assessed by quantitative PCR in cells exposed to air (21% O2) or hypoxia (1% O2) for 24 hrs. (n = 4). Values were normalized to Tbp mRNA & are expressed relative to 21% O2 samples (left panel). (D) Immunoblot analyses of HeLa cells under normal air or hypoxia for 24 hrs. (E,F) Induction of Wnt11 by increasing concentrations of DMOG in MDA-MB-231 cells (E) & 4T1 cells (F). (G) EMSCs treated with 0.1 mM DMOG for the indicated times. Wnt11 & Vegf mRNA expression was measured by qPCR & normalized to Tbp mRNA (n = 4). (H) WNT11 protein levels after DMOG treatment normalized to alpha -Tubulin (upper panel; n = 4). Representative immunoblots of EMSCs treated with 0.1 mM DMOG for the indicated times (Lower panel). (I) Protein expression in MDA-MB-231 cells treated with 0.1 mM DMOG. (J) Induction of Wnt11 promoter activity by hypoxia or hypoxia mimetics. pGL3-Wnt11 promoter plasmid was transfected into C2C12 cells. Cells were incubated with DMOG (left panel, n = 4) or under 21% O2 or 1% O2 (right panel, n = 8) for 24 hrs. For panels (A–C,G,H,J), values are mean ± s.e.m. *p < 0.05, **p < 0.01. For panels of immunoblotting, laminin, alpha -tubulin, & ERK were used as loading controls, WNT11 normalized to alpha -Tubulin was shown. Image collected & cropped by CiteAb from the following publication (https://www.nature.com/articles/srep21520), licensed under a CC-BY license. Not internally tested by Novus Biologicals.Applications for HIF-1 alpha Antibody (H1alpha67)
Application
Recommended Usage
Chromatin Immunoprecipitation
1 - 5 ug/IP. Use reported in scientific literature
Chromatin Immunoprecipitation (ChIP)
1-5 ug/IP
ELISA
1:100 - 1:2000. Use reported in scientific literature (PMID 20042684)
Flow Cytometry
1:10 - 1:1000
Gel Super Shift Assays
1:1 - 1:100. Use reported in scientific literature (PMID 22411794)
Immunoassay
reported in scientific literature (PMID 26147748)
Immunoblotting
reported in multiple pieces of scientific literature
Immunocytochemistry/ Immunofluorescence
1:50
Immunohistochemistry
1:20-1:50
Immunohistochemistry Free-Floating
reported in scientific literature (PMID 33242463)
Immunohistochemistry-Frozen
1:20-1:50
Immunohistochemistry-Paraffin
1:20-1:50
Immunoprecipitation
1:10-1:500
In vitro assay
reported in multiple pieces of scientific literature
Knockdown Validated
reported in scientific literature (PMID 32772041)
Knockout Validated
reported in scientific literature (PMID 26861754)
Ligand Activation
reported in scientific literature (PMID 26147748)
Proximity Ligation Assay
reported in scientific literature (PMID 27595394)
Western Blot
1:500
Application Notes
In WB, a band can be seen at 120 kDa representing HIF-1 alpha in induced tissues and cells. Multiple bands may be seen at 100-120 kDa representing post-translational modification of HIF-1 alpha. For WB, testing on nuclear extracts is recommended. We recommend the use of a highly sensitive ECL reagent, such as West Pico PLUS, for Western blot detection. See Simple Western Antibody Database for Simple Western validation: separated by size
Reviewed Applications
Read 44 reviews rated 4.2 using NB100-105 in the following applications:
Flow Cytometry Panel Builder
Bio-Techne Knows Flow Cytometry
Save time and reduce costly mistakes by quickly finding compatible reagents using the Panel Builder Tool.
Advanced Features
- Spectra Viewer - Custom analysis of spectra from multiple fluorochromes
- Spillover Popups - Visualize the spectra of individual fluorochromes
- Antigen Density Selector - Match fluorochrome brightness with antigen density

Formulation, Preparation, and Storage
Purification
Protein G purified
Formulation
PBS, 1% BSA
Preservative
0.05% Sodium Azide
Concentration
1.0 mg/ml
Shipping
The product is shipped with polar packs. Upon receipt, store it immediately at the temperature recommended below.
Stability & Storage
Store at 4C short term. Aliquot and store at -20C long term. Avoid freeze-thaw cycles.
Background: HIF-1 alpha/HIF1A
HIF-1 or hypoxia inducible factor 1 (predicted molecular weight 93kDa), is a transcription factor commonly referred to as a "master regulator of the hypoxic response" for its central role in the regulation of cellular adaptations to hypoxia. In its active form under hypoxic conditions, HIF-1 is stabilized by the formation of a heterodimer of HIF-1 alpha and ARNT/HIF-1 beta subunits. Nuclear HIF-1 engages p300/CBP for binding to hypoxic response elements (HREs). This process induces transcription and regulation of genes including EPO, VEGF, iNOS2, ANGPT1 and OCT4 (4,5).
Under normoxic conditions, the HIF-1 alpha subunit is rapidly targeted and degraded by the ubiquitin proteasome system. This process is mediated by prolyl hydroxylase domain enzymes (PHDs), which catalyze the hydroxylation of key proline residues (Pro-402 and Pro-564) within the oxygen-dependent degradation domain of HIF-1 alpha. Once hydroxylated, HIF-1 alpha binds the von Hippel-Lindau tumor suppressor protein (pVHL) for subsequent ubiquitination and proteasomal degradation (4). pVHL dependent regulation of HIF-1 alpha plays a role in normal physiology and disease states. Regulation of HIF-1 alpha by pVHL is critical for the suppressive function of FoxP3+ regulatory Tcells (6). Repression of pVHL expression in chronic lymphocytic leukemia (CLL) B cells leads to HIF-1 alpha stabilization and increased VEGF secretion (7).
References
1. Semenza, G. L., Agani, F., Feldser, D., Iyer, N., Kotch, L., Laughner, E., & Yu, A. (2000). Hypoxia, HIF-1, and the pathophysiology of common human diseases. Advances in Experimental Medicine and Biology.
2. Muz, B., de la Puente, P., Azab, F., & Azab, A. K. (2015). The role of hypoxia in cancer progression, angiogenesis, metastasis, and resistance to therapy. Hypoxia. https://doi.org/10.2147/hp.s93413
3. Huang, Y., Lin, D., & Taniguchi, C. M. (2017). Hypoxia inducible factor (HIF) in the tumor microenvironment: friend or foe? Science China Life Sciences. https://doi.org/10.1007/s11427-017-9178-y
4. Koyasu, S., Kobayashi, M., Goto, Y., Hiraoka, M., & Harada, H. (2018). Regulatory mechanisms of hypoxia-inducible factor 1 activity: Two decades of knowledge. Cancer Science. https://doi.org/10.1111/cas.13483
5. Dengler, V. L., Galbraith, M. D., & Espinosa, J. M. (2014). Transcriptional regulation by hypoxia inducible factors. Critical Reviews in Biochemistry and Molecular Biology. https://doi.org/10.3109/10409238.2013.838205
6. Lee, J. H., Elly, C., Park, Y., & Liu, Y. C. (2015). E3Ubiquitin Ligase VHL Regulates Hypoxia-Inducible Factor-1 alpha to Maintain Regulatory T Cell Stability and Suppressive Capacity. Immunity. https://doi.org/10.1016/j.immuni.2015.05.016
7. Ghosh, A. K., Shanafelt, T. D., Cimmino, A., Taccioli, C., Volinia, S., Liu, C. G.,... Kay, N. E. (2009). Aberrant regulation of pVHL levels by microRNA promotes the HIF/VEGF axis in CLL B cells. Blood. https://doi.org/10.1182/blood-2008-10-185686
Long Name
Hypoxia Inducible Factor 1 Subunit Alpha
Alternate Names
BHLHE78, HIF 1A, HIF-1a, HIF1 alpha, HIF1A, MOP1, PASD8, anti-HIF-1 alpha, anti-HIF1A, H1alpha67
Entrez Gene IDs
3091 (Human)
Gene Symbol
HIF1A
OMIM
603348 (Human)
Additional HIF-1 alpha/HIF1A Products
Product Documents for HIF-1 alpha Antibody (H1alpha67)
Certificate of Analysis
To download a Certificate of Analysis, please enter a lot or batch number in the search box below.
Product Specific Notices for HIF-1 alpha Antibody (H1alpha67)
This product is for research use only and is not approved for use in humans or in clinical diagnosis. Primary Antibodies are guaranteed for 1 year from date of receipt.
Citations for HIF-1 alpha Antibody (H1alpha67)
 Powered by Bioz
Customer Reviews for HIF-1 alpha Antibody (H1alpha67) (44)
4.2 out of 5
44 Customer Ratings
Have you used HIF-1 alpha Antibody (H1alpha67)?
Submit a review and receive an Amazon gift card!
$25/€18/£15/$25CAN/¥2500 Yen for a review with an image
$10/€7/£6/$10CAN/¥1110 Yen for a review without an image
Submit a review
Customer Images
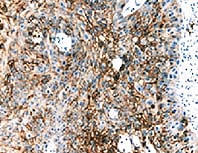
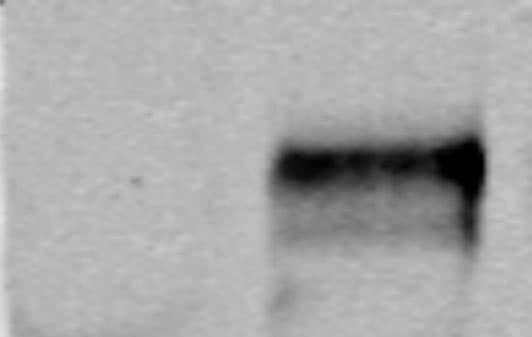
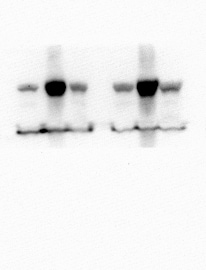
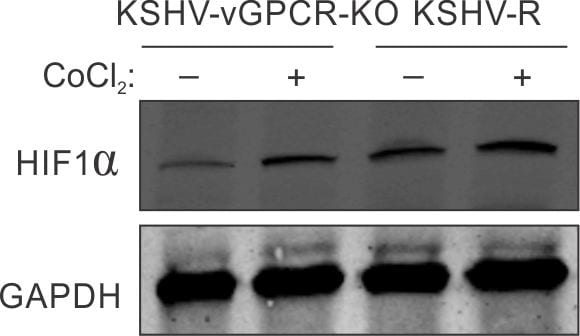

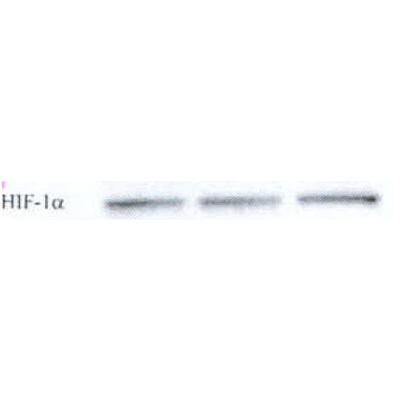
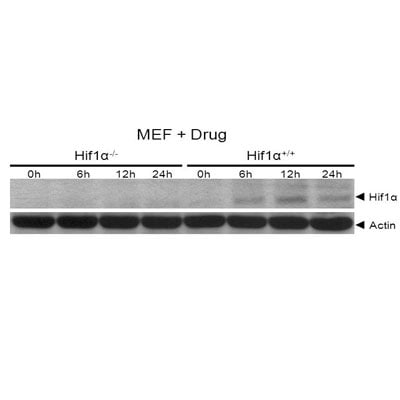
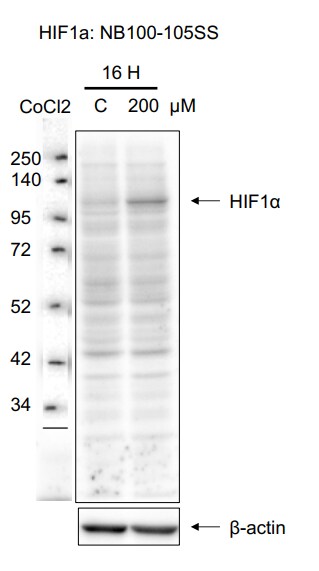
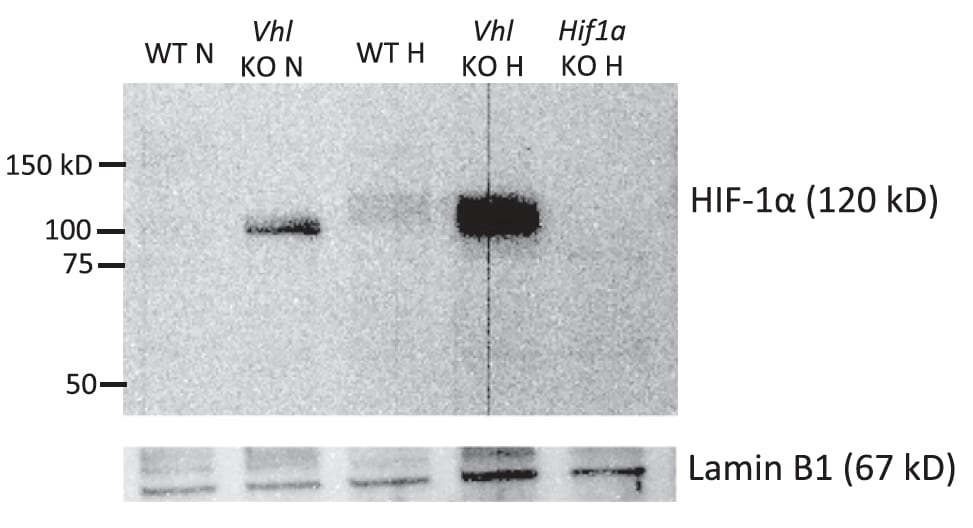
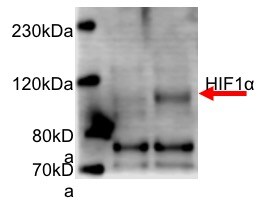
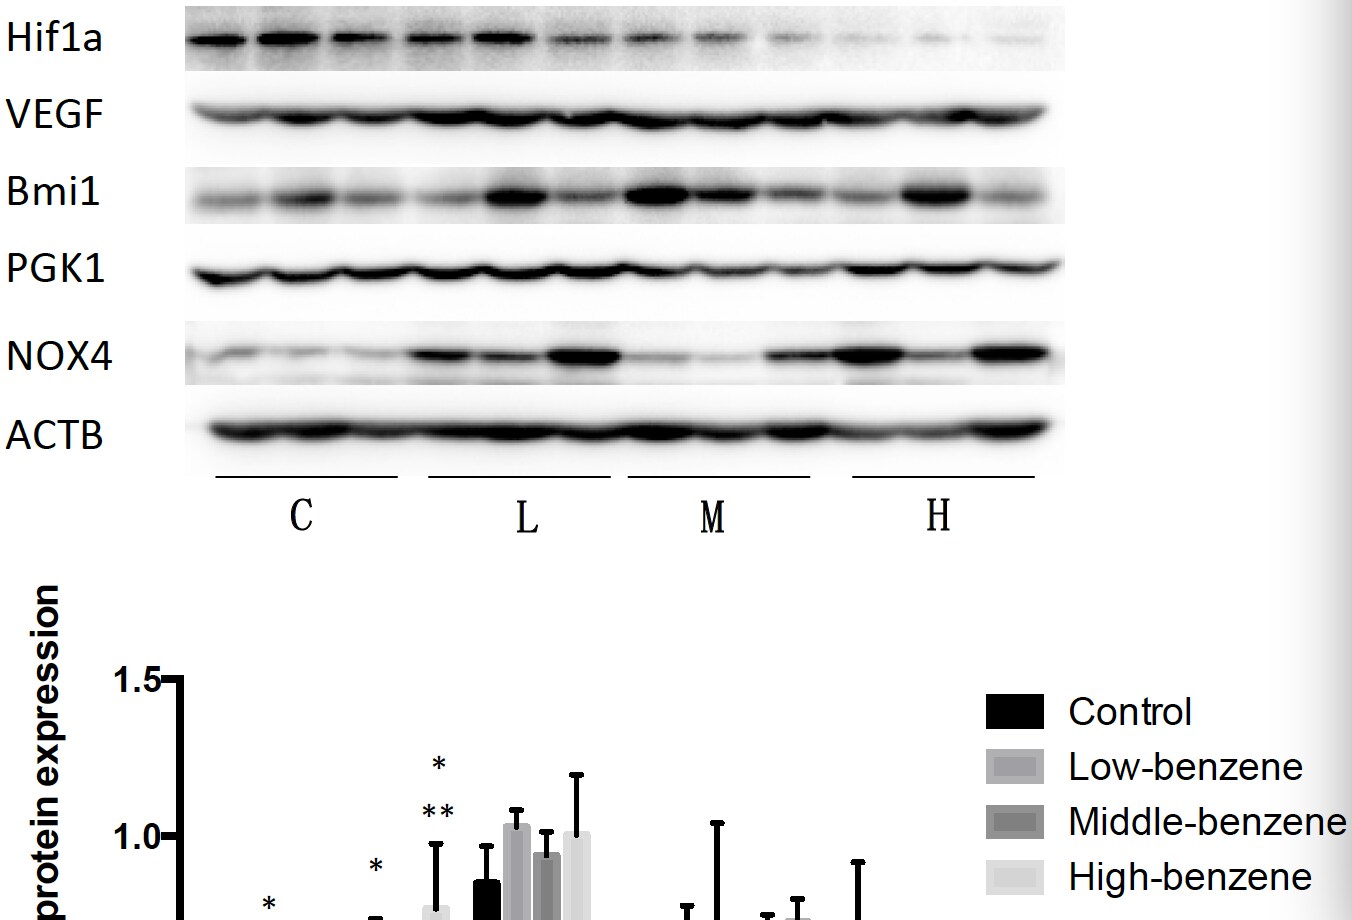
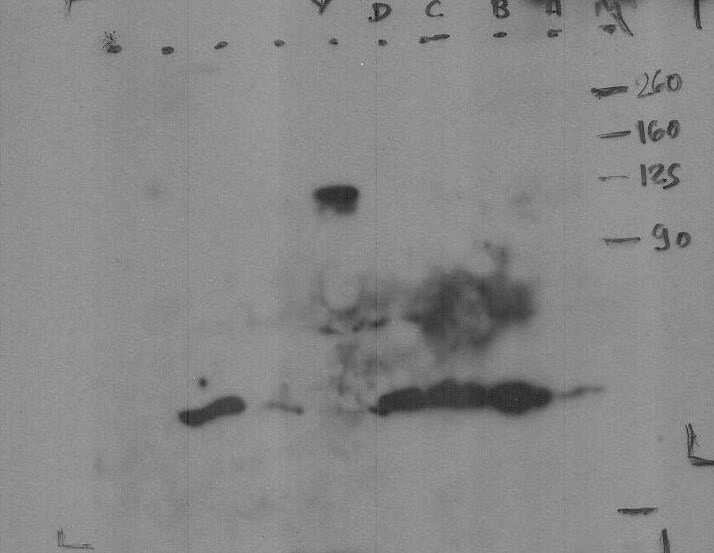
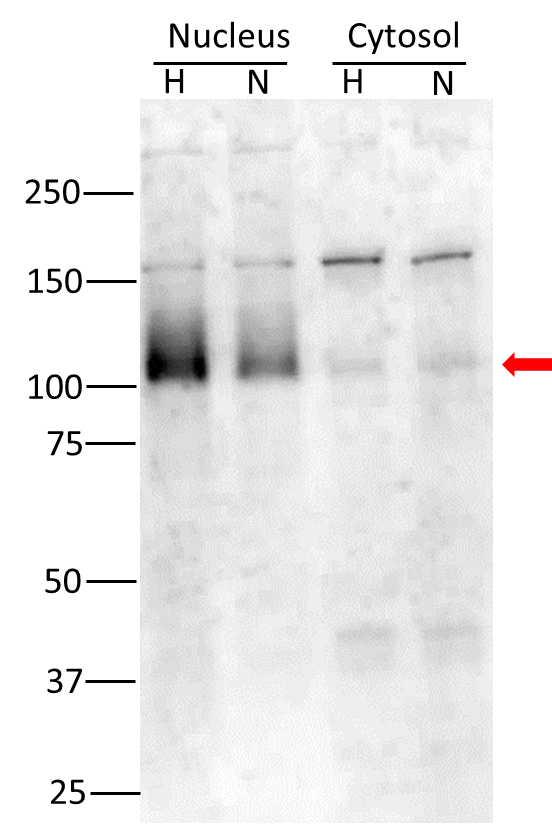
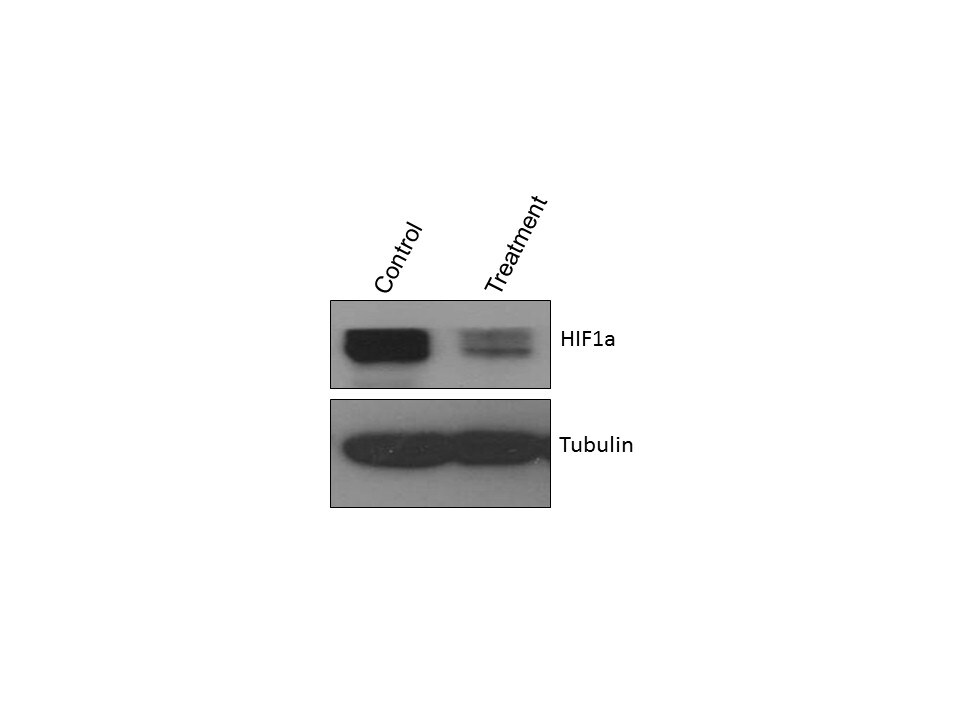
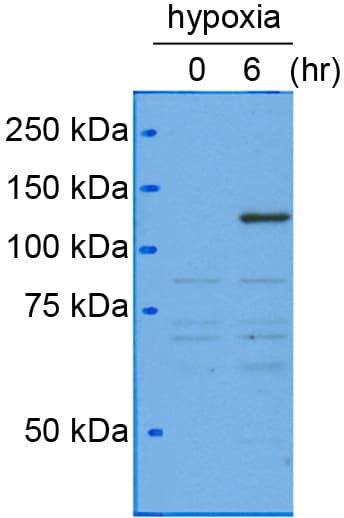
-(01-ml)_NB100-105_8921.gif)
-(01-ml)_NB100-105_7421.jpg)
-(01-ml)_NB100-105_7121.jpg)
-(01-ml)_NB100-105_7021.JPG)
-(01-ml)_NB100-105_6866.jpg)
-(01-ml)_NB100-105_6861.jpg)

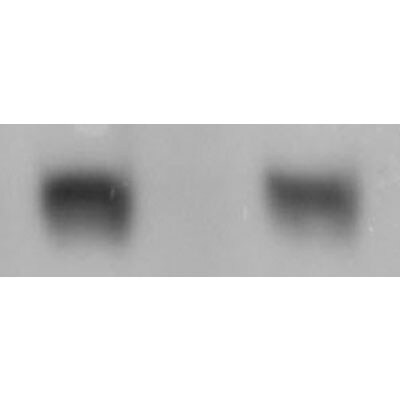
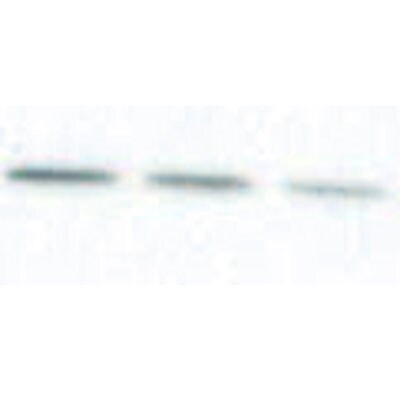
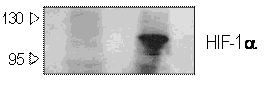
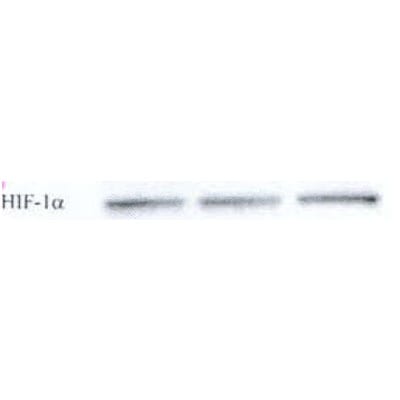
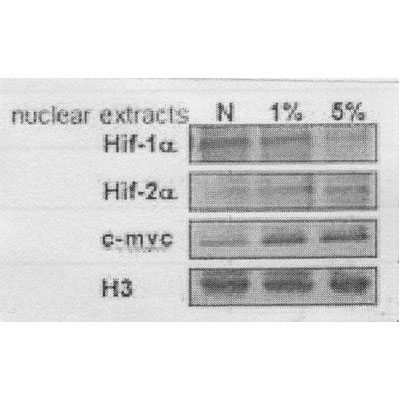
Showing
1
-
5 of
44 reviews
Showing All
Filter By:
-
Application: Immunohistochemistry-ParaffinSample Tested: Throat cancer tissueSpecies: HumanVerified Customer | Posted 01/19/2022Throat cancer tissuePFA fixed paraffin-embedded sections. Primary antibody dilution 1:100.

-
Application: Western BlotSample Tested: Caki-1 cell lysate and fibroblastsSpecies: HumanVerified Customer | Posted 03/31/2021left: primary fibroblasts Right: HIF1 transfection with primary fibroblasts
-
Application: Western BlotSample Tested: HEK293A whole cell lysate and RCC4 Whole cell lysateSpecies: HumanVerified Customer | Posted 08/09/2020Left 3 lanes: HEK293a cells with overexpression of HIF1a in the middle lane Right 3 lanes: RCC4 cells with overexpression of HIF1a in the middle lane
-
Application: Western BlotSample Tested: Blood mononuclear cells (PBMCs)Species: HumanVerified Customer | Posted 06/13/2019PBMCs infected with vGPCR frame shift knock out and wild type revertant KSHV virion and treated with CoCl2 for 48 hours was used for western blot against HIF1 alpha.Confirmation of induction of hypoxia in CoCl2 treated PBMCs infected with vGPCR frame shift knock out and wild type revertant KSHV virion. KSHV infected cells were treated with CoCl2 for 48 hours followed by protein isolation and western blot against HIF1 alpha.
-
Application: Western BlotSample Tested: Human cancer cell whole cell lysateSpecies: HumanVerified Customer | Posted 02/02/2019
-
Application: Western BlotSample Tested: Rat liverSpecies: RatVerified Customer | Posted 02/02/2019
-
Application: Western BlotSample Tested: human adrenal cancer cells (whole cell lysate)Species: HumanVerified Customer | Posted 01/29/2019
-
Application: Western BlotSample Tested: Rat liverSpecies: RatVerified Customer | Posted 01/29/2019Detection Method: ECL
-
Application: Western BlotSample Tested: Hela whole cell lysateSpecies: HumanVerified Customer | Posted 01/24/2019ECL solution for 5min, then exposure to film 3-5min
-
Application: Western BlotSample Tested: 293t cell lysateSpecies: HumanVerified Customer | Posted 01/23/2019
-
Application: Western BlotSample Tested: 293t cell lysateSpecies: HumanVerified Customer | Posted 06/29/2017
-
Application: Western BlotSample Tested: CD4 T cells cultured in vitro, stimulated with anti-CD3/anti-CD28Species: MouseVerified Customer | Posted 02/01/2017See "Other experimental details" boxFigure Legend: Naïve CD4 T cells from WT, VHL-deficient (Vhl KO), or HIF-1a–deficient (Hif1a KO) mice were differentiated under IL-22–skewing conditions for a total of 60 h. Some cells remained at normoxia for the duration of the culture (N); others were at normoxia for 35 h and then hypoxia (1% O2) for 24 h (H). At 60 h, nuclear extracts were harvested, and HIF-1a and lamin B1 levels were analyzed by Western blot.
-
Application: Western BlotSample Tested: HL-1 cardiomyocytesSpecies: MouseVerified Customer | Posted 08/17/2016Lane 1- Normoxic HL-1 cardiomyocytes (21% O2), Lane 2- Hypoxic HL-1 cardiomyocytes (2% O2 for 16h)
-
Application: Western BlotSample Tested: k562 cellsSpecies: HumanVerified Customer | Posted 05/08/20161,4-bq exposure
-
Application: Western BlotSample Tested: HEK293A whole cell lysateSpecies: HumanVerified Customer | Posted 04/18/2016
-
Application: Western BlotSample Tested:Species: MouseVerified Customer | Posted 03/24/2016
-
Application: Western BlotSample Tested: Cell lysateSpecies: MouseVerified Customer | Posted 10/07/2015
-
Application: Western BlotSample Tested: mouse retinaSpecies: MouseVerified Customer | Posted 10/05/2015Hif1a expression in normaxia (N) and hypoxia(H) mouse retinas from nucleus and cytosol lysis
-
Application: Western BlotSample Tested: Human cancer cell whole cell lysateSpecies: HumanVerified Customer | Posted 08/23/2015
-
Application: Western BlotSample Tested: Human prostate cancer cell line protein samplesSpecies: HumanVerified Customer | Posted 08/10/2015HIF1 alpha western blotting
-
Application: Western BlotSample Tested:Species: HumanVerified Customer | Posted 04/28/2015HIF1alpha antibody (NB100-105)
-
Application: Western BlotSample Tested: See PIMD: 23148210Species: MouseVerified Customer | Posted 12/17/2014
-
Application: Western BlotSample Tested: Caki-1 cell lysateSpecies: HumanVerified Customer | Posted 07/18/2014HIF1alpha induction by CoCl2
-
Application: Western BlotSample Tested: Hela Cell LysateSpecies: HumanVerified Customer | Posted 07/01/2014
-
Application: Western BlotSample Tested: Hela whole cell lysateSpecies: HumanVerified Customer | Posted 05/09/2014A, HIF-1α content was determined in HeLa cells by WB in the presence or absence of DFX and CPT.
-
Application: Western BlotSample Tested: mouse brain lysateSpecies: MouseVerified Customer | Posted 04/28/2014mnSOD2 WB in WT and transgenic mice
-
Application: Western BlotSample Tested: MouseSpecies: MouseVerified Customer | Posted 04/28/2014
-
Application: ImmunohistochemistrySample Tested:Species: OtherVerified Customer | Posted 04/14/2014Expression of HIF-1 in pig valve (brown, light brown).
-
Application: ImmunofluorescenceSample Tested:Species: OtherVerified Customer | Posted 04/14/2014Expression of HIF-1 in intresititial pig cells under 12% of 02 condition
-
Application: Western BlotSample Tested:Species: MouseVerified Customer | Posted 03/28/20143 T12 cell line
-
Application: Western BlotSample Tested: Whole cell lysateSpecies: HumanVerified Customer | Posted 08/23/2012
-
Application: ImmunofluorescenceSample Tested: RAT KIDNEYSpecies: RatVerified Customer | Posted 08/22/2012
-
Application: Western BlotSample Tested: human adrenal cancer cells (whole cell lysate)Species: HumanVerified Customer | Posted 08/22/2012
-
Application: Western BlotSample Tested: Cell lysateSpecies: MouseVerified Customer | Posted 05/15/2012
-
Application: Western BlotSample Tested: Human prostate cancer cellsSpecies: HumanVerified Customer | Posted 05/11/2012
-
Application: Western BlotSample Tested: Rat liverSpecies: RatVerified Customer | Posted 12/14/2011
-
Application: Western BlotSample Tested: Mouse auditory cultured cell, Sample Amount: 30ugSpecies: MouseVerified Customer | Posted 12/09/2011
-
Application: Western BlotSample Tested: HumanSpecies: HumanVerified Customer | Posted 11/21/2011
-
Application: ImmunocytochemistrySample Tested: Human tissuesSpecies: HumanVerified Customer | Posted 11/15/2011
-
Application: Western BlotSample Tested: MCF-7, Sample Amount: 100ugSpecies: HumanVerified Customer | Posted 09/30/2011
-
Application: Western BlotSample Tested: endothelial cell nuclear extract, Sample Amount: 40ugSpecies: RatVerified Customer | Posted 09/01/2010
-
Application: Western BlotSample Tested: mouse cortical neurons, Sample Amount: 40ugSpecies: MouseVerified Customer | Posted 05/17/2010
-
Application: Western BlotSample Tested: HeLa cellsSpecies: 25037Verified Customer | Posted 04/13/2010
-
Application: ImmunocytochemistrySample Tested: HUVEC & Candida albicansSpecies: OtherVerified Customer | Posted 02/10/2010
There are no reviews that match your criteria.
Protocols
View specific protocols for HIF-1 alpha Antibody (H1alpha67) (NB100-105):
HIF-1 alpha Antibody (H1alpha67):
Immunohistochemistry Protocol:
1. Prepare tissue with formalin fixation and by embedding it in paraffin wax.
2. Make 4-mm sections and place on pre-cleaned and charged microscope slides.
3. Heat in a tissue-drying oven for 45 minutes @ 60 degrees Celcius.
4. Deparaffinize the tissues by wash drying the slides in 3 changes of xylene for 5 minutes each @ RT.
5. Rehydrate the tissues by washing the slides in 3 changes of 100% alcohol for 3 minutes each @ RT.
6. Wash the slides in 2 changes of 95% alcohol for 3 minutes each @ RT.
7. Wash the slides in 1 change of 80% alcohol for 3 minutes @ RT.
8. Rinse the slides in gentle running distilled water for 5 minutes @ RT.
9. Perform antigen retrieval by steaming the slides in 0.01M sodium citrate buffer (pH 6.0) @ 99-100 degrees Celcius for 20 minutes.
10. Remove the slides from the heat and let stand in buffer @ RT for 20 minutes.
11. Rinse the slides in 1X TBS-T for 1 minute @ RT.
**Do not allow the tissues to dry at any time during the staining procedure**
12. Begin the immunostaining by applying a universal protein block for 20 minutes @ RT.
13. Drain protein block from the slides and apply the diluted primary antibody for 45 minutes @ RT.
14. Rinse the slide in 1X TBS-T for 1 minute @ RT.
15. Apply a biotinylated anti-mouse (H+L) secondary for 30 minutes @ RT.
16. Rinse the slide in 1X TBS-T for 1 minute @ RT.
17. Apply an alkaline phosphatase streptavidin for 30 minutes @ RT.
18. Rinse the slide in 1X TBS-T for 1 minute @ RT.
19. Apply an alkaline phosphatase chromogen substrate for 30 minutes @ RT.
20. Rinse the slide in distilled water for 1 minute @ RT.
**This method should only be used if the chromogen substrate is alcohol insoluble (ie: Vector Red, DAB)**
21. Dehydrate the tissue by washing the slides in 2 changes of 80% alcohol for 1 minute each @ RT.
22. Wash the slides in 2 changes of 95% alcohol for 1 minute each @ RT.
23. Wash the slides in 3 changes of 100% alcohol for 1 minute each @ RT.
24. Wash the slides in 3 changes of xylene for 1 minute each @ RT.
25. Apply cover slip.
General considerations for Western blot analysis of HIF-alpha proteins:
1. HIF-1alpha is largely undetectable in cells or tissues grown under normoxic conditions. It is stabilized only at O2 concentrations below 5% or with treatment using certain agents (CoCl2, DFO, etc.), therefore proper sample preparation is critical. We recommend lysing cells quickly and directly into the Laemmli sample buffer with DTT or BME.
2. Since stabilized HIF-1alpha translocates to the nucleus, using nuclear extracts is recommended for western blot analysis.
3. Positive and negative controls should always be run side by side in a Western blot to accurately identify the protein band upregulated in the hypoxic sample. (HeLa Hypoxic/Normoxic Cell Lysate: NBP2-36452; HeLa Hypoxic (CoCl2)/Normoxic Lysate: NBP2-36450)
4. To accurately compare treated and untreated samples and to ensure equal loading of samples the expression of a loading control should be evaluated. (alpha Tubulin Antibody (DM1A): NB100-690)
5. Unprocessed HIF-1alpha is ~95 kDa, while the fully post-translationally modified form is ~116 kDa, or larger.
6. HIF-1alpha may form a heterodimer with HIF-1beta (Duan, et al. Circulation. 2005; 111:2227-2232.). However, this is not typically seen under denaturing conditions.
7. Depending on the sample and treatment, a single band or a doublet may be present.
8. Please, note that NB100-105 as a monoclonal antibody hence it is much weaker then polyclonal antibodies and need very sensitive detection reagents (e.g. Supersignal West Pico Plus, or more sensitive one) and long time exposure to obtain WB image.
Western Blot Protocol
1. Load samples of treated and untreated cell lysates, 10-40 mg of total protein per lane on a 7.5%polyacrylamide
gel (SDS-PAGE). Alternatively, gradient gels can be used for better resolution of lower molecular weight loading
controls.
2. Resolve proteins by electrophoresis as required.
3. Transfer proteins to 0.45 mm PVDF membrane for 1 hour at 100V or equivalent.
4. Stain the blot using Ponceau S for 1-2 minutes to confirm efficient protein transfer onto the membrane.
5. Rinse the blot in distilled water to remove excess stain and mark the lanes and locations of molecular weight
markers using a pencil.
6. Block the membrane using 5% non-fat dry milk in TBST (0.1% Tween) for 1 hour.
7. Dilute the mouse anti-HIF-1 alpha primary antibody (NB100-105) at 2ug/ml in blocking solution and incubate 1
hour at room temperature or overnight at 4C.
8. Wash the membrane 3X 5 min in TBST.
9. Incubate in the appropriate diluted mouse-IgG HRP-conjugated secondary antibody in blocking solution (as per
manufacturer's instructions) for 1 hour at room temperature.
10. Wash the membrane 3X 5 min in TBST.
11. Incubate with ECL detection reagent (Supersignal West Pico Plus, or more sensitive) for 5 min.
12. Image the blot. That may require up to 5min of exposure due to weak signal.
Find general support by application which include: protocols, troubleshooting, illustrated assays, videos and webinars.
- 7-Amino Actinomycin D (7-AAD) Cell Viability Flow Cytometry Protocol
- Antigen Retrieval Protocol (PIER)
- Antigen Retrieval for Frozen Sections Protocol
- Appropriate Fixation of IHC/ICC Samples
- Cellular Response to Hypoxia Protocols
- ChIP Protocol Video
- Chromatin Immunoprecipitation (ChIP) Protocol
- Chromatin Immunoprecipitation Protocol
- Chromogenic IHC Staining of Formalin-Fixed Paraffin-Embedded (FFPE) Tissue Protocol
- Chromogenic Immunohistochemistry Staining of Frozen Tissue
- ClariTSA™ Fluorophore Kits
- Detection & Visualization of Antibody Binding
- ELISA Sample Preparation & Collection Guide
- ELISA Troubleshooting Guide
- Extracellular Membrane Flow Cytometry Protocol
- Flow Cytometry Protocol for Cell Surface Markers
- Flow Cytometry Protocol for Staining Membrane Associated Proteins
- Flow Cytometry Staining Protocols
- Flow Cytometry Troubleshooting Guide
- Fluorescent IHC Staining of Frozen Tissue Protocol
- Graphic Protocol for Heat-induced Epitope Retrieval
- Graphic Protocol for the Preparation and Fluorescent IHC Staining of Frozen Tissue Sections
- Graphic Protocol for the Preparation and Fluorescent IHC Staining of Paraffin-embedded Tissue Sections
- Graphic Protocol for the Preparation of Gelatin-coated Slides for Histological Tissue Sections
- How to Run an R&D Systems DuoSet ELISA
- How to Run an R&D Systems Quantikine ELISA
- How to Run an R&D Systems Quantikine™ QuicKit™ ELISA
- ICC Cell Smear Protocol for Suspension Cells
- ICC Immunocytochemistry Protocol Videos
- ICC for Adherent Cells
- IHC Sample Preparation (Frozen sections vs Paraffin)
- Immunocytochemistry (ICC) Protocol
- Immunocytochemistry Troubleshooting
- Immunofluorescence of Organoids Embedded in Cultrex Basement Membrane Extract
- Immunofluorescent IHC Staining of Formalin-Fixed Paraffin-Embedded (FFPE) Tissue Protocol
- Immunohistochemistry (IHC) and Immunocytochemistry (ICC) Protocols
- Immunohistochemistry Frozen Troubleshooting
- Immunohistochemistry Paraffin Troubleshooting
- Immunoprecipitation Protocol
- Intracellular Flow Cytometry Protocol Using Alcohol (Methanol)
- Intracellular Flow Cytometry Protocol Using Detergents
- Intracellular Nuclear Staining Flow Cytometry Protocol Using Detergents
- Intracellular Staining Flow Cytometry Protocol Using Alcohol Permeabilization
- Intracellular Staining Flow Cytometry Protocol Using Detergents to Permeabilize Cells
- Preparing Samples for IHC/ICC Experiments
- Preventing Non-Specific Staining (Non-Specific Binding)
- Primary Antibody Selection & Optimization
- Propidium Iodide Cell Viability Flow Cytometry Protocol
- Protocol for Heat-Induced Epitope Retrieval (HIER)
- Protocol for Liperfluo
- Protocol for Making a 4% Formaldehyde Solution in PBS
- Protocol for VisUCyte™ HRP Polymer Detection Reagent
- Protocol for the Characterization of Human Th22 Cells
- Protocol for the Characterization of Human Th9 Cells
- Protocol for the Fluorescent ICC Staining of Cell Smears - Graphic
- Protocol for the Fluorescent ICC Staining of Cultured Cells on Coverslips - Graphic
- Protocol for the Preparation & Fixation of Cells on Coverslips
- Protocol for the Preparation and Chromogenic IHC Staining of Frozen Tissue Sections
- Protocol for the Preparation and Chromogenic IHC Staining of Frozen Tissue Sections - Graphic
- Protocol for the Preparation and Chromogenic IHC Staining of Paraffin-embedded Tissue Sections
- Protocol for the Preparation and Chromogenic IHC Staining of Paraffin-embedded Tissue Sections - Graphic
- Protocol for the Preparation and Fluorescent ICC Staining of Cells on Coverslips
- Protocol for the Preparation and Fluorescent ICC Staining of Non-adherent Cells
- Protocol for the Preparation and Fluorescent ICC Staining of Stem Cells on Coverslips
- Protocol for the Preparation and Fluorescent IHC Staining of Frozen Tissue Sections
- Protocol for the Preparation and Fluorescent IHC Staining of Paraffin-embedded Tissue Sections
- Protocol for the Preparation of Gelatin-coated Slides for Histological Tissue Sections
- Protocol for the Preparation of a Cell Smear for Non-adherent Cell ICC - Graphic
- Protocol: Annexin V and PI Staining by Flow Cytometry
- Protocol: Annexin V and PI Staining for Apoptosis by Flow Cytometry
- Quantikine HS ELISA Kit Assay Principle, Alkaline Phosphatase
- Quantikine HS ELISA Kit Principle, Streptavidin-HRP Polymer
- R&D Systems Quality Control Western Blot Protocol
- Sandwich ELISA (Colorimetric) – Biotin/Streptavidin Detection Protocol
- Sandwich ELISA (Colorimetric) – Direct Detection Protocol
- TUNEL and Active Caspase-3 Detection by IHC/ICC Protocol
- The Importance of IHC/ICC Controls
- Troubleshooting Guide: ELISA
- Troubleshooting Guide: Fluorokine Flow Cytometry Kits
- Troubleshooting Guide: Immunohistochemistry
- Troubleshooting Guide: Western Blot Figures
- Western Blot Conditions
- Western Blot Protocol
- Western Blot Protocol for Cell Lysates
- Western Blot Troubleshooting
- Western Blot Troubleshooting Guide
- View all Protocols, Troubleshooting, Illustrated assays and Webinars
FAQs for HIF-1 alpha Antibody (H1alpha67)
Showing
1
-
5 of
34 FAQs
Showing All
-
Q: Could you tell me the epitope of #NB100-105?
A: We seldom map our antibodies, including monoclonals. Therefore, we do not know where this monoclonal antibody binds to in HIF-1 alpha. However, the region containing the epitope for NB100-105 could be located in the a.a. sequence used as the immunogen for raising the antibody. According to the datasheet, the immunogen for NB100-105 was: "... amino acids 432-528 of human HIF-1 alpha. [UniProt# Q16665]."
-
Q: Can HIF-1 alpha Antibody (Dylight 488), product NB100-479G, react with goat species? Does this product have preservatives in it?
A:
NB100-479G has not been tested in goat species. Only the listed species on the product page and datasheet will be guaranteed.
Reactivity: Hu, Mu, Rt, Ca, Fi, Ha, Pm, Rb
The immunogen for this antibody corresponds to amino acids 530-825 of mouse Hifa. Running a sequence alignment of this sequence with the goat sequence found on UniProt yields around 81% homology.Mouse Hif1a: https://www.uniprot.org/uniprot/Q61221#sequences
Goat Hif1a: https://www.uniprot.org/uniprot/A0A023R978#sequencesLastly, there is 0.05% Sodium Azide present in the formulation of the product. This is also listed on the product page and datasheet.
Buffer: 50mM Sodium Borate
Preservative: 0.05% Sodium Azide -
Q: Can I get a sample of the HIF1A antibody (NB100-105)?
A: We do offer this antibody in a sample size which contains 0.025ml of antibody. The sample size catalog number is NB100-105SS.
-
Q: Could you advise if I can use NBP1-96969 Ab as a control Ab for HIF1a for ChIP assay. I have a problem that normal rabbit IgG that usually are provided in the ChIP kits show higher binding compare to NB100-105 HIF1A Ab. Could you suggest if it is better to use Mouse IgG 2b Isotype control in this case or normal rabbit IgG should work as well? NBP1-96969 Ab are not validated for ChIP, please, let me know if there is something better?
A: Yes, it would be reasonable to use a mouse IgG2b control for NB100-105 (HIF1 alpha) in ChIP assay. The control provided in the ChIP kit is recommended as a control for the histone antibodies (which are rabbit polyclonal). NBP1-96969 would be a good choice for control for the mouse monoclonal NB100-105. It has not yet been validated for ChIP, but it has been validated for use in IP, so I think it will be a good choice for control.
-
Q: Could you clarify if Yeast is a reactive species for HIF1a product #NB100-105?
A: This HIF-1 alpha antibody has not been tested in yeast. The homology is not significantly homologous so we do not believe there will be cross reactivity to the yeast protein.
-
Q: Could you tell us if these antibodies need to use cell lysate treated with special extraction for WB? Do you have the recommended preparation method of cell lysate?
A:
Usually HIF1 alpha and HIF2 alpha are hard to detect endogenously and require some inducement. The most common is hypoxic treatment of the cells. This can be also be chemically induced by CoCl2 treatment as well. Our recommended protocols and lysate preparations can be found in our white paper here
-
Q: Do you have any suggested IHC Protocol for this antibody? We had been trying to validate protocols from other research studies but failed to get good results. Background staining seems to be the problem.
A: Yes, we have a specific IHC protocol for NB100-105. It is located on the datasheet under the "Protocols & FAQs" tab. We also have over 300 publications that utilize this product. If you need help finding a specific paper or if you would like us to help troubleshoot your experiment, please contact Technical Support.
-
Q: Has anyone used this antibody for supershft in EMSA?
A: Yes, this antibody is useful for EMSA and has been documented in couple of recent research publications. You may refer to the following paper for details: Kong D, et al. Echinomycin, a small-molecule inhibitor of hypoxia-inducible factor-1 DNA-binding activity. Cancer Res. 2005 Oct 1;65(19):9047-55 [PMID: 16204079].
-
Q: I am curious to know the biochemical reactions of CoCl2 that mimic hypoxia. Is it that CoCl2 can bind any ubiquitin enzyme which regulates their degradation?
A:
CoCl2 inhibits PHD enzymes (the body’s “oxygen sensors”) by replacing the Fe ion with Co, preventing these enzymes from marking HIF-1 alpha for degradation. CoCl2-based hypoxia mimetic samples are often used as positive control in HIF analysis. For more troubleshooting tips and frequently asked questions regarding hypoxia/HIFs, you can refer to our hypoxia-related FAQs.
-
Q: I am doing HIF1 westerns in HIF-overexpressing mouse liver and adipose tissue using Novus antirabbit HIF1a antibody with overnight incubation. I am getting strong bands around 90kDa. I am aware that HIF theoretical molecular weight is 93kDa, but in westerns, the HIF band is usually around 120kDa according to my internet research. Can someone let me know if I’m getting the right HIF band or just some non-specific bands? Thanks.
A:
(1) HIF-1 alpha’s theoretical molecular weight is 93kDa. The post translationally modified/ubiquitinated form of HIF-1 alpha protein (fails to undergo proteasomal degradation) shows up as a band in the 110-130 kDa range on a Western blot.
(2) The dimeric protein may appear at a position above 200 kDa on non-reducing gels.
(3) Importantly, HIFs are among the most rapidly degradable proteins; therefore, sample preparation is highly important when analyzing HIF1 alpha or HIF2 alpha. When degraded, HIF-1 alpha may show up between 40-80 kDa position on Western blot. Degradation may be avoided by preparing the samples as soon as possible after collection of cells/tissues in hypoxic chamber. Notably, the tissues/cells should be kept on ice during lysate preparation and the lysates should be analyzed as soon as possible.
(4) For troubleshooting suggestions/feedback on more than 25 similar frequently asked questions, I would recommend visiting Novus page: FAQs - Hypoxia and HIFs
(5) Last but not the least, Novus technical support team may be contacted via email -
Q: I am using HIF1 alpha antibody NB100-105 for Western blot. Do you have any recommendations on the preparation of lysates? Also, what positive control do you suggest for WB with HIF1 alpha antibody NB100-105?
A:
HIF1a protein is known to degrade easily in presence of oxygen. For this reason the conditions for lysate preparation are crucial, we strongly recommend lysing cells quickly under cold condition by putting cell plates on ice and saving the lysates directly into the SDS-loading buffer. If nuclear fraction is desired we recommend using hypotonic buffer. You can see specific instructions for WB with HIF1 alpha antibody NB100-105 here. We recommend lysate from cells cultured in hypoxic conditions or in presence of CoCL2, which stabilizes HIF1a. We also have several controls available on our website: HeLa Hypoxic/Normoxic Cell Lysate: NBP2-36452; HeLa Hypoxic (CoCl2)/Normoxic Lysate: NBP2-36450; etc.
-
Q: I am wondering if you sell a blocking peptide for the HIF1a antibody cat # NB100-105?
A: We unfortunately do not sell the blocking immunogen for our product NB100-105. I am sorry for any inconvenience.
-
Q: I am working on a WB using the antibody against mouse HIF1a and HIF2a (catalog numbers NB100-105 and NB100-122). I tried several anti-mouse and anti-rabbit HRP secondary antibodies (from another company) and found they gave different patterns. Please provide the secondary antibody info which was used in the WB showed on the datasheet.
A: We use catalog numbers NB7570 and NB7183 as our secondary antibodies for testing these antibodies in WB.
-
Q: I did staining of 150uM Cobalt chloride induced 3T12 for 24 hours using this HIF1alpha antibody. I used a 1:50 dilution for one hour at room temperature. Should I do an overnight incubation?
A: We do recommend incubating samples overnight at 4 degrees Celsius for the best results.
-
Q: I have Hif1a nuclear protein extract at -80C. I am wondering if anyone knows how long it would be good for at that temperature since HIf1a is known to be degraded easily.
Thank you!A: You could try a few things to further inhibit the degradation.
1) Use the protease inhibitors (if you are not already using them).
2) Lyse cells into a buffer that contains SDS or LDS (eg: Laemmli's buffer), since SDS and LDS denature and inhibit proteases. Lysis may even be performed with reducing agents in the buffer (eg. DTT), but this will make your lysates unsuitable for BCA assay.
3) Lysing samples rapidly ensures that the samples are instantly homogenized (it also shears DNA released by the SDS).
5) Flash-freezing samples in liquid nitrogen rather than freezing at -80*C reduces the window of time for protease activity.
6) Freeze samples in individual aliquots, instead of thawing the same vial multiple times. -
Q: I performed several Western Blots of HIF-1 alpha with different lysis buffers, whole lysates, and cytoplasm/nuclei extractions. I can’t seem to get a good western blot (poor signal, band much lower than expected, etc.). Can someone suggest some technical considerations/tricks I should consider using?
A:
A major issue that researchers working with HIF-1 alpha is degradation due to exposure to oxygen. In western blot, this results in a weaker band and/or the appearance of multiple low molecular weight bands (40-80 kDa). We recommend preparing the lysates after collection of cells/tissues as quickly as possible (on ice), preferably in a hypoxic chamber. We also recommend including a true hypoxia mimetic control (eg: cells treated with CoCl2, DMOG… etc.). The controls help distinguish your band of interest from potential degradation/dimer bands.
For more troubleshooting tips and frequently asked questions regarding hypoxia/HIFs, you can refer to our hypoxia-related FAQs. -
Q: I would like to know why I have to dilute 1:500 the primary antibody. How can I know which is the best dilution (or what amount of antibody I need to take) to my sample in the WB?
A: Our recommended dilution for use of NB100-105 in western blot is 1:500. You may need to adjust this dilution depending on the signal you are able to detect in your samples. I would recommend using a titer with 1:500 as the starting point to find the optimal dilution to use in your experiment.
-
Q: I would like to know, does a path exist for detection of HIF 1 in venous blood before and after revascularization of the leg?
A: We are not entirely sure if HIF-1 alpha will be present in the leg after revascularization. It may be present, but you may want to search the literature to see if this has been looked at before. If not, then this would certainly be an experiment worth doing.
-
Q: Is cross-reactivity with HIF-2 alpha tested/predicted?
A: Although we don’t have cross-reactivity data with regards to HIF-2 alpha, we predict minimal cross-reactivity based on low sequence similarity observed from BLAST analysis between HIF-1 alpha and HIF-2 alpha.
-
Q: Is there a product available to be used as the blocking peptide of NB100-105?
A: We unfortunately do not have a blocking peptide for NB100-105. It was raised against a fusion protein. We also unfortunately do not sell the protein.
-
Q: Is this antibody used for intracellular staining?
A:
NB100-105 detects HIF-1 alpha, which is a nuclear protein, so you would want to consult our intracellular nuclear target flow protocol
-
Q: NB100-105 has the same clone name (H1alpha67) as NB100-123.
Are these the same clone?A:
These are the same clones, however their purifications are slightly different (and thus their recommended dilutions for certain applications are a bit different, please see the section "Applications/Dilutions" on the specific product pages for differences).
NB100-123: Protein A purified
The basis for purification of IgG, IgG fragments and IgG subclasses is the high affinity of protein A and protein G for the Fc region of polyclonal and monoclonal IgG-type antibodies. Protein A and protein G are bacterial proteins, which, when coupled to chromatography matrix such as Agarose or Sepharose, generate exceptionally useful, easy to use media (resin) for many routine applications. Protein A/G is a recombinant of Protein A and Protein G that has the additive binding properties of both proteins. Protein A, protein G and protein A/G can be used for purification of monoclonal IgG-type antibodies, purification of polyclonal IgG subclasses, and the adsorption and purification of immune complexes involving IgG. IgG subclasses can be isolated from cell culture supernatants and serum and from ascites fluid.
Lastly, we have been producing NB100-105 for a longer time period, and thus why it has considerably more publication references than NB100-123. -
Q: Our lab recently ordered NB100-449, HIF-1 alpha antibody. Unfortunately an inexperienced technician stored it at -20C rather than 4C for approximately 2 days. Have you done any tests to determine antibody functionality if frozen?
A: The recommended storage condition of HIF-1 alpha antibody NB100-449 is 4C and we highly recommended not storing the product lower than the freezing point, as it may potentially disrupt the protein folding and destroy the antigen binding site of the antibody. Since we likely have not tested a storage condition of -20C for this antibody, we cannot really say if this antibody has been impaired by the storage condition. Our recommendation would be to test the antibody in a small portion of your treated cell line and see if the antibody is still reactive to the HIF-1 alpha protein.
-
Q: Since HIF-1 is nuclear protein, why is there obvious staining in the cytoplasm, which is displayed in the IHC image on the product website. Can you be so kind to help me?
A:
HIF1-alpha is found at very low levels in the cytoplasm under normoxic conditions. During hypoxia, HIF1-alpha is stabilized and translocates to the nucleus to act as a transcription factor. You would therefore expect to see nuclear staining in your hypoxic samples, but may also observe faint cytoplasmic staining in relation to degraded HIF in the samples. HIF proteins are notoriously difficult to work with, as they degrade very rapidly. The cytoplasmic staining is a result of HIF1-alpha degradation. I hope that this helps. You may find our guide to working with hypoxia antibodies to be useful.
-
Q: We got the Hif1a (NB100-105) antibody from you guys. I used the concentration that is mentioned on your website, but I am getting a band of a completely different size (~70kDa) and not the 120 kDa mentioned.
A:
HIF-1 alpha is a notoriously difficult protein to work with due to its rapid degradation. Therefore, the ~70kDa bands are most likely degradation products. It is very important to lyse the cells in hypoxic conditions. We strongly recommend lysing the cells directly into the Laemmli buffer and doing that quickly, so that the exposure to oxygen is minimized.
Please go through our hypoxia related FAQs, you should find them very informative.Also, running a positive control may help confirm the band specificity in your samples. You may prepare them yourself or choose some from our catalog, for example:
1) HeLa Hypoxic / Normoxic Cell Lysate (NBP2-36452)
2) HeLa Hypoxic (CoCl2) / Normoxic Cell Lysate (NBP2-36450) -
Q: We ordered and received the HIF-1 alpha antibody NB100-449 and on the packing slip it says that is prepared in TBS+0.1% BSA. I will be using it for western blots. DO you think my choice of blocking buffer (milk or Blotto) could interfere with the activity of this antibody or should it be necessarily BSA based?
A:
Choice of blocking buffer is entirely within your discretion; it will not affect the antibody binding activity. Please note, some blocking buffers may work better than others and sometimes optimization is needed.
When working with hypoxia there are other important factors to consider, as HIF-alpha is very easily degraded. The lysates should be freshly prepared. Also lysate preparation should be as quick as possible to avoid any exposure to oxygen - we recommend lysing cells directly into the SDS sample loading buffer (Laemmli buffer). We also highly recommend using positive control (you can prepare them yourself or choose some of those we have for sale).
I have attached some additional information that you may find quite useful. Also here are some hypoxia related FAQ addressing common concerns. -
Q: We see high background in our western blots using GAPDH antibodies H00002483-M01 and NB100-105.
A: To avoid multiple bands, we suggest:
1) Using a nitrocellulose membrane. It produces less background compared to PVDF membranes.
2) Overnight blocking at 4℃.
3) Increasing the wash time. Try washing the membrane for 10 mins, repeating 4 times. -
Q: What is the difference between NB100-105 and NB100-123?
A: NB100-105 and NB100-123 are similar as far as immunogens and clones are concerned. However, they are different with respect to their purification process, concentrations and recommended dilutions. NB100-123 is Protein A purified IgG2b with a concentration of 1.5 mg/ml, whereas NB100-105 is Protein G purified IgG2b with 4.0 mg/ml concentration. Another difference is the recommended dilutions (because of the differences in their concentration).
-
Q: What is the difference in the following two HIF-1 alpha antibodies? Catalog # NB100-105 and NB100-134
A: NB100-105 is a mouse monoclonal antibody, whereas NB100-134 is a rabbit polyclonal. They both use the same immunogen.
-
Q: What is the molecular weight (kDa) of protein HIF 1 alpha in western blot?
A: The theoretical molecular weight of HIF 1-alpha is ~93kDa. However, you will likely see a band between 100-120kDa due to phosphorylation.
-
Q: What's the difference between NBP2-75977 vs NBP2-75978?
A: While the same immunogen was used to make both HIF-1 alpha antibodies, they are different clones, meaning they recognize a different epitope on the immunogen.
-
Q: Which antibody(ies) do you recommend for the detection of HIF-1a by immunohistochemistry in the sections of paraffin-embedded mouse liver samples? I would appreciate if you can give me several choices and rank them in the order of performance. My goal is to distinguish HIF upregulation by prolyl hydroxylase inhibitor in different liver cells.
A: All of our antibodies are of high quality and are well tested/validated in species/applications we list on the datasheet. However, we suggest the following four HIF-1 alpha antibodies based upon customer reviews, as well as the number of peer reviewed publications in which these products have been cited by researchers from reputed institutes. (1) HIF-1 alpha Antibody (H1alpha67) (cat# NB100-105) (cited in at least 218 peer reviewed publications) (2) HIF-1 alpha Antibody (cat# NB100-479) (cited in at least 51 peer reviewed publications) (3) HIF-1 alpha Antibody (H1alpha67) (cat# NB100-123 ) (cited in at least 38 peer reviewed publications) (4) HIF-1 alpha Antibody (cat# NB100-449) (cited in at least 31 peer reviewed publications).
-
Q: Why is there a difference between the theoretical MW for HIF1A and the observed MW for HIF-1 alpha?
A: HIF1A, like many other proteins, has post-translational modifications. Depending on the size, amount and nature of the post-translational modifications, it can cause subtle to very large changes in molecular weight.
-
Q: Would you be able to share the concentration of NB100-105 – HIF-1 alpha mAb from Lot# AB1?
A: The concentration of NB100-105 Lot AB1 is 4.0mg/ml.
-
Q: Could you tell me the epitope of #NB100-105?
A: We seldom map our antibodies, including monoclonals. Therefore, we do not know where this monoclonal antibody binds to in HIF-1 alpha. However, the region containing the epitope for NB100-105 could be located in the a.a. sequence used as the immunogen for raising the antibody. According to the datasheet, the immunogen for NB100-105 was: "... amino acids 432-528 of human HIF-1 alpha. [UniProt# Q16665]."
-
Q: Can HIF-1 alpha Antibody (Dylight 488), product NB100-479G, react with goat species? Does this product have preservatives in it?
A:
NB100-479G has not been tested in goat species. Only the listed species on the product page and datasheet will be guaranteed.
Reactivity: Hu, Mu, Rt, Ca, Fi, Ha, Pm, Rb
The immunogen for this antibody corresponds to amino acids 530-825 of mouse Hifa. Running a sequence alignment of this sequence with the goat sequence found on UniProt yields around 81% homology.Mouse Hif1a: https://www.uniprot.org/uniprot/Q61221#sequences
Goat Hif1a: https://www.uniprot.org/uniprot/A0A023R978#sequencesLastly, there is 0.05% Sodium Azide present in the formulation of the product. This is also listed on the product page and datasheet.
Buffer: 50mM Sodium Borate
Preservative: 0.05% Sodium Azide -
Q: Can I get a sample of the HIF1A antibody (NB100-105)?
A: We do offer this antibody in a sample size which contains 0.025ml of antibody. The sample size catalog number is NB100-105SS.
-
Q: Could you advise if I can use NBP1-96969 Ab as a control Ab for HIF1a for ChIP assay. I have a problem that normal rabbit IgG that usually are provided in the ChIP kits show higher binding compare to NB100-105 HIF1A Ab. Could you suggest if it is better to use Mouse IgG 2b Isotype control in this case or normal rabbit IgG should work as well? NBP1-96969 Ab are not validated for ChIP, please, let me know if there is something better?
A: Yes, it would be reasonable to use a mouse IgG2b control for NB100-105 (HIF1 alpha) in ChIP assay. The control provided in the ChIP kit is recommended as a control for the histone antibodies (which are rabbit polyclonal). NBP1-96969 would be a good choice for control for the mouse monoclonal NB100-105. It has not yet been validated for ChIP, but it has been validated for use in IP, so I think it will be a good choice for control.
-
Q: Could you clarify if Yeast is a reactive species for HIF1a product #NB100-105?
A: This HIF-1 alpha antibody has not been tested in yeast. The homology is not significantly homologous so we do not believe there will be cross reactivity to the yeast protein.
-
Q: Could you tell us if these antibodies need to use cell lysate treated with special extraction for WB? Do you have the recommended preparation method of cell lysate?
A:
Usually HIF1 alpha and HIF2 alpha are hard to detect endogenously and require some inducement. The most common is hypoxic treatment of the cells. This can be also be chemically induced by CoCl2 treatment as well. Our recommended protocols and lysate preparations can be found in our white paper here
-
Q: Do you have any suggested IHC Protocol for this antibody? We had been trying to validate protocols from other research studies but failed to get good results. Background staining seems to be the problem.
A: Yes, we have a specific IHC protocol for NB100-105. It is located on the datasheet under the "Protocols & FAQs" tab. We also have over 300 publications that utilize this product. If you need help finding a specific paper or if you would like us to help troubleshoot your experiment, please contact Technical Support.
-
Q: Has anyone used this antibody for supershft in EMSA?
A: Yes, this antibody is useful for EMSA and has been documented in couple of recent research publications. You may refer to the following paper for details: Kong D, et al. Echinomycin, a small-molecule inhibitor of hypoxia-inducible factor-1 DNA-binding activity. Cancer Res. 2005 Oct 1;65(19):9047-55 [PMID: 16204079].
-
Q: I am curious to know the biochemical reactions of CoCl2 that mimic hypoxia. Is it that CoCl2 can bind any ubiquitin enzyme which regulates their degradation?
A:
CoCl2 inhibits PHD enzymes (the body’s “oxygen sensors”) by replacing the Fe ion with Co, preventing these enzymes from marking HIF-1 alpha for degradation. CoCl2-based hypoxia mimetic samples are often used as positive control in HIF analysis. For more troubleshooting tips and frequently asked questions regarding hypoxia/HIFs, you can refer to our hypoxia-related FAQs.
-
Q: I am doing HIF1 westerns in HIF-overexpressing mouse liver and adipose tissue using Novus antirabbit HIF1a antibody with overnight incubation. I am getting strong bands around 90kDa. I am aware that HIF theoretical molecular weight is 93kDa, but in westerns, the HIF band is usually around 120kDa according to my internet research. Can someone let me know if I’m getting the right HIF band or just some non-specific bands? Thanks.
A:
(1) HIF-1 alpha’s theoretical molecular weight is 93kDa. The post translationally modified/ubiquitinated form of HIF-1 alpha protein (fails to undergo proteasomal degradation) shows up as a band in the 110-130 kDa range on a Western blot.
(2) The dimeric protein may appear at a position above 200 kDa on non-reducing gels.
(3) Importantly, HIFs are among the most rapidly degradable proteins; therefore, sample preparation is highly important when analyzing HIF1 alpha or HIF2 alpha. When degraded, HIF-1 alpha may show up between 40-80 kDa position on Western blot. Degradation may be avoided by preparing the samples as soon as possible after collection of cells/tissues in hypoxic chamber. Notably, the tissues/cells should be kept on ice during lysate preparation and the lysates should be analyzed as soon as possible.
(4) For troubleshooting suggestions/feedback on more than 25 similar frequently asked questions, I would recommend visiting Novus page: FAQs - Hypoxia and HIFs
(5) Last but not the least, Novus technical support team may be contacted via email -
Q: I am using HIF1 alpha antibody NB100-105 for Western blot. Do you have any recommendations on the preparation of lysates? Also, what positive control do you suggest for WB with HIF1 alpha antibody NB100-105?
A:
HIF1a protein is known to degrade easily in presence of oxygen. For this reason the conditions for lysate preparation are crucial, we strongly recommend lysing cells quickly under cold condition by putting cell plates on ice and saving the lysates directly into the SDS-loading buffer. If nuclear fraction is desired we recommend using hypotonic buffer. You can see specific instructions for WB with HIF1 alpha antibody NB100-105 here. We recommend lysate from cells cultured in hypoxic conditions or in presence of CoCL2, which stabilizes HIF1a. We also have several controls available on our website: HeLa Hypoxic/Normoxic Cell Lysate: NBP2-36452; HeLa Hypoxic (CoCl2)/Normoxic Lysate: NBP2-36450; etc.
-
Q: I am wondering if you sell a blocking peptide for the HIF1a antibody cat # NB100-105?
A: We unfortunately do not sell the blocking immunogen for our product NB100-105. I am sorry for any inconvenience.
-
Q: I am working on a WB using the antibody against mouse HIF1a and HIF2a (catalog numbers NB100-105 and NB100-122). I tried several anti-mouse and anti-rabbit HRP secondary antibodies (from another company) and found they gave different patterns. Please provide the secondary antibody info which was used in the WB showed on the datasheet.
A: We use catalog numbers NB7570 and NB7183 as our secondary antibodies for testing these antibodies in WB.
-
Q: I did staining of 150uM Cobalt chloride induced 3T12 for 24 hours using this HIF1alpha antibody. I used a 1:50 dilution for one hour at room temperature. Should I do an overnight incubation?
A: We do recommend incubating samples overnight at 4 degrees Celsius for the best results.
-
Q: I have Hif1a nuclear protein extract at -80C. I am wondering if anyone knows how long it would be good for at that temperature since HIf1a is known to be degraded easily.
Thank you!A: You could try a few things to further inhibit the degradation.
1) Use the protease inhibitors (if you are not already using them).
2) Lyse cells into a buffer that contains SDS or LDS (eg: Laemmli's buffer), since SDS and LDS denature and inhibit proteases. Lysis may even be performed with reducing agents in the buffer (eg. DTT), but this will make your lysates unsuitable for BCA assay.
3) Lysing samples rapidly ensures that the samples are instantly homogenized (it also shears DNA released by the SDS).
5) Flash-freezing samples in liquid nitrogen rather than freezing at -80*C reduces the window of time for protease activity.
6) Freeze samples in individual aliquots, instead of thawing the same vial multiple times. -
Q: I performed several Western Blots of HIF-1 alpha with different lysis buffers, whole lysates, and cytoplasm/nuclei extractions. I can’t seem to get a good western blot (poor signal, band much lower than expected, etc.). Can someone suggest some technical considerations/tricks I should consider using?
A:
A major issue that researchers working with HIF-1 alpha is degradation due to exposure to oxygen. In western blot, this results in a weaker band and/or the appearance of multiple low molecular weight bands (40-80 kDa). We recommend preparing the lysates after collection of cells/tissues as quickly as possible (on ice), preferably in a hypoxic chamber. We also recommend including a true hypoxia mimetic control (eg: cells treated with CoCl2, DMOG… etc.). The controls help distinguish your band of interest from potential degradation/dimer bands.
For more troubleshooting tips and frequently asked questions regarding hypoxia/HIFs, you can refer to our hypoxia-related FAQs. -
Q: I would like to know why I have to dilute 1:500 the primary antibody. How can I know which is the best dilution (or what amount of antibody I need to take) to my sample in the WB?
A: Our recommended dilution for use of NB100-105 in western blot is 1:500. You may need to adjust this dilution depending on the signal you are able to detect in your samples. I would recommend using a titer with 1:500 as the starting point to find the optimal dilution to use in your experiment.
-
Q: I would like to know, does a path exist for detection of HIF 1 in venous blood before and after revascularization of the leg?
A: We are not entirely sure if HIF-1 alpha will be present in the leg after revascularization. It may be present, but you may want to search the literature to see if this has been looked at before. If not, then this would certainly be an experiment worth doing.
-
Q: Is cross-reactivity with HIF-2 alpha tested/predicted?
A: Although we don’t have cross-reactivity data with regards to HIF-2 alpha, we predict minimal cross-reactivity based on low sequence similarity observed from BLAST analysis between HIF-1 alpha and HIF-2 alpha.
-
Q: Is there a product available to be used as the blocking peptide of NB100-105?
A: We unfortunately do not have a blocking peptide for NB100-105. It was raised against a fusion protein. We also unfortunately do not sell the protein.
-
Q: Is this antibody used for intracellular staining?
A:
NB100-105 detects HIF-1 alpha, which is a nuclear protein, so you would want to consult our intracellular nuclear target flow protocol
-
Q: NB100-105 has the same clone name (H1alpha67) as NB100-123.
Are these the same clone?A:
These are the same clones, however their purifications are slightly different (and thus their recommended dilutions for certain applications are a bit different, please see the section "Applications/Dilutions" on the specific product pages for differences).
NB100-123: Protein A purified
The basis for purification of IgG, IgG fragments and IgG subclasses is the high affinity of protein A and protein G for the Fc region of polyclonal and monoclonal IgG-type antibodies. Protein A and protein G are bacterial proteins, which, when coupled to chromatography matrix such as Agarose or Sepharose, generate exceptionally useful, easy to use media (resin) for many routine applications. Protein A/G is a recombinant of Protein A and Protein G that has the additive binding properties of both proteins. Protein A, protein G and protein A/G can be used for purification of monoclonal IgG-type antibodies, purification of polyclonal IgG subclasses, and the adsorption and purification of immune complexes involving IgG. IgG subclasses can be isolated from cell culture supernatants and serum and from ascites fluid.
Lastly, we have been producing NB100-105 for a longer time period, and thus why it has considerably more publication references than NB100-123. -
Q: Our lab recently ordered NB100-449, HIF-1 alpha antibody. Unfortunately an inexperienced technician stored it at -20C rather than 4C for approximately 2 days. Have you done any tests to determine antibody functionality if frozen?
A: The recommended storage condition of HIF-1 alpha antibody NB100-449 is 4C and we highly recommended not storing the product lower than the freezing point, as it may potentially disrupt the protein folding and destroy the antigen binding site of the antibody. Since we likely have not tested a storage condition of -20C for this antibody, we cannot really say if this antibody has been impaired by the storage condition. Our recommendation would be to test the antibody in a small portion of your treated cell line and see if the antibody is still reactive to the HIF-1 alpha protein.
-
Q: Since HIF-1 is nuclear protein, why is there obvious staining in the cytoplasm, which is displayed in the IHC image on the product website. Can you be so kind to help me?
A:
HIF1-alpha is found at very low levels in the cytoplasm under normoxic conditions. During hypoxia, HIF1-alpha is stabilized and translocates to the nucleus to act as a transcription factor. You would therefore expect to see nuclear staining in your hypoxic samples, but may also observe faint cytoplasmic staining in relation to degraded HIF in the samples. HIF proteins are notoriously difficult to work with, as they degrade very rapidly. The cytoplasmic staining is a result of HIF1-alpha degradation. I hope that this helps. You may find our guide to working with hypoxia antibodies to be useful.
-
Q: We got the Hif1a (NB100-105) antibody from you guys. I used the concentration that is mentioned on your website, but I am getting a band of a completely different size (~70kDa) and not the 120 kDa mentioned.
A:
HIF-1 alpha is a notoriously difficult protein to work with due to its rapid degradation. Therefore, the ~70kDa bands are most likely degradation products. It is very important to lyse the cells in hypoxic conditions. We strongly recommend lysing the cells directly into the Laemmli buffer and doing that quickly, so that the exposure to oxygen is minimized.
Please go through our hypoxia related FAQs, you should find them very informative.Also, running a positive control may help confirm the band specificity in your samples. You may prepare them yourself or choose some from our catalog, for example:
1) HeLa Hypoxic / Normoxic Cell Lysate (NBP2-36452)
2) HeLa Hypoxic (CoCl2) / Normoxic Cell Lysate (NBP2-36450) -
Q: We ordered and received the HIF-1 alpha antibody NB100-449 and on the packing slip it says that is prepared in TBS+0.1% BSA. I will be using it for western blots. DO you think my choice of blocking buffer (milk or Blotto) could interfere with the activity of this antibody or should it be necessarily BSA based?
A:
Choice of blocking buffer is entirely within your discretion; it will not affect the antibody binding activity. Please note, some blocking buffers may work better than others and sometimes optimization is needed.
When working with hypoxia there are other important factors to consider, as HIF-alpha is very easily degraded. The lysates should be freshly prepared. Also lysate preparation should be as quick as possible to avoid any exposure to oxygen - we recommend lysing cells directly into the SDS sample loading buffer (Laemmli buffer). We also highly recommend using positive control (you can prepare them yourself or choose some of those we have for sale).
I have attached some additional information that you may find quite useful. Also here are some hypoxia related FAQ addressing common concerns. -
Q: We see high background in our western blots using GAPDH antibodies H00002483-M01 and NB100-105.
A: To avoid multiple bands, we suggest:
1) Using a nitrocellulose membrane. It produces less background compared to PVDF membranes.
2) Overnight blocking at 4℃.
3) Increasing the wash time. Try washing the membrane for 10 mins, repeating 4 times. -
Q: What is the difference between NB100-105 and NB100-123?
A: NB100-105 and NB100-123 are similar as far as immunogens and clones are concerned. However, they are different with respect to their purification process, concentrations and recommended dilutions. NB100-123 is Protein A purified IgG2b with a concentration of 1.5 mg/ml, whereas NB100-105 is Protein G purified IgG2b with 4.0 mg/ml concentration. Another difference is the recommended dilutions (because of the differences in their concentration).
-
Q: What is the difference in the following two HIF-1 alpha antibodies? Catalog # NB100-105 and NB100-134
A: NB100-105 is a mouse monoclonal antibody, whereas NB100-134 is a rabbit polyclonal. They both use the same immunogen.
-
Q: What is the molecular weight (kDa) of protein HIF 1 alpha in western blot?
A: The theoretical molecular weight of HIF 1-alpha is ~93kDa. However, you will likely see a band between 100-120kDa due to phosphorylation.
-
Q: What's the difference between NBP2-75977 vs NBP2-75978?
A: While the same immunogen was used to make both HIF-1 alpha antibodies, they are different clones, meaning they recognize a different epitope on the immunogen.
-
Q: Which antibody(ies) do you recommend for the detection of HIF-1a by immunohistochemistry in the sections of paraffin-embedded mouse liver samples? I would appreciate if you can give me several choices and rank them in the order of performance. My goal is to distinguish HIF upregulation by prolyl hydroxylase inhibitor in different liver cells.
A: All of our antibodies are of high quality and are well tested/validated in species/applications we list on the datasheet. However, we suggest the following four HIF-1 alpha antibodies based upon customer reviews, as well as the number of peer reviewed publications in which these products have been cited by researchers from reputed institutes. (1) HIF-1 alpha Antibody (H1alpha67) (cat# NB100-105) (cited in at least 218 peer reviewed publications) (2) HIF-1 alpha Antibody (cat# NB100-479) (cited in at least 51 peer reviewed publications) (3) HIF-1 alpha Antibody (H1alpha67) (cat# NB100-123 ) (cited in at least 38 peer reviewed publications) (4) HIF-1 alpha Antibody (cat# NB100-449) (cited in at least 31 peer reviewed publications).
-
Q: Why is there a difference between the theoretical MW for HIF1A and the observed MW for HIF-1 alpha?
A: HIF1A, like many other proteins, has post-translational modifications. Depending on the size, amount and nature of the post-translational modifications, it can cause subtle to very large changes in molecular weight.
-
Q: Would you be able to share the concentration of NB100-105 – HIF-1 alpha mAb from Lot# AB1?
A: The concentration of NB100-105 Lot AB1 is 4.0mg/ml.
Loading...
Associated Pathways


