HIF-2 alpha/EPAS1 Antibody (ep190b)
Novus Biologicals | Catalog # NB100-132
Key Product Details
Validated by
Knockout/Knockdown, Biological Validation
Species Reactivity
Validated:
Human, Mouse, Rat, Bovine, Hamster
Cited:
Human, Mouse, Rat, Bovine, Hamster
Applications
Validated:
Immunohistochemistry, Immunohistochemistry-Paraffin, Immunohistochemistry-Frozen, Western Blot, ELISA, Flow Cytometry, Immunocytochemistry/ Immunofluorescence, Simple Western, Immunoprecipitation, Chromatin Immunoprecipitation (ChIP), In vivo assay, Gel Super Shift Assays, Gel Supershift Assay, Knockdown Validated
Cited:
Immunohistochemistry-Paraffin, Immunohistochemistry-Frozen, Western Blot, ELISA, Flow Cytometry, Immunocytochemistry/ Immunofluorescence, Immunoprecipitation, Chemotaxis, EMSA, IF/IHC, Knockdown Validated
Label
Unconjugated
Antibody Source
Monoclonal Mouse IgG1 Clone # ep190b
Loading...
Product Specifications
Immunogen
The immunogen recognized by this HIF-2 alpha/EPAS1 Antibody (ep190b) maps to a region between amino acids 535-631. [UniProt# Q99814]
Reactivity Notes
Ability to use HIF-2 alpha/EPAS1 Antibody (ep190b) in mouse is mixed with some positive and some negative results. Use in Bovine reported in scientific literature (PMID:32054096).
Specificity
This HIF-2 alpha/EPAS1 Antibody (ep190b) is specific for HIF-2 alpha/EPAS1, and does not cross-react with HIF-1 alpha.
Clonality
Monoclonal
Host
Mouse
Isotype
IgG1
Theoretical MW
96.5 kDa.
Disclaimer note: The observed molecular weight of the protein may vary from the listed predicted molecular weight due to post translational modifications, post translation cleavages, relative charges, and other experimental factors.
Disclaimer note: The observed molecular weight of the protein may vary from the listed predicted molecular weight due to post translational modifications, post translation cleavages, relative charges, and other experimental factors.
Scientific Data Images for HIF-2 alpha/EPAS1 Antibody (ep190b)
![Simple Western: HIF-2 alpha/EPAS1 Antibody (ep190b) [NB100-132]](https://resources.rndsystems.com/images/products/HIF-2-alpha-EPAS1-Antibody-ep190b-Simple-Western-NB100-132-img0009.jpg "Simple Western: HIF-2 alpha/EPAS1 Antibody (ep190b) [NB100-132]")
Simple Western: HIF-2 alpha/EPAS1 Antibody (ep190b) [NB100-132]
Simple Western: HIF-2 alpha/EPAS1 Antibody (ep190b) [NB100-132] - Lane view shows a specific band for HIF-2 alpha in 0.5 mg/mL of Hypoxic HeLa lysate. This experiment was performed under reducing conditions using the 12-230 kDa separation system.![Western Blot: HIF-2 alpha/EPAS1 Antibody (ep190b) [NB100-132]](https://resources.rndsystems.com/images/products/HIF-2-alpha-EPAS1-Antibody-ep190b-Western-Blot-NB100-132-img0017.jpg "Western Blot: HIF-2 alpha/EPAS1 Antibody (ep190b) [NB100-132]")
![Immunohistochemistry-Paraffin: HIF-2 alpha/EPAS1 Antibody (ep190b) [NB100-132]](https://resources.rndsystems.com/images/products/HIF-2-alpha-EPAS1-Antibody-ep190b-Immunohistochemistry-Paraffin-NB100-132-img0018.jpg "Immunohistochemistry-Paraffin: HIF-2 alpha/EPAS1 Antibody (ep190b) [NB100-132]")
Immunohistochemistry-Paraffin: HIF-2 alpha/EPAS1 Antibody (ep190b) [NB100-132]
Immunohistochemistry-Paraffin: HIF-2 alpha/EPAS1 Antibody (ep190b) [NB100-132] - Analysis of HIF-2 in human cardiac myocytes using HIF-2 alpha/EPAS1 Antibody (ep190b).![Flow Cytometry: HIF-2 alpha/EPAS1 Antibody (ep190b) [NB100-132]](https://resources.rndsystems.com/images/products/HIF-2-alpha-EPAS1-Antibody-ep190b-Flow-Cytometry-NB100-132-img0006.jpg "Flow Cytometry: HIF-2 alpha/EPAS1 Antibody (ep190b) [NB100-132]")
Flow Cytometry: HIF-2 alpha/EPAS1 Antibody (ep190b) [NB100-132]
Flow Cytometry: HIF-2 alpha/EPAS1 Antibody (ep190b) [NB100-132] - HIF-2 alpha antibody was tested at 1:400 in HepG2 cells using an Alexa Fluor 488 secondary (shown in purple). M1 is defined by unstained cells.![Western Blot: HIF-2 alpha/EPAS1 Antibody (ep190b) [NB100-132]](https://resources.rndsystems.com/images/products/HIF-2-alpha-EPAS1-Antibody-ep190b-Western-Blot-NB100-132-img0024.jpg "Western Blot: HIF-2 alpha/EPAS1 Antibody (ep190b) [NB100-132]")
Western Blot: HIF-2 alpha/EPAS1 Antibody (ep190b) [NB100-132]
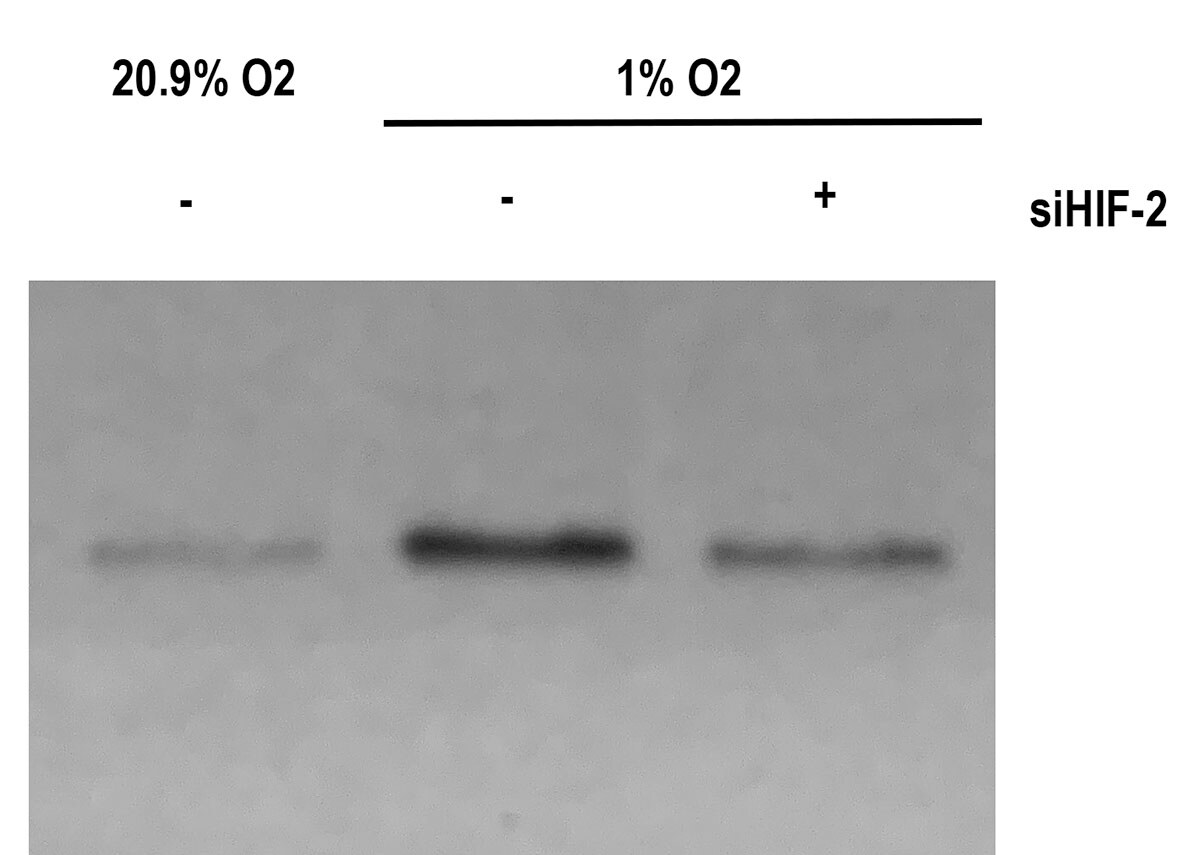
Western Blot: HIF-2 alpha/EPAS1 Antibody (ep190b) [NB100-132] - Mouse aortic endothelial cells treated (1%) or not treated (20.9%) in hypoxia for 3 hrs. Cells where also transfected with a specific siRNA against (siHIF-2) or a control siRNA (-). Western blot image submitted by a verified customer review.![Immunohistochemistry-Paraffin: HIF-2 alpha/EPAS1 Antibody (ep190b) [NB100-132]](https://resources.rndsystems.com/images/products/HIF-2-alpha-EPAS1-Antibody-ep190b-Immunohistochemistry-Paraffin-NB100-132-img0022.jpg "Immunohistochemistry-Paraffin: HIF-2 alpha/EPAS1 Antibody (ep190b) [NB100-132]")
Immunohistochemistry-Paraffin: HIF-2 alpha/EPAS1 Antibody (ep190b) [NB100-132]
HIF-2-alpha-EPAS1-Antibody-ep190b-Immunohistochemistry-Paraffin-NB100-132-img0022.jpg![Western Blot: HIF-2 alpha/EPAS1 Antibody (ep190b) [NB100-132]](https://resources.rndsystems.com/images/products/HIF-2-alpha-EPAS1-Antibody-ep190b-Western-Blot-NB100-132-img0007.jpg "Western Blot: HIF-2 alpha/EPAS1 Antibody (ep190b) [NB100-132]")
Western Blot: HIF-2 alpha/EPAS1 Antibody (ep190b) [NB100-132]
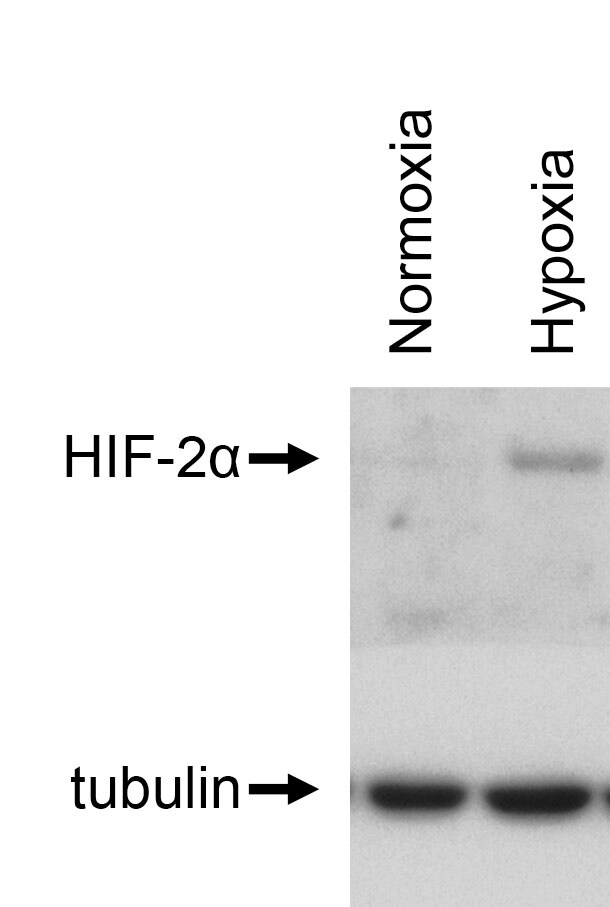
Western Blot: HIF-2 alpha/EPAS1 Antibody (ep190b) [NB100-132] - Analysis of HepG2 without Cobalt (II) Chloride (1), HepG2 with Cobalt (II) Chloride (2), HepG2 normoxic (3), HepG2 hypoxic (4), HepG2 without Cobalt (II) Chloride (5), HepG2 with Cobalt (II) Chloride (6), HepG2 normoxic (7), and HepG2 hypoxic (8) using this antibody (NB100-132) at 1 - 2 ug/mL.![Western Blot: HIF-2 alpha/EPAS1 Antibody (ep190b) [NB100-132]](https://resources.rndsystems.com/images/products/HIF-2-alpha-EPAS1-Antibody-ep190b-Western-Blot-NB100-132-img0019.jpg "Western Blot: HIF-2 alpha/EPAS1 Antibody (ep190b) [NB100-132]")
![Western Blot: HIF-2 alpha/EPAS1 Antibody (ep190b) [NB100-132]](https://resources.rndsystems.com/images/products/HIF-2-alpha-EPAS1-Antibody-ep190b-Western-Blot-NB100-132-img0020.jpg "Western Blot: HIF-2 alpha/EPAS1 Antibody (ep190b) [NB100-132]")
![Western Blot: HIF-2 alpha/EPAS1 Antibody (ep190b) [NB100-132]](https://resources.rndsystems.com/images/products/HIF-2-alpha-EPAS1-Antibody-ep190b-Western-Blot-NB100-132-img0021.jpg "Western Blot: HIF-2 alpha/EPAS1 Antibody (ep190b) [NB100-132]")
![Immunohistochemistry: HIF-2 alpha/EPAS1 Antibody (ep190b) [NB100-132]](https://resources.rndsystems.com/images/products/HIF-2-alpha-EPAS1-Antibody-ep190b-Immunohistochemistry-NB100-132-img0016.jpg "Immunohistochemistry: HIF-2 alpha/EPAS1 Antibody (ep190b) [NB100-132]")
Immunohistochemistry: HIF-2 alpha/EPAS1 Antibody (ep190b) [NB100-132]
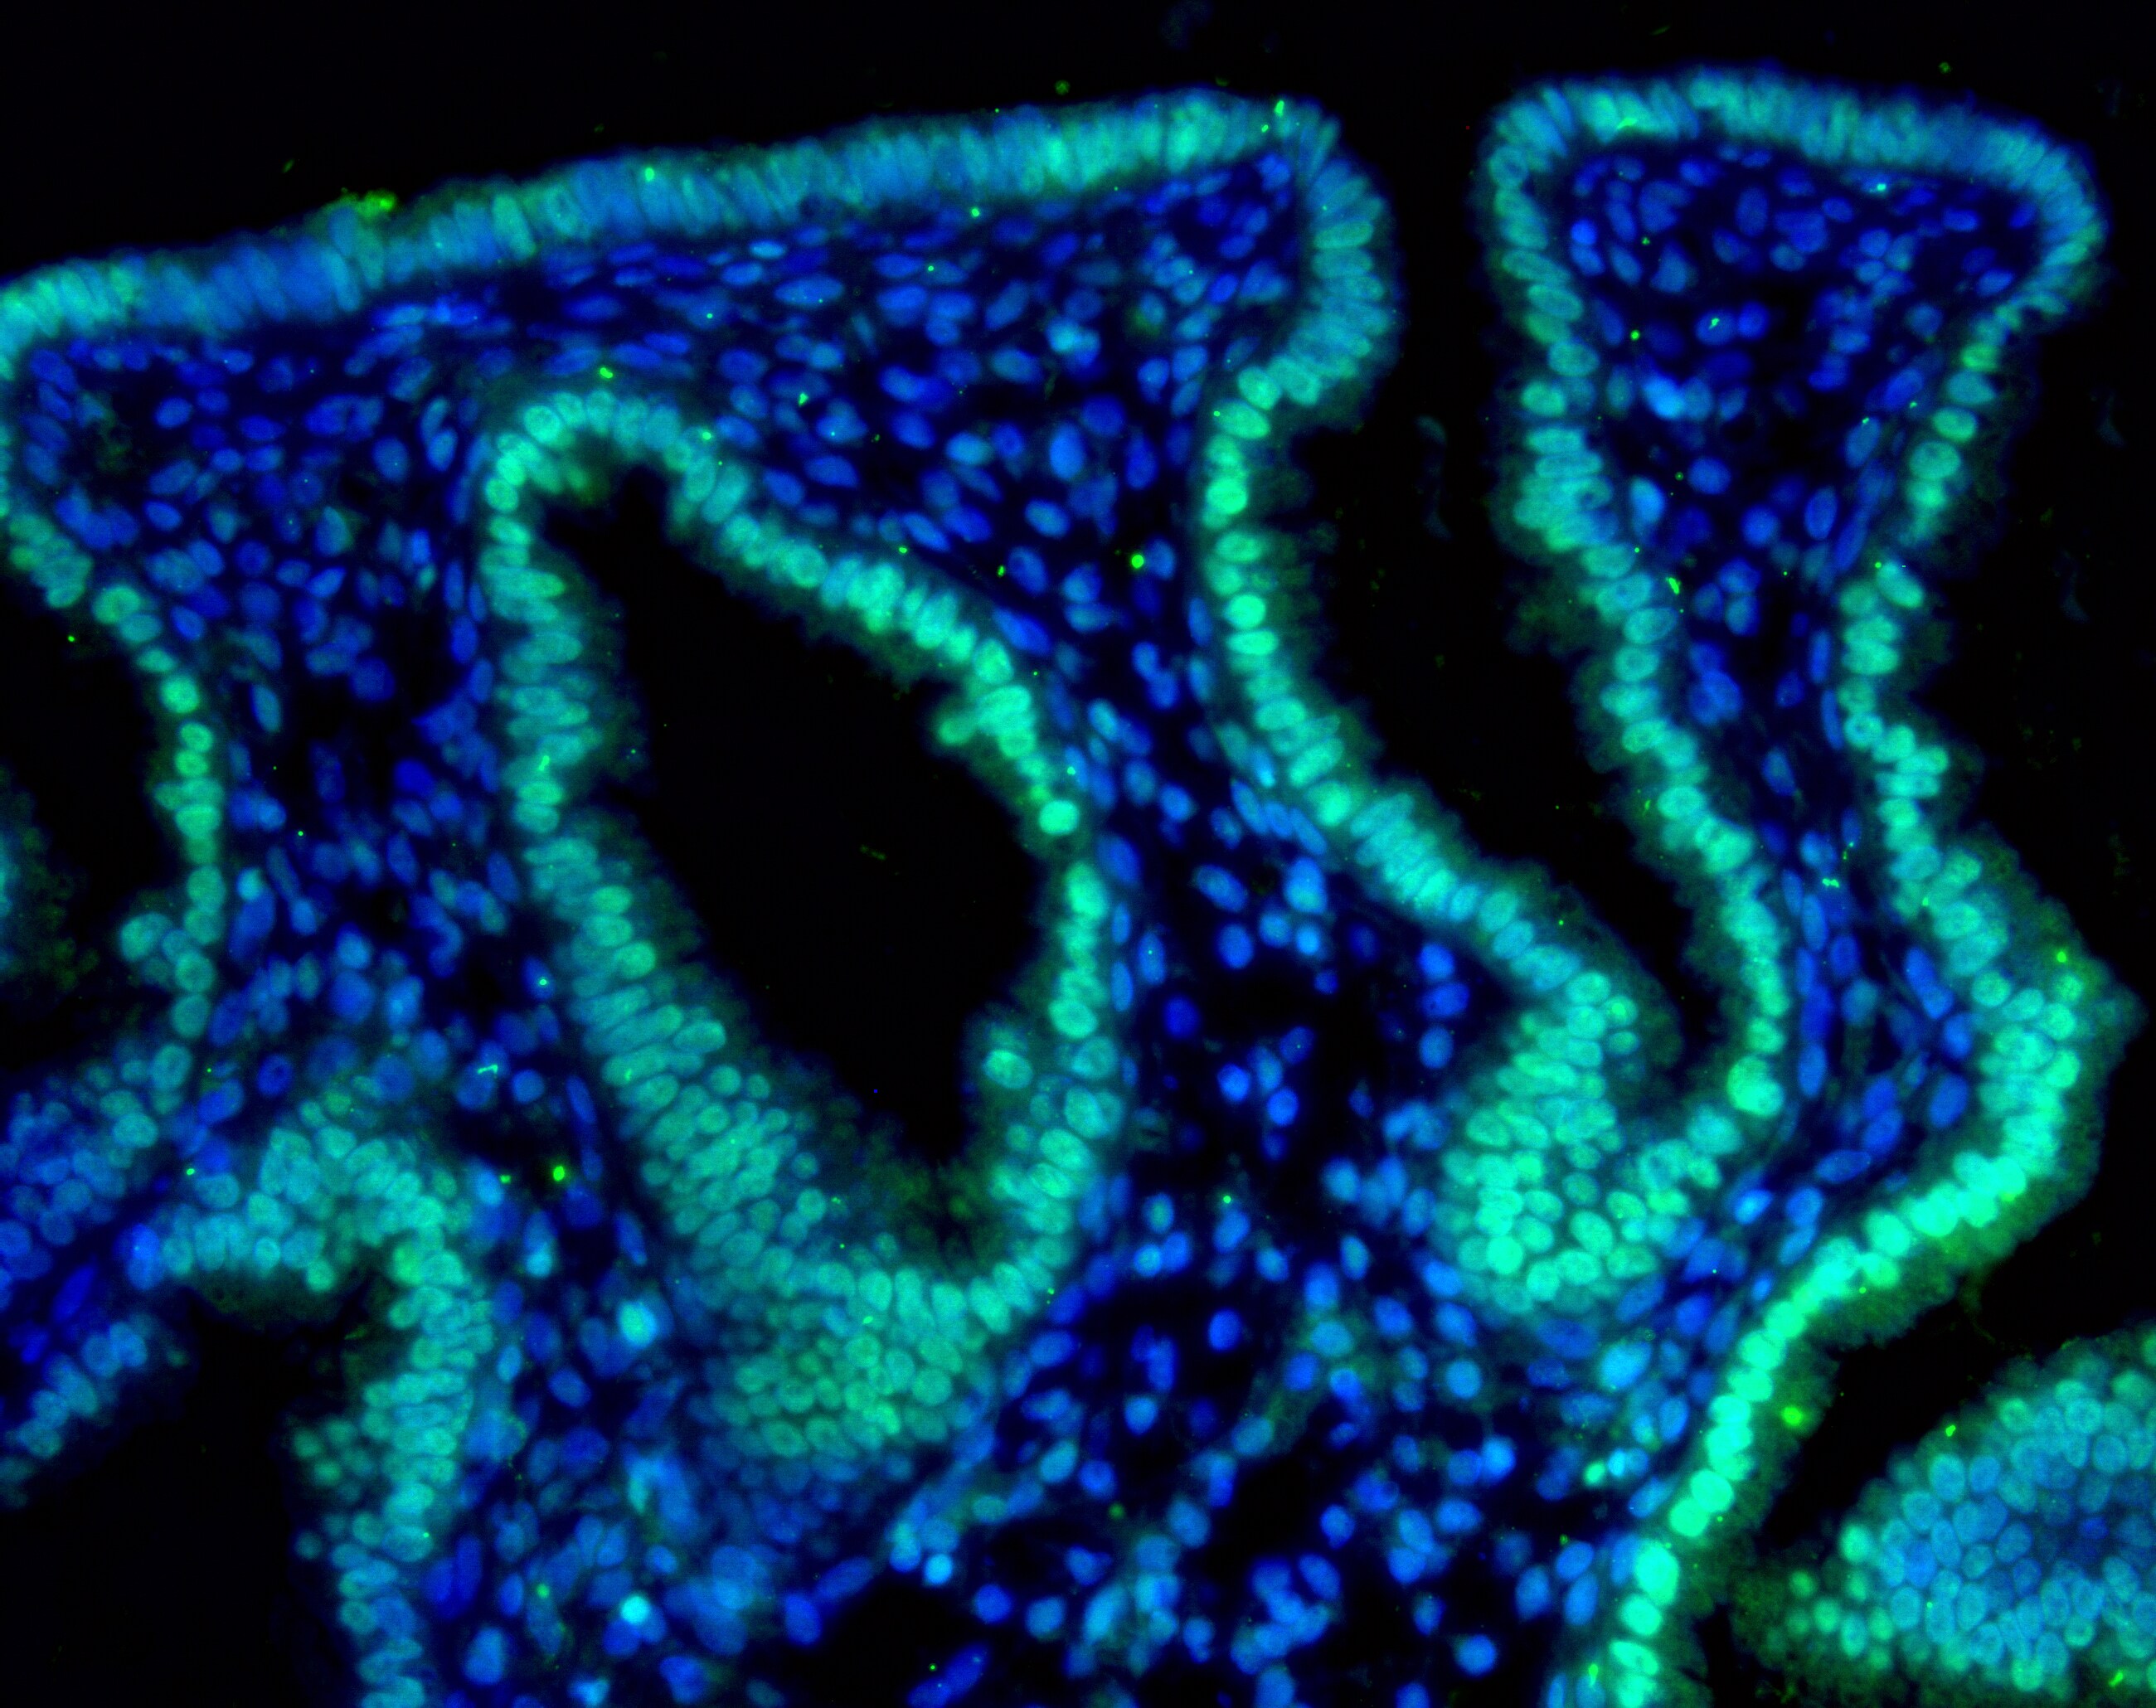
Immunohistochemistry: HIF-2 alpha/EPAS1 Antibody (ep190b) [NB100-132] - Analysis of HIF-2 alpha in human endometrium using. Donkey anti-mouse Alexa Fluor 488 secondary antibody was used. IHC image submitted by a verified customer review.![Knockdown Validated: HIF-2 alpha/EPAS1 Antibody (ep190b) [NB100-132]](https://resources.rndsystems.com/images/products/HIF-2-alpha-EPAS1-Antibody-ep190b-Knockdown-Validated-NB100-132-img0025.jpg "Western Blot: HIF-2 alpha/EPAS1 Antibody (ep190b) [NB100-132]")
 [NB100-132] -")
Immunohistochemistry-Paraffin: HIF-2 alpha/EPAS1 Antibody (ep190b) [NB100-132] -
Immunohistochemistry-Paraffin: HIF-2 alpha/EPAS1 Antibody (ep190b) [NB100-132] - HIF-1 alpha & HIF-2 alpha IHC signals in hypoxic areas of transgenic mouse mammary tumours.A, C Hypoxyprobe (Hyp.pr.) allows visualisation of hypoxic tumour areas. B. Hypoxic peri-necrotic HIF-1 alpha -positive cells display nuclear staining. D. HIF-2 alpha -positive cells show cytoplasmic staining with or without appreciable nuclear staining. * necrosis. E, F. IHC staining for HIF-1 alpha on MCF-7 breast cancer cells grown under control (E) & hypoxic (F) conditions respectively. G, H. Control (G) & hypoxic (H) MCF-7 cells IHC stained for HIF-2 alpha. 20x obj. Insets show magnification of the boxed area. Size bars 50 μm. Image collected & cropped by CiteAb from the following publication (https://dx.plos.org/10.1371/journal.pone.0125771), licensed under a CC-BY license. Not internally tested by Novus Biologicals. [NB100-132] -")
Immunohistochemistry: HIF-2 alpha/EPAS1 Antibody (ep190b) [NB100-132] -
Immunohistochemistry: HIF-2 alpha/EPAS1 Antibody (ep190b) [NB100-132] - HIF-2 alpha expression in the involuting mammary gland.Inserts are enlargements of the indicated areas. Size bars: 50 μm, 40x obj was used in all micrographs. A. In the early involuting gland, the morphology resembles the lactating gland & the basement membrane is evident at this stage. B-D. As tissue remodelling proceeds during involution, the collagen layer becomes unstructured. E-H. HIF-2 alpha -positive cells were detected at all studied stages of involution. I-L. Macrophage infiltration (F4/80 positive) was first evident at the fifth day of involution (J) & increased with time (K, L). Image collected & cropped by CiteAb from the following publication (https://dx.plos.org/10.1371/journal.pone.0125771), licensed under a CC-BY license. Not internally tested by Novus Biologicals. [NB100-132] -")
Western Blot: HIF-2 alpha/EPAS1 Antibody (ep190b) [NB100-132] -
Western Blot: HIF-2 alpha/EPAS1 Antibody (ep190b) [NB100-132] - Oxygen concentration-dependence of dioxygenase inhibition.A. HIF1 alpha, HIF2 alpha, & H3K9me2 abundance by western blotting in shRNA1 & shRNA2 cells incubated in 21%, 10%, or 2% oxygen for 72 h. Actin & total H3 serve as loading controls. B. HIF1 alpha, HIF2 alpha, & H3K9me2 abundance by western blotting in SDHC knockout iMEFs incubated in 21%, 10%, or 2% oxygen for 72 h. iMEFs were treated with 1 μM TAM for 7 d prior to analysis. (C-D) Rescue of succinate inhibition of JMHD & PHD inhibition using 0.25 mM octyl-alpha -ketoglutarate (octyl-alpha -KG) in SDHB knockdown HEK293 cells & SDHC knockout mouse iMEFs. Image collected & cropped by CiteAb from the following publication (https://dx.plos.org/10.1371/journal.pone.0127471), licensed under a CC-BY license. Not internally tested by Novus Biologicals. [NB100-132] -")
Immunohistochemistry-Paraffin: HIF-2 alpha/EPAS1 Antibody (ep190b) [NB100-132] -
Immunohistochemistry-Paraffin: HIF-2 alpha/EPAS1 Antibody (ep190b) [NB100-132] - Lactating mammary gland.Smaller panels display enlargements of the indicated areas. Size bars: 50 μm, 40x obj was used for all micrographs. A. Collagen I IHC allows visualisation of the basement membrane surrounding the dilated ducts. B. HIF-1 alpha was not detected in the epithelial cells of the lactating gland (compare with Fig 1). C. Macrophage infiltration was sparse in the lactating mammary gland as judged by F4/80 IHC. D. A subset of cuboidal luminal epithelial cells was distinctively positive for HIF-2 alpha. E. The percentage of HIF-2 alpha -positive out of total luminal epithelial cells was counted in sections from three mice. Image collected & cropped by CiteAb from the following publication (https://dx.plos.org/10.1371/journal.pone.0125771), licensed under a CC-BY license. Not internally tested by Novus Biologicals. [NB100-132] -")
Immunohistochemistry: HIF-2 alpha/EPAS1 Antibody (ep190b) [NB100-132] -
Immunohistochemistry: HIF-2 alpha/EPAS1 Antibody (ep190b) [NB100-132] - Mainly CK14-positive, but not CK8-positive, mammary epithelial cells are HIF-2 alpha positive at day 14 post weaning.Left panels 20x & right 40x objective. Size bars 50 μm. a, A, b & B. Double IHC for HIF-2 alpha (green) & CK8 (a, A) & CK14 (b, B), respectively (red), reveal that few (if any) CK8-positive luminal cells are HIF-2 alpha positive. Numerous CK14-expressing cells, which include basal & stem/progenitor cells, were positive for HIF-2 alpha. c, C. F4/80 IHC was performed on an adjacent tissue section detect macrophages. Image collected & cropped by CiteAb from the following publication (https://dx.plos.org/10.1371/journal.pone.0125771), licensed under a CC-BY license. Not internally tested by Novus Biologicals. [NB100-132] -")
Immunohistochemistry: HIF-2 alpha/EPAS1 Antibody (ep190b) [NB100-132] -
Immunohistochemistry: HIF-2 alpha/EPAS1 Antibody (ep190b) [NB100-132] - Renal tubule specific models of Vhl deletion.(A) PCR analysis of recombination at the Vhl locus in the kidneys of mice with combinations of Pax8-CreERT2, Slc22a6-CreERT2 & the Vhl floxed (fl) & wild-type (+) alleles. The positions of the bands representing the Vhl floxed, wild type (Wt) & recombined ( delta ) alleles are indicated. (B) Histological images of representative renal sections from 12 month old control, Pax8-CreERT2/Vhl delta / delta & Slc22a6-CreERT2/Vhl delta / delta mice (stains & antibodies as indicated, arrowheads indicate abnormal vascularisation). Scale bars, 100μm. Image collected & cropped by CiteAb from the following publication (https://pubmed.ncbi.nlm.nih.gov/26866916), licensed under a CC-BY license. Not internally tested by Novus Biologicals. [NB100-132] -")
Immunohistochemistry-Paraffin: HIF-2 alpha/EPAS1 Antibody (ep190b) [NB100-132] -
Immunohistochemistry-Paraffin: HIF-2 alpha/EPAS1 Antibody (ep190b) [NB100-132] - HIF1 alpha & H3K9me2 accumulation & 5-hydroxy-methyl-2’-deoxycytidine (5hmdC) depletion in PGL specimens compared to controls.Normal ganglia 1 (NG1), normal ganglia 2 (NG2) & IDH-mutant (IDH). Sporadic PGL (Spo. PGL). A. HIF1 alpha staining. B. HIF2 alpha staining. C. H3K9me2 staining. Arrows indicate H3K9me2 staining in nuclei of neurons or chief cells. D. 5hmdC staining. Arrows indicate 5hmdC staining in the nuclei of neurons & chief cells. Image collected & cropped by CiteAb from the following publication (https://dx.plos.org/10.1371/journal.pone.0127471), licensed under a CC-BY license. Not internally tested by Novus Biologicals. [NB100-132] -")
Immunohistochemistry: HIF-2 alpha/EPAS1 Antibody (ep190b) [NB100-132] -
Immunohistochemistry: HIF-2 alpha/EPAS1 Antibody (ep190b) [NB100-132] - Localization of HIF2A immunoreactivity in limbs.HIF-2A reactivity was detected in control limbs at 1 & 3 h in the apical ectodermal ridge, interdigital area (I.R.) & developing cartilaginous anlagen (Digits). 4-OOHCPA exposure increased HIF2A immunoreactivity in the apical ectodermal ridge & interdigital regions (I.R.) at 3 h. No differences were observed between control & drug-treated limbs after 6 h or 24 h of culture. Four separate replicates were done. Image collected & cropped by CiteAb from the following publication (https://dx.plos.org/10.1371/journal.pone.0051937), licensed under a CC-BY license. Not internally tested by Novus Biologicals. [NB100-132] -")
Western Blot: HIF-2 alpha/EPAS1 Antibody (ep190b) [NB100-132] -
Western Blot: HIF-2 alpha/EPAS1 Antibody (ep190b) [NB100-132] - Hypoxic repression of ER-alpha is dependent on HIF-1 alpha. a Representative western blots of HIF-1 alpha, HIF-2 alpha & beta -actin protein in ten ER-positive cell lines grown at normoxia or hypoxia (1% O2, 24 h). b qPCR analysis of HIF1A mRNA levels in MCF7, BT474, T47D & ZR75B transfected with shScramble or shHIF1A. Relative HIF1A mRNA levels normalized to TBP. (Change in HIF1A levels: *p < 0.0001 MCF7, *p = 0.012 BT474, *p < 0.0001 T47D, *p = 0.0046 ZR75B). c Representative western blots of HIF-1 alpha, ER-alpha & beta -actin protein from MCF7, BT474, T47D & ZR75B with either shScramble or shHIF1A at normoxia & hypoxia (1% O2, 24 h). beta -actin is used as a loading control. d Representative western blot of HIF-1 alpha, ER-alpha & beta -actin protein from MCF7, BT474, T47D & ZR75B with or without the transfection of stabilized HIF-1 alpha (HIF-1 alpha ODD) Image collected & cropped by CiteAb from the following publication (https://pubmed.ncbi.nlm.nih.gov/28320353), licensed under a CC-BY license. Not internally tested by Novus Biologicals. [NB100-132] -")
Immunohistochemistry: HIF-2 alpha/EPAS1 Antibody (ep190b) [NB100-132] -
Immunohistochemistry: HIF-2 alpha/EPAS1 Antibody (ep190b) [NB100-132] - HIF-1 alpha & HIF-2 alpha expression in the virgin mammary gland.A. Virgin mammary glands (30 & 70 days old) showed no conspicuous basal membrane, as visualised by collagen IV IHC (a, b). There was also no detectable expression of HIF-2 alpha in the epithelial cells (c, d). Macrophages (F4/80 positive) were few. In panel c, a single HIF-2 alpha -positive cell was detected, & the adjacent F4/80 IHC section (e) suggested that this cell is a macrophage. B. Expression of HIF-1 alpha in mammary epithelium in the 70-day-old virgin mouse. Top panel, orientation slide with haematoxylin (HTX) staining, 20x obj. *lymph node. Panels b, d, f. Cross-section of a developing duct close to the invading tip at a stage where the lumen is not yet evacuated, 40x obj. Panels c, e, g. Cross-section of a less mature part of a duct, 40x obj. CK14-expressing cells (marker of basal mammary epithelial cells) can be seen in more than one cell layer (panels b & c, arrow-head). At this stage, the lumen is evacuated, but there is still more than one layer of epithelial cells. HIF-1 alpha IHC on the adjacent sections (panels d, e) showing nuclear expression in non-basal epithelial cells (highlighted by red arrows). Basal (CK14 positive) epithelial cells did not express HIF-1 alpha (black arrows). Mammary epithelial expression of HIF-2 alpha was not detected at these developmental stages. Size bars: 50 μm. Image collected & cropped by CiteAb from the following publication (https://dx.plos.org/10.1371/journal.pone.0125771), licensed under a CC-BY license. Not internally tested by Novus Biologicals. [NB100-132] -")
Western Blot: HIF-2 alpha/EPAS1 Antibody (ep190b) [NB100-132] -
Western Blot: HIF-2 alpha/EPAS1 Antibody (ep190b) [NB100-132] - HIF2 alpha inhibitor 76 suppressed CoCl2-induced immature phenotypic characteristics of BCSCs(A) The inhibitory effect of small molecule HIF2 alpha inhibitor 76 for 24h (10 μM for 4T1 cells; 25 μM for Hs578T cells) on CoCl2-induced expression of HIF2 alpha was assessed in both 4T1 & Hs578T cells by western blot analysis. (B) HIF2 alpha inhibitor 76 inhibited primary (with HIF2 alpha inhibitor 76 daily treatment) & second sphere formation (without additional HIF2 alpha inhibitor 76 treatment) in both 4T1 & Hs578T cells. The sizes of spheres greater than 100 μm were enumerated, with a representative image of a tumor-sphere shown. The data represents an average of three independent experiments. (C) Treatment of 4T1 & Hs578T cells with HIF2 alpha inhibitor 76 for 24 h led to a decrease in the percentage of CD44+/CD24−-positive cells as a proportion of total cancer cells. (D) 4T1 & Hs578T cells treated with CoCl2 (100 μM) for 24h & HIF2 alpha inhibitor 76 for 24h (10 μM for 4T1 cells; 25 μM for Hs578T cells) either alone or together were evaluated for the expression levels of stem cell markers c-Myc, Klf4, Oct4, & Nanog by Real-time PCR. Abbreviations: TSFE, Tumor sphere-forming efficiency. beta -actin was used as the internal control. The results represent the mean ± SD from three independent experiments. Image collected & cropped by CiteAb from the following publication (https://www.oncotarget.com/lookup/doi/10.18632/oncotarget.9846), licensed under a CC-BY license. Not internally tested by Novus Biologicals. [NB100-132] -")
Western Blot: HIF-2 alpha/EPAS1 Antibody (ep190b) [NB100-132] -
Western Blot: HIF-2 alpha/EPAS1 Antibody (ep190b) [NB100-132] - Phd2 deletion leads to activation of the Akt–mTOR pathway. a RPPA analysis of tumors with homozygous deletion of Phd2. Tumor tissues from Tyr::CreER; BRafV600E; Phd2−/− or Tyr::CreER; BRafV600E mice were processed & analyzed by RPPA assays. The analyses identified proteins that were significantly changed in mouse melanomas compared to nevi. b Activation of Akt–mTOR pathway after phd2 deletion. Tumor tissues were processed & western blots showed stabilization of HIF-1 alpha & HIF-2 alpha proteins after Phd2 depletion. Increased phosphorylation of Akt, 4EBP1 & S6K was observed in tumors from Tyr::CreER; BRafV600E; Phd2−/− compared with those of Tyr::CreER; BRafV600E mice. c Re-expression of Phd2 inhibits the Akt–mTOR pathway. A BRafV600E; Phd2−/− mouse melanoma cell line was established from melanomas in Tyr::CreER; BRafCA; Phd2lox/lox mice. Phd2 was ectopically reintroduced in these tumor cells. Western blot analysis showed that degradation of HIF-1 alpha & HIF-2 alpha proteins with decreased expression of VEGFR2 decreased phosphorylation of Akt, 4EBP1 & S6K. d Pharmacological inhibition (FM19G11) of HIF pathway in BRafV600E; Phd2−/− melanoma cells. A similar but more pronounced inhibition of the Akt–mTOR pathway was observed using the HIF inhibitor. beta -Actin was used as a loading control. Results are representative of three independent experiments Image collected & cropped by CiteAb from the following publication (https://pubmed.ncbi.nlm.nih.gov/30575721), licensed under a CC-BY license. Not internally tested by Novus Biologicals. [NB100-132] -")
Western Blot: HIF-2 alpha/EPAS1 Antibody (ep190b) [NB100-132] -
Western Blot: HIF-2 alpha/EPAS1 Antibody (ep190b) [NB100-132] - BAY 87-2243 inhibits hypoxia-inducible factor (HIF-1 alpha ) & HIF-2 alpha protein accumulation in hypoxic H460 cells H460 under hypoxia but has no effect on HIF-1 alpha protein levels induced by hypoxia mimetics & has no effect on prolyl hydroxylase 2 (PHD2) activity. (A, B) H460 cells were cultured for 16 h under normoxia or hypoxia (1% pO2) in the absence or presence of various concentrations of BAY 87-2243. HIF-1 alpha (A) & HIF-2 alpha (B) protein levels were assessed by Western Blot in whole cell extracts. beta -actin was used as a loading control. (C) H460 cells were cultured for 16 h under normoxia with the PHDs desferrioxamine (DFO) & CoCl2 plus/minus BAY 87-2243 before the HIF1 alpha protein levels in cellular extracts were quantified by Western Blot. beta -actin was used to as a loading control. (D) Effect of BAY 87-2243 on the recombinant PHD2-mediated hydroxylation of HIF-1 alpha peptide over time was measured in a biochemical assay. Hydoxylated peptide was quantified after incubation with purified VBC complex labeled with europium using fluorescence as a readout. The known PHD inhibitor N-oxalylglycine served as a positive control. Image collected & cropped by CiteAb from the following publication (https://pubmed.ncbi.nlm.nih.gov/24403227), licensed under a CC-BY license. Not internally tested by Novus Biologicals. [NB100-132] -")
Western Blot: HIF-2 alpha/EPAS1 Antibody (ep190b) [NB100-132] -
Western Blot: HIF-2 alpha/EPAS1 Antibody (ep190b) [NB100-132] - Cytosol-restricted Acss2 is enzymatically active.(A) Acetylation of ectopic HA-tagged HIF-2 alpha detected by immunoblotting (IB) with anti-HA or anti- acetylated lysine antibodies following immunoprecipitation (IP) with anti-HA antibody in stably transformed HT1080 cells with knockdown of endogenous Acss2 & rescue with ectopic wild-type (WT) or cytosol-restricted mutant (CYT) Acss2 without or with an SV40 nuclear localization signal fused to the amino terminus. Studies were performed under hypoxia, low glucose, or acetate exposure for the indicated periods. (B) Acetate-dependent lipid synthesis measured by 14C-acetate incorporation in HT1080 stably-transformed cells producing control or Acss2 shRNA downstream of a luciferase cDNA cassette & expressing ectopic control, WT, CYT, SV40-WT, or SV40-CYT Acss2. Cells were incubated under (A) control, (B) hypoxic, or (C) low glucose conditions for 48 hr with labeling performed during the last 24 hr. Comparison of samples within a given condition was made by one-way ANOVA followed by Dunnett’s multiple comparisons test using control shRNA knockdown/control rescue as reference with decreased samples noted (*, P<0.05). All values are means with SD. Image collected & cropped by CiteAb from the following publication (https://dx.plos.org/10.1371/journal.pone.0190241), licensed under a CC0-1.0 license. Not internally tested by Novus Biologicals. [NB100-132] -")
Western Blot: HIF-2 alpha/EPAS1 Antibody (ep190b) [NB100-132] -
Western Blot: HIF-2 alpha/EPAS1 Antibody (ep190b) [NB100-132] - In vitro effects of diclofenac on proliferation & MYC expression in the human melanoma cell line MelIm.The human melanoma cell line MelIm was incubated with different concentrations of diclofenac (A), aspirin (ASA, B), & NS-398 (C), respectively, & proliferation was determined after 24 h. Results represent the mean +/− standard deviation of 12 (diclofenac) & 3 (ASA, NS-398) independent experiments, respectively. (D) MelIm were incubated for 24 h with or without diclofenac. Apoptotic cells were stained with Annexin-V-FITC/ 7-AAD & analyzed by flow cytometry. Results represent the mean +/− standard deviation of 3 independent experiments. (E-G) MYC, STAT3, HIF1a & HIF2a protein expression were determined in cell lysates of MelIm incubated for 2 or 24 h with or without diclofenac (E,F) or ASA (G). The effect of diclofenac on MYC promoter activity was determined by transient transfection of a 2632-bp MYC promoter fragment (H). MelIm were transfected in 6-well-plates & diclofenac was added after 5 h. Luciferase activity was determined 24 h after transfection. Results represent the mean +/− standard deviation of 3 independent experiments. Image collected & cropped by CiteAb from the following publication (https://dx.plos.org/10.1371/journal.pone.0066987), licensed under a CC-BY license. Not internally tested by Novus Biologicals. [NB100-132] -")
Western Blot: HIF-2 alpha/EPAS1 Antibody (ep190b) [NB100-132] -
Western Blot: HIF-2 alpha/EPAS1 Antibody (ep190b) [NB100-132] - Phd2 deletion leads to activation of the Akt–mTOR pathway. a RPPA analysis of tumors with homozygous deletion of Phd2. Tumor tissues from Tyr::CreER; BRafV600E; Phd2−/− or Tyr::CreER; BRafV600E mice were processed & analyzed by RPPA assays. The analyses identified proteins that were significantly changed in mouse melanomas compared to nevi. b Activation of Akt–mTOR pathway after phd2 deletion. Tumor tissues were processed & western blots showed stabilization of HIF-1 alpha & HIF-2 alpha proteins after Phd2 depletion. Increased phosphorylation of Akt, 4EBP1 & S6K was observed in tumors from Tyr::CreER; BRafV600E; Phd2−/− compared with those of Tyr::CreER; BRafV600E mice. c Re-expression of Phd2 inhibits the Akt–mTOR pathway. A BRafV600E; Phd2−/− mouse melanoma cell line was established from melanomas in Tyr::CreER; BRafCA; Phd2lox/lox mice. Phd2 was ectopically reintroduced in these tumor cells. Western blot analysis showed that degradation of HIF-1 alpha & HIF-2 alpha proteins with decreased expression of VEGFR2 decreased phosphorylation of Akt, 4EBP1 & S6K. d Pharmacological inhibition (FM19G11) of HIF pathway in BRafV600E; Phd2−/− melanoma cells. A similar but more pronounced inhibition of the Akt–mTOR pathway was observed using the HIF inhibitor. beta -Actin was used as a loading control. Results are representative of three independent experiments Image collected & cropped by CiteAb from the following publication (https://pubmed.ncbi.nlm.nih.gov/30575721), licensed under a CC-BY license. Not internally tested by Novus Biologicals. [NB100-132] -")
Western Blot: HIF-2 alpha/EPAS1 Antibody (ep190b) [NB100-132] -
Western Blot: HIF-2 alpha/EPAS1 Antibody (ep190b) [NB100-132] - Phd2 deletion leads to activation of the Akt–mTOR pathway. a RPPA analysis of tumors with homozygous deletion of Phd2. Tumor tissues from Tyr::CreER; BRafV600E; Phd2−/− or Tyr::CreER; BRafV600E mice were processed & analyzed by RPPA assays. The analyses identified proteins that were significantly changed in mouse melanomas compared to nevi. b Activation of Akt–mTOR pathway after phd2 deletion. Tumor tissues were processed & western blots showed stabilization of HIF-1 alpha & HIF-2 alpha proteins after Phd2 depletion. Increased phosphorylation of Akt, 4EBP1 & S6K was observed in tumors from Tyr::CreER; BRafV600E; Phd2−/− compared with those of Tyr::CreER; BRafV600E mice. c Re-expression of Phd2 inhibits the Akt–mTOR pathway. A BRafV600E; Phd2−/− mouse melanoma cell line was established from melanomas in Tyr::CreER; BRafCA; Phd2lox/lox mice. Phd2 was ectopically reintroduced in these tumor cells. Western blot analysis showed that degradation of HIF-1 alpha & HIF-2 alpha proteins with decreased expression of VEGFR2 decreased phosphorylation of Akt, 4EBP1 & S6K. d Pharmacological inhibition (FM19G11) of HIF pathway in BRafV600E; Phd2−/− melanoma cells. A similar but more pronounced inhibition of the Akt–mTOR pathway was observed using the HIF inhibitor. beta -Actin was used as a loading control. Results are representative of three independent experiments Image collected & cropped by CiteAb from the following publication (https://pubmed.ncbi.nlm.nih.gov/30575721), licensed under a CC-BY license. Not internally tested by Novus Biologicals. [NB100-132] -")
Immunohistochemistry: HIF-2 alpha/EPAS1 Antibody (ep190b) [NB100-132] -
Immunohistochemistry: HIF-2 alpha/EPAS1 Antibody (ep190b) [NB100-132] - In-vivo lentiviral delivery of Cre-recombinase to renal tubular epithelium results in recombination of target genes.(a) Diagram of pCCIE lentiviral construct. Cre, Cre-recombinase; IRES, internal ribosome entry site; GFP, Green fluorescent protein. (b) Anti-VHL, HIF1a & GAPDH immunoblots of renal cortical protein lysates from Vhlwt/wt & Vhlfl/fl mice intrarenally injected with CCIE. Samples were collected 12 months post infection with each column representing an individual mouse. Blots were cropped to improve clarity, full-length blots are presented in Supplementary Fig. S3a. (c) Histological images of renal sections from Vhlwt/wt & Vhlfl/fl mice intrarenally injected with CCIE at 12 months post injection (stains & antibodies as indicated). Scale bars, 100 μm. Image collected & cropped by CiteAb from the following publication (https://pubmed.ncbi.nlm.nih.gov/26046460), licensed under a CC-BY license. Not internally tested by Novus Biologicals. [NB100-132] -")
Immunohistochemistry-Paraffin: HIF-2 alpha/EPAS1 Antibody (ep190b) [NB100-132] -
Immunohistochemistry-Paraffin: HIF-2 alpha/EPAS1 Antibody (ep190b) [NB100-132] - HIF-1 alpha & HIF-2 alpha expression in the virgin mammary gland.A. Virgin mammary glands (30 & 70 days old) showed no conspicuous basal membrane, as visualised by collagen IV IHC (a, b). There was also no detectable expression of HIF-2 alpha in the epithelial cells (c, d). Macrophages (F4/80 positive) were few. In panel c, a single HIF-2 alpha -positive cell was detected, & the adjacent F4/80 IHC section (e) suggested that this cell is a macrophage. B. Expression of HIF-1 alpha in mammary epithelium in the 70-day-old virgin mouse. Top panel, orientation slide with haematoxylin (HTX) staining, 20x obj. *lymph node. Panels b, d, f. Cross-section of a developing duct close to the invading tip at a stage where the lumen is not yet evacuated, 40x obj. Panels c, e, g. Cross-section of a less mature part of a duct, 40x obj. CK14-expressing cells (marker of basal mammary epithelial cells) can be seen in more than one cell layer (panels b & c, arrow-head). At this stage, the lumen is evacuated, but there is still more than one layer of epithelial cells. HIF-1 alpha IHC on the adjacent sections (panels d, e) showing nuclear expression in non-basal epithelial cells (highlighted by red arrows). Basal (CK14 positive) epithelial cells did not express HIF-1 alpha (black arrows). Mammary epithelial expression of HIF-2 alpha was not detected at these developmental stages. Size bars: 50 μm. Image collected & cropped by CiteAb from the following publication (https://dx.plos.org/10.1371/journal.pone.0125771), licensed under a CC-BY license. Not internally tested by Novus Biologicals. [NB100-132] -")
Immunocytochemistry/ Immunofluorescence: HIF-2 alpha/EPAS1 Antibody (ep190b) [NB100-132] -
Hypoxia inducible factor (HIF)‐2 alpha is expressed in trunk neural crest cells. A,C, Immunostaining of HIF‐2 alpha in sections from trunk axial level of wild‐type chick embryos at HH11, A, HH13, B, and HH18, C. Arrow denotes ventrally migrating HIF‐2 alpha positive cells. D, Co‐immunostaining of HIF‐2 alpha and HNK1 (marker of migrating neural crest) in sections from trunk axial level of wild‐type HH18 chick embryos. Arrows denote migrating cells double positive for the two proteins. E, Sections of HH13 wild‐type embryo immunostained with DAPI for visualization of nuclei and secondary antibody only (donkey anti‐rabbit Alexa Fluor‐546). F, Western blot analysis for detection of HIF‐2 alpha protein at 21% and 1% O2 following siRNA mediated knockdown of HIF‐1 alpha or HIF‐2 alpha. DIP treated cells were used as a positive control and SDHA as loading control. Lanes between 21% and 1% siCTRL were removed from this figure, indicated by the black line. G, Immunohistochemical staining for HIF‐2 alpha in sections of SK‐N‐BE(2)c neuroblastoma cells cultured at 21% or 1% O2. H, Schematic of where oxygen measurements were performed. I, Oxygen saturation in the trunk of chick embryos during development measured ex ovo using microsensor technique. Error bars represent SEM, n ≥ 3 biologically independent replicates for each time point Image collected and cropped by CiteAb from the following open publication (https://pubmed.ncbi.nlm.nih.gov/32940375), licensed under a CC-BY license. Not internally tested by Novus Biologicals. [NB100-132] -")
Immunocytochemistry/ Immunofluorescence: HIF-2 alpha/EPAS1 Antibody (ep190b) [NB100-132] -
Hypoxia inducible factor (HIF)‐2 alpha affects proliferation and self‐renewal capacity. A‐D, Embryo sections from trunk axial level. Proliferating EdU+ cells are green and electroporated cells (morpholinos, A; pCI‐CTRL and pCI‐EPAS1, C) are red. DAPI counterstains nuclei. Only construct targeted neural crest cells (above and outside of dotted line) were quantified (n = 82 [5′‐mispair morpholino] and n = 303 [EPAS1 morpholino], B); n = 211 (pCI‐CTRL) and n = 139 (pCI‐EPAS1), D. Statistical significance calculated using one‐way analysis of variance (ANOVA). E, Relative mRNA expression of EPAS1 in crestosphere cells established from cranial or trunk axial level measured by qRT‐PCR. Expression is presented as mean of n = 4 (cranial) or n = 3 (trunk) biological replicates and error bars represent SEM. Statistical significance calculated using two‐sided student's t test. F,G, Primary sphere assay of crestospheres established from embryos previously electroporated in ovo with non‐ (CTRL) or EPAS1 (EPAS1.1, F, EPAS1.2, G, targeting gRNAs. One cell/well, n = 10 wells/group). Number of spheres were manually counted after 1 week. Statistical significance was calculated by one‐way ANOVA. H, Size of spheres formed in, G. Manual measurements using the ImageJ software to convert to factual unit (μm). Statistical significance was determined by one‐way ANOVA. Inserted photographs of representative spheres from each group Image collected and cropped by CiteAb from the following open publication (https://pubmed.ncbi.nlm.nih.gov/32940375), licensed under a CC-BY license. Not internally tested by Novus Biologicals. [NB100-132] -")
Immunocytochemistry/ Immunofluorescence: HIF-2 alpha/EPAS1 Antibody (ep190b) [NB100-132] -
Hypoxia inducible factor (HIF)‐2 alpha is expressed in trunk neural crest cells. A,C, Immunostaining of HIF‐2 alpha in sections from trunk axial level of wild‐type chick embryos at HH11, A, HH13, B, and HH18, C. Arrow denotes ventrally migrating HIF‐2 alpha positive cells. D, Co‐immunostaining of HIF‐2 alpha and HNK1 (marker of migrating neural crest) in sections from trunk axial level of wild‐type HH18 chick embryos. Arrows denote migrating cells double positive for the two proteins. E, Sections of HH13 wild‐type embryo immunostained with DAPI for visualization of nuclei and secondary antibody only (donkey anti‐rabbit Alexa Fluor‐546). F, Western blot analysis for detection of HIF‐2 alpha protein at 21% and 1% O2 following siRNA mediated knockdown of HIF‐1 alpha or HIF‐2 alpha. DIP treated cells were used as a positive control and SDHA as loading control. Lanes between 21% and 1% siCTRL were removed from this figure, indicated by the black line. G, Immunohistochemical staining for HIF‐2 alpha in sections of SK‐N‐BE(2)c neuroblastoma cells cultured at 21% or 1% O2. H, Schematic of where oxygen measurements were performed. I, Oxygen saturation in the trunk of chick embryos during development measured ex ovo using microsensor technique. Error bars represent SEM, n ≥ 3 biologically independent replicates for each time point Image collected and cropped by CiteAb from the following open publication (https://pubmed.ncbi.nlm.nih.gov/32940375), licensed under a CC-BY license. Not internally tested by Novus Biologicals.Applications for HIF-2 alpha/EPAS1 Antibody (ep190b)
Application
Recommended Usage
ELISA
1:100-1:2000
Flow Cytometry
1:400
Gel Super Shift Assays
reported in scientific literature (PMID 17404621)
Immunohistochemistry
1:150 - 1:300
Immunohistochemistry-Frozen
reported in scientific literature (PMID 24973414)
Immunohistochemistry-Paraffin
1:150 - 1:300
In vivo assay
reported in scientific literature (PMID 23857308)
Knockdown Validated
reported in scientific literature (PMID 32054096)
Simple Western
1:100
Western Blot
1 - 2 ug/mL
Application Notes
In WB, it recognizes a band at approx. 118 kDa representing HIF-2 alpha.
In Simple Western only 10 - 15 uL of the recommended dilution is used per data point.
See Simple Western Antibody Database for Simple Western validation: Tested in Hypoxic HeLa lysate 0.5 mg/mL, separated by Size, antibody dilution of 1:100, apparent MW was 137 kDa. Separated by Size-Wes, Sally Sue/Peggy Sue.
The observed molecular weight of the protein may vary from the listed predicted molecular weight due to post translational modifications, post translation cleavages, relative charges, and other experimental factors.
Reviewed Applications
Read 9 reviews rated 4.4 using NB100-132 in the following applications:
Flow Cytometry Panel Builder
Bio-Techne Knows Flow Cytometry
Save time and reduce costly mistakes by quickly finding compatible reagents using the Panel Builder Tool.
Advanced Features
- Spectra Viewer - Custom analysis of spectra from multiple fluorochromes
- Spillover Popups - Visualize the spectra of individual fluorochromes
- Antigen Density Selector - Match fluorochrome brightness with antigen density

Formulation, Preparation, and Storage
Purification
Protein G purified
Formulation
PBS, 1% BSA
Preservative
0.05% Sodium Azide
Concentration
1.0 mg/ml
Shipping
The product is shipped with polar packs. Upon receipt, store it immediately at the temperature recommended below.
Stability & Storage
Aliquot and store at -20C or -80C. Avoid freeze-thaw cycles.
Background: HIF-2 alpha/EPAS1
HIF-1 or hypoxia inducible factor 1, is a transcription factor commonly referred to as a "master regulator of the hypoxic response" for its central role in the regulation of cellular adaptations to hypoxia. Similarly, HIF-2 alpha plays a role in cellular responses to hypoxia, but whereas HIF-1 alpha is ubiquitously expressed, HIF-2 alpha is predominantly expressed in the vascular endothelium at embryonic stages and after birth in select cells and tissue types (e.g., fibroblasts, hepatocytes and myocytes at 96kDa) (4). Following a similar mechanism to HIF-1 alpha, HIF-2 alpha is stabilized under hypoxic conditions by the formation of a heterodimer with an ARNT/HIF-1 beta subunit. Stable HIF-2 alpha-ARNT/HIF-1 beta heterodimers engage p300/CBP in the nucleus for binding to hypoxic response elements (HREs), inducing transcription, and thus regulation of genes (e.g., EPO, VEGFA). HIF-1 predominantly transactivates genes involved in glycolytic control and pro- apoptotic genes (e.g., LDHA and BNIP3), and HIF-2 regulates the expression of genes involved in invasion and stemness (e.g., MMP2, and OCT4). Common gene targets for HIF-1 and HIF-2 include VEGFA and GLUT1 (5).
The HIF-2 alpha subunit is rapidly targeted and degraded by the ubiquitin proteasome system under normoxic conditions. This process is mediated by oxygen-sensing enzymes, prolyl hydroxylase domain enzymes (PHDs), which catalyze the hydroxylation of key proline residues (Pro-405 and Pro-531) within the oxygen-dependent degradation domain of HIF-2 alpha (5). Once hydroxylated, HIF-2 alpha binds the von Hippel-Lindau tumor suppressor protein (pVHL) for subsequent ubiquitination and proteasomal degradation (5,6).
References
1. Semenza, G. L., Agani, F., Feldser, D., Iyer, N., Kotch, L., Laughner, E., & Yu, A. (2000). Hypoxia, HIF-1, and the pathophysiology of common human diseases. Advances in Experimental Medicine and Biology.
2.Muz, B., de la Puente, P., Azab, F., & Azab, A. K. (2015). The role of hypoxia in cancer progression, angiogenesis, metastasis, and resistance to therapy. Hypoxia. https://doi.org/10.2147/hp.s93413
3. Huang, Y., Lin, D., & Taniguchi, C. M. (2017). Hypoxia inducible factor (HIF) in the tumor microenvironment: friend or foe? Science China Life Sciences. https://doi.org/10.1007/s11427-017-9178-y
4. Hu, C.-J., Wang, L.-Y., Chodosh, L. A., Keith, B., & Simon, M. C. (2003). Differential Roles of Hypoxia-Inducible Factor 1 (HIF-1) and HIF-2 in Hypoxic Gene Regulation. Molecular and Cellular Biology. https://doi.org/10.1128/mcb.23.24.9361-9374.2003
5. Koh, M. Y., & Powis, G. (2012). Passing the baton: The HIF switch. Trends in Biochemical Sciences. https://doi.org/10.1016/j.tibs.2012.06.004
6. Koyasu, S., Kobayashi, M., Goto, Y., Hiraoka, M., & Harada, H. (2018). Regulatory mechanisms of hypoxia-inducible factor 1 activity: Two decades of knowledge. Cancer Science. https://doi.org/10.1111/cas.13483
Long Name
Hypoxia-inducible Transcription Factor 2 alpha
Alternate Names
EPAS1, HIF 2A, HIF2 alpha, HIF2A, HLF, MOP2, ep190b
Gene Symbol
EPAS1
UniProt
Additional HIF-2 alpha/EPAS1 Products
Product Documents for HIF-2 alpha/EPAS1 Antibody (ep190b)
Certificate of Analysis
To download a Certificate of Analysis, please enter a lot or batch number in the search box below.
Product Specific Notices for HIF-2 alpha/EPAS1 Antibody (ep190b)
This product is for research use only and is not approved for use in humans or in clinical diagnosis. Primary Antibodies are guaranteed for 1 year from date of receipt.
Citations for HIF-2 alpha/EPAS1 Antibody (ep190b)
 Powered by Bioz
Customer Reviews for HIF-2 alpha/EPAS1 Antibody (ep190b) (9)
4.4 out of 5
9 Customer Ratings
Have you used HIF-2 alpha/EPAS1 Antibody (ep190b)?
Submit a review and receive an Amazon gift card!
$25/€18/£15/$25CAN/¥2500 Yen for a review with an image
$10/€7/£6/$10CAN/¥1110 Yen for a review without an image
Submit a review
Customer Images
-(0025-ml)_NB100-132_9266.jpg)
-(01-ml)_NB100-132_9071.png)
Showing
1
-
5 of
9 reviews
Showing All
Filter By:
-
Application: Western BlotSample Tested: Endothelial and Whole cell lysateSpecies: MouseVerified Customer | Posted 06/05/2020Mouse aortic endothelial cells treated (1%) or not (20.9%) in hypoxia for 3 hrs. Cells where also transfected with a specific siRNA against (siHIF-2) or a control siRNA (-)

-
Application: ImmunofluorescenceSample Tested: Human endometriumSpecies: HumanVerified Customer | Posted 02/05/2016Human endometrium-Hif2a
-
Application: Western BlotSample Tested: EndothelialSpecies: MouseVerified Customer | Posted 07/24/2015
-
Application: ImmunocytochemistrySample Tested: mmSpecies: MouseVerified Customer | Posted 02/04/2015
-
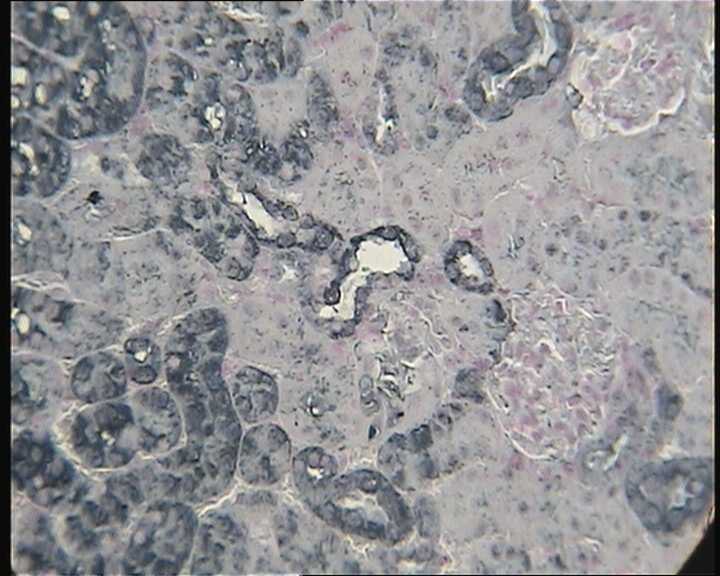
Application: ImmunocytochemistrySample Tested:Species: MouseVerified Customer | Posted 02/04/2015HIF2alpha staining on paraffin-embedded kidney sections
-
Application: Western BlotSample Tested: See PMID 23549086Species: HumanVerified Customer | Posted 12/12/2014
-
Application: Western BlotSample Tested:Species: HumanVerified Customer | Posted 08/11/2014HCT116 colon cancer cells incubated at 20% and 5% O2
-
Application: Western BlotSample Tested: Mouse Kidney Tissue C57B5Species: MouseVerified Customer | Posted 07/28/2014C57B6 5 week old Mouse Kidney Tissue 60ug
-
Application: Western BlotSample Tested: HumanSpecies: HumanVerified Customer | Posted 12/14/2011
There are no reviews that match your criteria.
Protocols
View specific protocols for HIF-2 alpha/EPAS1 Antibody (ep190b) (NB100-132):
Western Blot Protocol
1. Perform SDS-PAGE on samples to be analyzed, loading 10-25 ug of total protein per lane.
2. Transfer proteins to PVDF membrane according to the instructions provided by the manufacturer of the membrane and transfer apparatus.
3. Stain the membrane with Ponceau S (or similar product) to assess transfer success, and mark molecular weight standards where appropriate.
4. Rinse the blot TBS -0.05% Tween 20 (TBST).
5. Block the membrane in 5% Non-fat milk in TBST (blocking buffer) for at least 1 hour.
6. Wash the membrane in TBST three times for 10 minutes each.
7. Dilute primary antibody in blocking buffer and incubate overnight at 4C with gentle rocking.
8. Wash the membrane in TBST three times for 10 minutes each.
9. Incubate the membrane in diluted HRP conjugated secondary antibody in blocking buffer (as per manufacturer's instructions) for 1 hour at room temperature.
10. Wash the blot in TBST three times for 10 minutes each (this step can be repeated as required to reduce background).
11. Apply the detection reagent of choice in accordance with the manufacturer's instructions.
Find general support by application which include: protocols, troubleshooting, illustrated assays, videos and webinars.
- 7-Amino Actinomycin D (7-AAD) Cell Viability Flow Cytometry Protocol
- Antigen Retrieval Protocol (PIER)
- Antigen Retrieval for Frozen Sections Protocol
- Appropriate Fixation of IHC/ICC Samples
- Cellular Response to Hypoxia Protocols
- ChIP Protocol Video
- Chromatin Immunoprecipitation (ChIP) Protocol
- Chromatin Immunoprecipitation Protocol
- Chromogenic IHC Staining of Formalin-Fixed Paraffin-Embedded (FFPE) Tissue Protocol
- Chromogenic Immunohistochemistry Staining of Frozen Tissue
- ClariTSA™ Fluorophore Kits
- Detection & Visualization of Antibody Binding
- ELISA Sample Preparation & Collection Guide
- ELISA Troubleshooting Guide
- Extracellular Membrane Flow Cytometry Protocol
- Flow Cytometry Protocol for Cell Surface Markers
- Flow Cytometry Protocol for Staining Membrane Associated Proteins
- Flow Cytometry Staining Protocols
- Flow Cytometry Troubleshooting Guide
- Fluorescent IHC Staining of Frozen Tissue Protocol
- Graphic Protocol for Heat-induced Epitope Retrieval
- Graphic Protocol for the Preparation and Fluorescent IHC Staining of Frozen Tissue Sections
- Graphic Protocol for the Preparation and Fluorescent IHC Staining of Paraffin-embedded Tissue Sections
- Graphic Protocol for the Preparation of Gelatin-coated Slides for Histological Tissue Sections
- How to Run an R&D Systems DuoSet ELISA
- How to Run an R&D Systems Quantikine ELISA
- How to Run an R&D Systems Quantikine™ QuicKit™ ELISA
- ICC Cell Smear Protocol for Suspension Cells
- ICC Immunocytochemistry Protocol Videos
- ICC for Adherent Cells
- IHC Sample Preparation (Frozen sections vs Paraffin)
- Immunocytochemistry (ICC) Protocol
- Immunocytochemistry Troubleshooting
- Immunofluorescence of Organoids Embedded in Cultrex Basement Membrane Extract
- Immunofluorescent IHC Staining of Formalin-Fixed Paraffin-Embedded (FFPE) Tissue Protocol
- Immunohistochemistry (IHC) and Immunocytochemistry (ICC) Protocols
- Immunohistochemistry Frozen Troubleshooting
- Immunohistochemistry Paraffin Troubleshooting
- Immunoprecipitation Protocol
- Intracellular Flow Cytometry Protocol Using Alcohol (Methanol)
- Intracellular Flow Cytometry Protocol Using Detergents
- Intracellular Nuclear Staining Flow Cytometry Protocol Using Detergents
- Intracellular Staining Flow Cytometry Protocol Using Alcohol Permeabilization
- Intracellular Staining Flow Cytometry Protocol Using Detergents to Permeabilize Cells
- Preparing Samples for IHC/ICC Experiments
- Preventing Non-Specific Staining (Non-Specific Binding)
- Primary Antibody Selection & Optimization
- Propidium Iodide Cell Viability Flow Cytometry Protocol
- Protocol for Heat-Induced Epitope Retrieval (HIER)
- Protocol for Liperfluo
- Protocol for Making a 4% Formaldehyde Solution in PBS
- Protocol for VisUCyte™ HRP Polymer Detection Reagent
- Protocol for the Characterization of Human Th22 Cells
- Protocol for the Characterization of Human Th9 Cells
- Protocol for the Fluorescent ICC Staining of Cell Smears - Graphic
- Protocol for the Fluorescent ICC Staining of Cultured Cells on Coverslips - Graphic
- Protocol for the Preparation & Fixation of Cells on Coverslips
- Protocol for the Preparation and Chromogenic IHC Staining of Frozen Tissue Sections
- Protocol for the Preparation and Chromogenic IHC Staining of Frozen Tissue Sections - Graphic
- Protocol for the Preparation and Chromogenic IHC Staining of Paraffin-embedded Tissue Sections
- Protocol for the Preparation and Chromogenic IHC Staining of Paraffin-embedded Tissue Sections - Graphic
- Protocol for the Preparation and Fluorescent ICC Staining of Cells on Coverslips
- Protocol for the Preparation and Fluorescent ICC Staining of Non-adherent Cells
- Protocol for the Preparation and Fluorescent ICC Staining of Stem Cells on Coverslips
- Protocol for the Preparation and Fluorescent IHC Staining of Frozen Tissue Sections
- Protocol for the Preparation and Fluorescent IHC Staining of Paraffin-embedded Tissue Sections
- Protocol for the Preparation of Gelatin-coated Slides for Histological Tissue Sections
- Protocol for the Preparation of a Cell Smear for Non-adherent Cell ICC - Graphic
- Protocol: Annexin V and PI Staining by Flow Cytometry
- Protocol: Annexin V and PI Staining for Apoptosis by Flow Cytometry
- Quantikine HS ELISA Kit Assay Principle, Alkaline Phosphatase
- Quantikine HS ELISA Kit Principle, Streptavidin-HRP Polymer
- R&D Systems Quality Control Western Blot Protocol
- Sandwich ELISA (Colorimetric) – Biotin/Streptavidin Detection Protocol
- Sandwich ELISA (Colorimetric) – Direct Detection Protocol
- TUNEL and Active Caspase-3 Detection by IHC/ICC Protocol
- The Importance of IHC/ICC Controls
- Troubleshooting Guide: ELISA
- Troubleshooting Guide: Fluorokine Flow Cytometry Kits
- Troubleshooting Guide: Immunohistochemistry
- Troubleshooting Guide: Western Blot Figures
- Western Blot Conditions
- Western Blot Protocol
- Western Blot Protocol for Cell Lysates
- Western Blot Troubleshooting
- Western Blot Troubleshooting Guide
- View all Protocols, Troubleshooting, Illustrated assays and Webinars
FAQs for HIF-2 alpha/EPAS1 Antibody (ep190b)
Showing
1
-
2 of
2 FAQs
Showing All
-
Q: Do you have a specific protocol for using NB100-132 for western blot and a recipe for preparing cell lysates to test this antibody?
A: Please find the specific protocol for NB100-132 here. This HIF antibody will require the standard hypoxic cell treatment.
-
Q: I tried the antibody. By western blot on mouse T cells, I obtained a major non-specific band at 70KDa and a very weak band at 100KDa. Do you know what the 70KDa protein could be? However, I did this experiment on total cell lysates and I would like to redo this on nuclear extracts.
A: We have also encountered a band at 70kDa in our testing on whole cell lysates. In our experience, this band usually does not respond to hypoxic induction, is only present in whole cell and cytoplasmic fractions, and is seen in almost all HIF1 alpha products that we have tested. We currently do not know the identity of this band, but we think it could be a HIF1 alpha degradation product.
-
Q: Do you have a specific protocol for using NB100-132 for western blot and a recipe for preparing cell lysates to test this antibody?
A: Please find the specific protocol for NB100-132 here. This HIF antibody will require the standard hypoxic cell treatment.
-
Q: I tried the antibody. By western blot on mouse T cells, I obtained a major non-specific band at 70KDa and a very weak band at 100KDa. Do you know what the 70KDa protein could be? However, I did this experiment on total cell lysates and I would like to redo this on nuclear extracts.
A: We have also encountered a band at 70kDa in our testing on whole cell lysates. In our experience, this band usually does not respond to hypoxic induction, is only present in whole cell and cytoplasmic fractions, and is seen in almost all HIF1 alpha products that we have tested. We currently do not know the identity of this band, but we think it could be a HIF1 alpha degradation product.
Loading...
Associated Pathways

