Human IL-1 beta/IL-1F2 Antibody (2805)
R&D Systems | Catalog # MAB601

Key Product Details
Validated by
Species Reactivity
Validated:
Cited:
Applications
Validated:
Cited:
Label
Antibody Source
Product Specifications
Immunogen
Specificity
Clonality
Host
Isotype
Endotoxin Level
Scientific Data Images for Human IL-1 beta/IL-1F2 Antibody (2805)
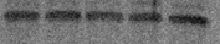
Detection of Human IL‑1 beta /IL‑1F2 by Western Blot.
Western blot shows lysates of THP-1 human acute monocytic leukemia cell line untreated (-) or treated (+) with 200 nM PMA for 24 hours and 10 µg/mL LPS and 3 hours. PVDF membrane was probed with 1 µg/mL of Mouse Anti-Human IL-1 beta /IL-1F2 Monoclonal Antibody (Catalog # MAB601) followed by HRP-conjugated Anti-Mouse IgG Secondary Antibody (Catalog # HAF018). A specific band was detected for IL-1 beta /IL-1F2 at approximately 36 kDa (as indicated). This experiment was conducted under reducing conditions and using Immunoblot Buffer Group 1.
Detection of IL‑1 beta /IL‑1F2 in THP‑1 Human Cell Line.
IL‑1 beta /IL‑1F2 was detected in immersion fixed THP‑1 human acute monocytic leukemia cell line using Mouse Anti-Human IL‑1 beta /IL‑1F2 Monoclonal Antibody (Catalog # MAB601) at 25 µg/ml for 3 hours at room temperature. Cells were stained using the NorthernLights™ 557-conjugated Anti-Mouse IgG Secondary Antibody (red; Catalog # NL007) and counterstained with DAPI (blue). Specific staining was localized to the cytoplasm of THP-1 cells treated with 200nM PMA for 24 hours then 10ug/mL LPS for 24 hours. View our protocol for Fluorescent ICC Staining of Cells on Coverslips.
IL‑1 beta /IL‑1F2 in Human PBMCs.
IL-1 beta /IL-1F2 was detected in immersion fixed human peripheral blood mononuclear cells (PBMCs) using Mouse Anti-Human IL-1 beta /IL-1F2 Monoclonal Antibody (Catalog # MAB601) at 8 µg/mL for 3 hours at room temperature. Cells were stained using the NorthernLights™ 557-conjugated Anti-Mouse IgG Secondary Antibody (red; Catalog # NL007) and counterstained with DAPI (blue). Specific staining was localized to cytoplasm. View our protocol for Fluorescent ICC Staining of Non-adherent Cells.
Detection of Human IL‑1 beta /IL‑1F2 by Simple WesternTM.
Simple Western lane view shows lysates of THP‑1 human acute monocytic leukemia cell line untreated (-) or treated (+) with 200 nm PMA and 10 ug/ml LPS for 24 hrs and 3 hrs, respectively, and loaded at 0.2 mg/mL. A specific band was detected for IL‑1 beta /IL‑1F2 at approximately 38 kDa (as indicated) using 10 µg/mL of Mouse Anti-Human IL‑1 beta /IL‑1F2 Monoclonal Antibody (Catalog # MAB601). This experiment was conducted under reducing conditions and using the 12-230 kDa separation system.
Cell Proliferation Induced by IL‑1 beta /IL‑1F2 and Neutralization by Human IL‑1 beta /IL‑1F2 Antibody.
Recombinant Human IL-1 beta /IL-1F2 (Catalog # 201-LB) stimulates proliferation in the the D10.G4.1 mouse helper T cell line in a dose-dependent manner (orange line). Proliferation elicited by Recombinant Human IL-1 beta /IL-1F2 (0.05 ng/mL) is neutralized (green line) by increasing concentrations of Mouse Anti-Human IL-1 beta /IL-1F2 Monoclonal Antibody (Catalog # MAB601). The ND50 is typically 0.05-0.2 µg/mL.
Detection of Human IL-1 beta/IL-1F2 by ELISA
Effect of A1AT on whole blood IL-1 beta release. IL-1 beta production in whole blood cultures in response to LPS (1.0 μg/ml) was performed in the presence of endogenous A1AT (i.e., undiluted) or exogenously added A1AT (2 mg/ml) in blood diluted 1:32 with RPMI. Whole blood cultures were incubated for 18 h. After incubation, plasma supernatants were removed, and IL-1 beta quantified by ELISA and expressed as mean ± SD for three donors. The diluted sample result was corrected for the dilution. NS indicates no significant difference. Image collected and cropped by CiteAb from the following publication (https://dx.plos.org/10.1371/journal.pone.0117330), licensed under a CC-BY license. Not internally tested by R&D Systems.
Detection of Mouse IL-1 beta/IL-1F2 by Immunohistochemistry
Inflammatory response induced by HI injury and maternal SE. Representative images of immunofluorescence staining of inflammatory cytokines IL-1 beta, IL-6, and TNF alpha in the cerebral cortex (A) and the hippocampus (E). The immunofluorescence intensity of IL-1 beta (B,F), IL-6 (C,G), and TNF alpha (D,H) in the cerebral cortex and hippocampus. Results are presented as mean ± SEM. *P < 0.05, **P < 0.01, n = 4, analyzed by two-way ANOVA followed by post hoc Turkey tests. SH, from sham exposed dams with sham surgery; HI, hypoxic-ischemic injury; SE, from smoke exposed dams with sham surgery; HI + SE, from smoke exposed dams with hypoxic-ischemic injury. Image collected and cropped by CiteAb from the following publication (https://pubmed.ncbi.nlm.nih.gov/35250486), licensed under a CC-BY license. Not internally tested by R&D Systems.
Detection of Human IL-1 beta/IL-1F2 by Western Blot
Effect of high glucose and IL-1 beta alone or in combination on the protein expressions of CD31, FSP1 and alpha -SMA in HAECs. a–d HAECs were incubated for 48 h with NG and HG. Mannitol was used as a control for hyperosmolarity. Representative western blots (a) and quantitative determinations of CD31, FSP1 and alpha -SMA protein levels (b–d) are presented. e–h HAECs were treated for 48 h with NG, HG, IL-1 beta (10 ng/ml)and HG in the presence of the IL-1 beta (10 ng/ml). Representative western blots (E) and quantitative determinations of CD31, FSP1 and alpha -SMA protein levels (f–h) are presented. The data are expressed as the mean ± SD. Experiments were repeated at least three times. NG normal glucose (5.5 mM), HG high glucose (30 mM), MN 5.5 mM glucose + 24.5 mM mannitol, IL-1 beta (10 ng/ml), HG + IL-1 beta : high glucose (30 mM) + IL-1 beta (10 ng/ml) *P < 0.05 vs. MN or NG, **P < 0.01 vs. NG, #P < 0.05 vs. HG Image collected and cropped by CiteAb from the following publication (https://www.cardiab.com/content/15/1/42), licensed under a CC-BY license. Not internally tested by R&D Systems.
Detection of Human IL-1 beta/IL-1F2 by Immunocytochemistry/Immunofluorescence
The influence of high glucose or IL-1 beta on immunofluorescence of CD31 and FSP1 in HAECs. Representative immunofluorescence images showing CD31 (green), FSP1 (red) labeling and DAPI (blue) stains nuclei. a Normal ECs monolayers displayed a cobble stone morphology. b A merge of the three images revealed some cells populations that acquired a spindle-shaped morphology and lost CD31 expression (white arrow). c HAECs exposure to IL-1 beta alone for 48 h acquired a spindle-shaped morphology. d High glucose and IL-1 beta in combination resulted in decreased CD31 (the left white arrow) and increased FSP1staining (the right arrow). a normal glucose (5.5 mM) group, b high glucose (30 mM) group for 48 h; c treatment with a normal glucose (5.5 mM) + IL-1 beta (10 ng/ml) treatment for 48 h, d treatment with a high glucose (30 mM) + IL-1 beta (10 ng/ml) treatment for 48 h. Scale bar, 75 μm Image collected and cropped by CiteAb from the following publication (https://www.cardiab.com/content/15/1/42), licensed under a CC-BY license. Not internally tested by R&D Systems.
Detection of Human IL-1 beta/IL-1F2 by Western Blot
Effects of PKC beta on high glucose induced IL-1 beta up-regulation. Confluent cultures of HAECs were exposed to NG, HG, PMA (30 nM) and HG in the presence of the selective PKC beta inhibitors (LY317615, 0.3 μM) for 48 h. Real-time PCR analyses showed mRNA expression of PKC beta and IL-1 beta (a, b). Representative western blots (c) and quantitative determinations of PKC beta and IL-1 beta (d, e) are presented. The data are expressed as the mean ± SD. Experiments were repeated at least three times. NG normal glucose (5.5 mM), HG high glucose (30 mM), PMA (30 nM): phorbol 12-myristate13-acetate; LY (0.3 uM): LY317615; *P < 0.05 vs.NG, **P < 0.01 vs. NG, #P < 0.05 vs. HG or PMA Image collected and cropped by CiteAb from the following publication (https://www.cardiab.com/content/15/1/42), licensed under a CC-BY license. Not internally tested by R&D Systems.
Detection of Mouse IL-1 beta/IL-1F2 by Immunohistochemistry
Inflammatory response induced by HI injury and maternal SE. Representative images of immunofluorescence staining of inflammatory cytokines IL-1 beta, IL-6, and TNF alpha in the cerebral cortex (A) and the hippocampus (E). The immunofluorescence intensity of IL-1 beta (B,F), IL-6 (C,G), and TNF alpha (D,H) in the cerebral cortex and hippocampus. Results are presented as mean ± SEM. *P < 0.05, **P < 0.01, n = 4, analyzed by two-way ANOVA followed by post hoc Turkey tests. SH, from sham exposed dams with sham surgery; HI, hypoxic-ischemic injury; SE, from smoke exposed dams with sham surgery; HI + SE, from smoke exposed dams with hypoxic-ischemic injury. Image collected and cropped by CiteAb from the following publication (https://pubmed.ncbi.nlm.nih.gov/35250486), licensed under a CC-BY license. Not internally tested by R&D Systems.
Detection of Human IL-1 beta/IL-1F2 by Immunocytochemistry/Immunofluorescence
The influence of high glucose or IL-1 beta on immunofluorescence of CD31 and FSP1 in HAECs. Representative immunofluorescence images showing CD31 (green), FSP1 (red) labeling and DAPI (blue) stains nuclei. a Normal ECs monolayers displayed a cobble stone morphology. b A merge of the three images revealed some cells populations that acquired a spindle-shaped morphology and lost CD31 expression (white arrow). c HAECs exposure to IL-1 beta alone for 48 h acquired a spindle-shaped morphology. d High glucose and IL-1 beta in combination resulted in decreased CD31 (the left white arrow) and increased FSP1staining (the right arrow). a normal glucose (5.5 mM) group, b high glucose (30 mM) group for 48 h; c treatment with a normal glucose (5.5 mM) + IL-1 beta (10 ng/ml) treatment for 48 h, d treatment with a high glucose (30 mM) + IL-1 beta (10 ng/ml) treatment for 48 h. Scale bar, 75 μm Image collected and cropped by CiteAb from the following publication (https://www.cardiab.com/content/15/1/42), licensed under a CC-BY license. Not internally tested by R&D Systems.
Detection of Human IL-1 beta/IL-1F2 by Western Blot
The influence of blocking IL-1 beta treatment on the protein expressions of CD31, FSP1, a-SMA, and IL-1 beta. (a–f) HAECs were incubated for 48 h with anti-IL-1 beta antibodies (1000 ng/ml) in the presence of NG or HG. (a1–f1) We performed gene-silencing experiments using transfection with siRNA specific for IL-1 beta. The protein expressions of IL-1 beta, CD31, FSP1 and alpha -SMA were assessed by western blotting. The data are expressed as the mean ± SD. Experiments were repeated at least three times. NG normal glucose (5.5 mM), HG high glucose (30 mM). Anti-IL-1 beta : anti-IL-1 beta antibodies (1000 ng/ml). *P < 0.05 vs. NG or anti-IL-1 beta, #P < 0.05 vs. HG or HG +Vehicle Image collected and cropped by CiteAb from the following publication (https://www.cardiab.com/content/15/1/42), licensed under a CC-BY license. Not internally tested by R&D Systems.
Detection of Human IL-1 beta /IL-1F2 by Western Blot
Knockdown of IRE1 alpha reduces LPS-induced cytokine production.THP-1 cells transfected with either noncoding (NC) or IRE1 alpha targeting siRNA were treated with either 1 μg/ml LPS alone for 24 h or 1 μg/ml LPS for 24 h followed by addition of 10 μM nigericin (NG) for 45 min. a Cell lysates were analysed via immunoblotting for IRE1 alpha, phospho-p65, total p65, NLRP3, pro-caspase-1 and pro-IL-1 beta. Actin was used as a loading control. b Cell conditioned medium was analysed via immunoblotting for pro-IL-1 beta processing. c–f Levels of IL-1 beta, IL-8, TNF-alpha, and IL-6 were assayed in cell conditioned medium by ELISA (n = 3). *P < 0.05, **P < 0.01, and ***P < 0.001 based on a Student’s t test. Error bars represent SD Image collected and cropped by CiteAb from the following open publication (https://pubmed.ncbi.nlm.nih.gov/31417078), licensed under a CC-BY license. Not internally tested by R&D Systems.
Detection of IL-1 beta /IL-1F2 by Immunohistochemistry
Oral live L. plantarum GKD7 reduced levels of TNF-alpha and IL-1 beta expression in OA synovium. (A) IHC staining of IL-1 beta and TNF-alpha in representative synovium from controls, ACLT-only rats, and ACLT + L. plantarum GKD7 rats. Quantitative analyses of (B) IL-1 beta and (C) TNF-alpha in synovium. Scale bar = 100 µm. * p < 0.05 vs. controls; # p < 0.05 vs. the ACLT-only group. Image collected and cropped by CiteAb from the following open publication (https://pubmed.ncbi.nlm.nih.gov/35956346), licensed under a CC-BY license. Not internally tested by R&D Systems.
Detection of IL-1 beta /IL-1F2 by Immunohistochemistry
Oral live L. plantarum GKD7 reduced key proinflammatory cytokines in OA cartilage. (A) IHC staining of IL-1 beta and TNF-alpha expression in representative cartilage from controls, ACLT-only rats, and ACLT + L. plantarum GKD7 rats. Quantitative analyses of (B) IL-1 beta and (C) TNF-alpha in cartilage. Scale bar = 100 µm. * p < 0.05 vs. controls; # p < 0.05 vs. the ACLT-only group. Image collected and cropped by CiteAb from the following open publication (https://pubmed.ncbi.nlm.nih.gov/35956346), licensed under a CC-BY license. Not internally tested by R&D Systems.
Human IL-1 beta / IL-1F2 ELISA Standard Curve
Recombinant Human IL‑1 beta /IL‑1F2 (Catalog # 201-LB) was serially diluted and captured by Mouse Anti-Human IL‑1 beta /IL‑1F2 Monoclonal Antibody (Catalog # MAB601) coated on a Clear Polystyrene Microplate (Catalog # DY990). Goat Anti-Human IL‑1 beta /IL‑1F2 Antigen Affinity-purified Polyclonal Antibody (Catalog # AF-201-NA) was biotinylated and incubated with the protein captured on the plate. Detection of the standard curve was achieved by incubating Streptavidin-HRP (Catalog # DY998)Applications for Human IL-1 beta/IL-1F2 Antibody (2805)
Immunocytochemistry
Sample: Immersion fixed human peripheral blood mononuclear cells and THP-1 human acute monocytic leukemia cell line untreated and treated with PMA and LPS
Simple Western
Sample: TF‑1 human erythroleukemic cell line
Western Blot
Sample: THP‑1 human acute monocytic leukemia cell line treated with PMA and LPS
Neutralization
Human IL-1 beta /IL-1F2 Sandwich Immunoassay
Reviewed Applications
Read 5 reviews rated 4 using MAB601 in the following applications:
Formulation, Preparation, and Storage
Purification
Reconstitution
Reconstitute at 0.5 mg/mL in sterile PBS. For liquid material, refer to CoA for concentration.
Formulation
*Small pack size (-SP) is supplied either lyophilized or as a 0.2 µm filtered solution in PBS.
Shipping
Stability & Storage
- 12 months from date of receipt, -20 to -70 °C as supplied.
- 1 month, 2 to 8 °C under sterile conditions after reconstitution.
- 6 months, -20 to -70 °C under sterile conditions after reconstitution.
Calculators
Background: IL-1 beta/IL-1F2
Long Name
Alternate Names
Entrez Gene IDs
Gene Symbol
Additional IL-1 beta/IL-1F2 Products
Product Documents for Human IL-1 beta/IL-1F2 Antibody (2805)
Certificate of Analysis
To download a Certificate of Analysis, please enter a lot or batch number in the search box below.
Note: Certificate of Analysis not available for kit components.
Product Specific Notices for Human IL-1 beta/IL-1F2 Antibody (2805)
This product is covered by one or more patents, including US Patent # 5,681,933.
For research use only
Related Research Areas
Citations for Human IL-1 beta/IL-1F2 Antibody (2805)
 Powered by Bioz
Customer Reviews for Human IL-1 beta/IL-1F2 Antibody (2805) (5)
Have you used Human IL-1 beta/IL-1F2 Antibody (2805)?
Submit a review and receive an Amazon gift card!
$25/€18/£15/$25CAN/¥2500 Yen for a review with an image
$10/€7/£6/$10CAN/¥1110 Yen for a review without an image
Submit a review
Customer Images
-
Application: Western BlotSample Tested: microglial cellsSpecies: HumanVerified Customer | Posted 08/12/2021

-
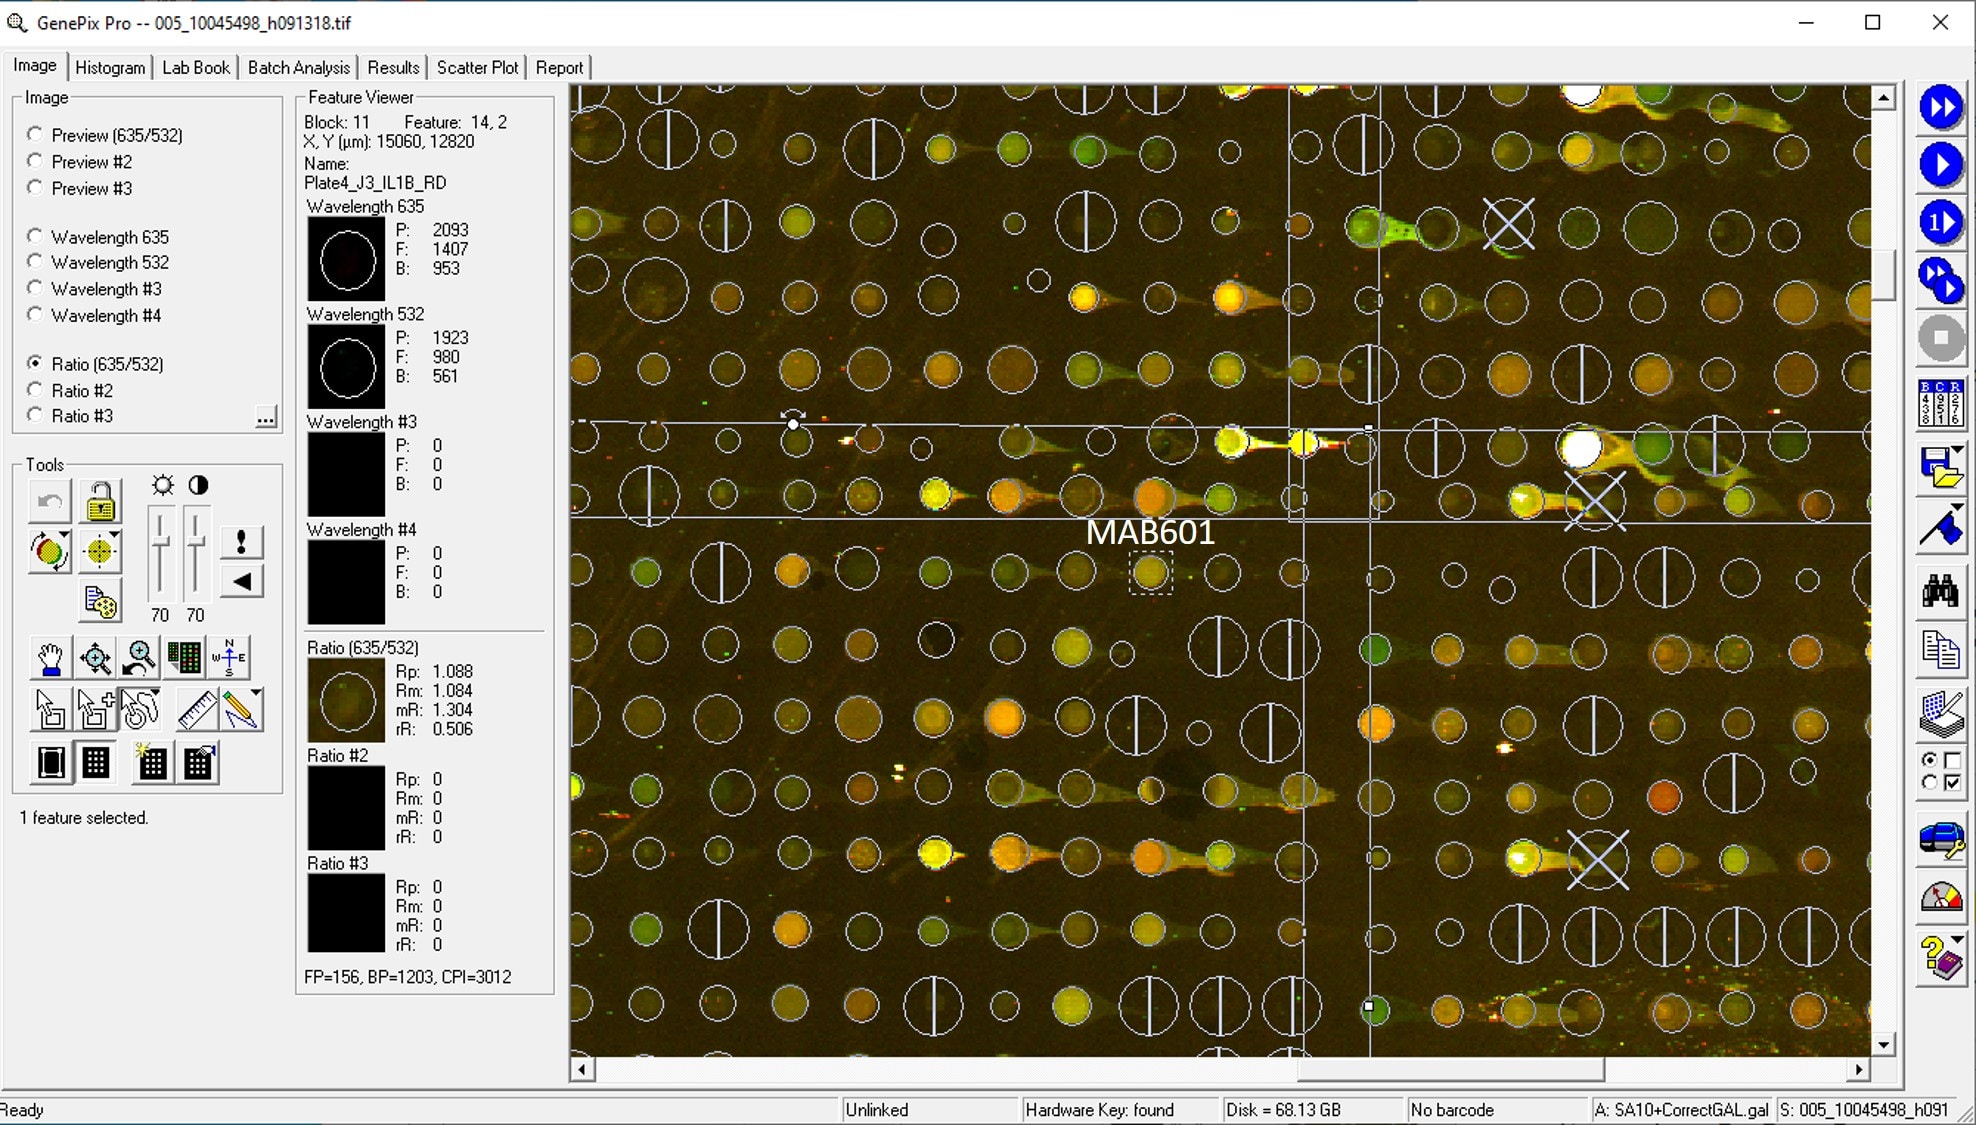
Application: MicroarraysSample Tested: EDTA PlasmaSpecies: HumanVerified Customer | Posted 06/10/2020
-
Application: MicroarraySample Tested: EDTA PlasmaSpecies: HumanVerified Customer | Posted 11/20/2018
-
Application: MicroarraysSample Tested: EDTA PlasmaSpecies: HumanVerified Customer | Posted 11/07/2018
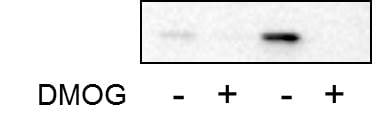
-
Application: Western BlotSample Tested: head and neck squamous cell carcinoma cellsSpecies: HumanVerified Customer | Posted 09/21/2018Human HNSCC cell lines FaDu and HN5 were treated with DMOG for 24 hours and the expression of IL-1beta was detected by western blot.
There are no reviews that match your criteria.
Protocols
Find general support by application which include: protocols, troubleshooting, illustrated assays, videos and webinars.
- Appropriate Fixation of IHC/ICC Samples
- Cellular Response to Hypoxia Protocols
- ClariTSA™ Fluorophore Kits
- Detection & Visualization of Antibody Binding
- ICC Cell Smear Protocol for Suspension Cells
- ICC Immunocytochemistry Protocol Videos
- ICC for Adherent Cells
- Immunocytochemistry (ICC) Protocol
- Immunocytochemistry Troubleshooting
- Immunofluorescence of Organoids Embedded in Cultrex Basement Membrane Extract
- Immunohistochemistry (IHC) and Immunocytochemistry (ICC) Protocols
- Preparing Samples for IHC/ICC Experiments
- Preventing Non-Specific Staining (Non-Specific Binding)
- Primary Antibody Selection & Optimization
- Protocol for VisUCyte™ HRP Polymer Detection Reagent
- Protocol for the Fluorescent ICC Staining of Cell Smears - Graphic
- Protocol for the Fluorescent ICC Staining of Cultured Cells on Coverslips - Graphic
- Protocol for the Preparation and Fluorescent ICC Staining of Cells on Coverslips
- Protocol for the Preparation and Fluorescent ICC Staining of Non-adherent Cells
- Protocol for the Preparation and Fluorescent ICC Staining of Stem Cells on Coverslips
- Protocol for the Preparation of a Cell Smear for Non-adherent Cell ICC - Graphic
- R&D Systems Quality Control Western Blot Protocol
- TUNEL and Active Caspase-3 Detection by IHC/ICC Protocol
- The Importance of IHC/ICC Controls
- Troubleshooting Guide: Western Blot Figures
- Western Blot Conditions
- Western Blot Protocol
- Western Blot Protocol for Cell Lysates
- Western Blot Troubleshooting
- Western Blot Troubleshooting Guide
- View all Protocols, Troubleshooting, Illustrated assays and Webinars
FAQs for Human IL-1 beta/IL-1F2 Antibody (2805)
-
Q: Can pro-IL-1 beta be detected by Catalog #s AF-201-NA and MAB601 ?
A: The amino acid sequence present in mature IL-1 beta (Ala117-Ser269) is also present in pro IL-1 beta. So in theory, both Catalog #s AF-201-NA and MAB601 should detect the pro form of IL-1 beta. The results would depend on whether the pro form is abundantly present in the sample type being evaluated.
Associated Pathways