p62/SQSTM1 Antibody (2C11) - Azide and BSA Free
Novus Biologicals | Catalog # H00008878-M01
![Western Blot: p62/SQSTM1 Antibody (2C11) [H00008878-M01]](https://resources.rndsystems.com/images/products/p62-SQSTM1-Antibody-2C11-Western-Blot-H00008878-M01-img0012.jpg "Western Blot: p62/SQSTM1 Antibody (2C11) [H00008878-M01]")
Loading...
Key Product Details
Validated by
Knockout/Knockdown
Species Reactivity
Validated:
Human, Mouse, Rat, Bovine, Hamster, Rabbit
Cited:
Human, Mouse, Rat, Rabbit
Applications
Validated:
Immunohistochemistry, Immunohistochemistry-Paraffin, Immunohistochemistry-Frozen, Western Blot, ELISA, Immunocytochemistry/ Immunofluorescence, Immunoprecipitation
Cited:
Immunohistochemistry, Immunohistochemistry-Paraffin, Immunohistochemistry-Frozen, Western Blot, Immunoblotting, Immunocytochemistry/ Immunofluorescence, Bioassay, IF/IHC
Label
Unconjugated
Antibody Source
Monoclonal Mouse IgG2a Kappa Clone # 2C11
Format
Azide and BSA Free
Loading...
Product Specifications
Immunogen
SQSTM1 (AAH03139.1, 1 a.a. ~ 440 a.a) full-length recombinant protein with GST tag. MW of the GST tag alone is 26 KDa. MASLTVKAYLLGKEDAAREIRRFSFCCSPEPEAEAEAAAGPGPCERLLSRVAALFPALRPGGFQAHYRDEDGDLVAFSSDEELTMAMSYVKDDIFRIYIKEKKECRRDHRPPCAQEAPRNMVHPNVICDGCNGPVVGTRYKCSVCPDYDLCSVCEGKGLHRGHTKLAFPSPFGHLSEGFSHSRWLRKVKHGHFGWPGWEMGPPGNWSPRPPRAGEARPGPTAESASGPSEDPSVNFLKNVGESVAAALSPLGIEVDIDVEHGGKRSRLTPVSPESSSTEEKSSSQPSSCCSDPSKPGGNVEGATQSLAEQMRKIALESEGRPEEQMESDNCSGGDDDWTHLSSKEVDPSTGELQSLQMPESEGPSSLDPSQEGPTGLKEAALYPHLPPEADPRLIESLSQMLSMGFSDEGGWLTRLLQTKNYDIGAALDTIQYSKHPPPL
Reactivity Notes
Rat reactivity reported in scientific literature (PMID: 24352657). Human reactivity reported in scientific literature (PMID: 26571504). Rabbit reactivity reported in scientific literature (PMID: 23569437). Please note that this antibody is reactive to Mouse and derived from the same host, Mouse. Mouse-On-Mouse blocking reagent may be needed for IHC and ICC experiments to reduce high background signal. You can find these reagents under catalog numbers PK-2200-NB and MP-2400-NB. Please contact Technical Support if you have any questions.
Localization
Cytoplasmic
Clonality
Monoclonal
Host
Mouse
Isotype
IgG2a Kappa
Theoretical MW
47.7 kDa.
Disclaimer note: The observed molecular weight of the protein may vary from the listed predicted molecular weight due to post translational modifications, post translation cleavages, relative charges, and other experimental factors.
Disclaimer note: The observed molecular weight of the protein may vary from the listed predicted molecular weight due to post translational modifications, post translation cleavages, relative charges, and other experimental factors.
Description
Quality control test: Antibody Reactive Against Recombinant Protein.
Scientific Data Images for p62/SQSTM1 Antibody (2C11) - Azide and BSA Free
Western Blot: p62/SQSTM1 Antibody (2C11) [H00008878-M01]
Western Blot: p62/SQSTM1 Antibody (2C11) [H00008878-M01] - WB analysis of recombinant p62 protein (immunogen, 74.51 KDa) using SQSTM1/p62 antibody (clone 2C11).![Western Blot: p62/SQSTM1 Antibody (2C11) [H00008878-M01]](https://resources.rndsystems.com/images/products/p62-SQSTM1-Antibody-2C11-Western-Blot-H00008878-M01-img0005.jpg "Western Blot: p62/SQSTM1 Antibody (2C11) [H00008878-M01]")
Western Blot: p62/SQSTM1 Antibody (2C11) [H00008878-M01]
Western Blot: p62/SQSTM1 Antibody (2C11) [H00008878-M01] - WB analysis of p62 in p62 WT and KO mouse hepatocytes and HepG2 cell lysate using anti-p62/SQSTM1 antibody clone 2C11. Sample lane1: p62 +/- mouse hepatocytes, lane 2: p62 -/- mouse hepatocytes, lane3: Wt mouse hepatocytes, lane 4: HepG2 cells. This image is from a verified customer product review.![Immunocytochemistry/ Immunofluorescence: p62/SQSTM1 Antibody (2C11) [H00008878-M01]](https://resources.rndsystems.com/images/products/p62-SQSTM1-Antibody-2C11-Immunocytochemistry-Immunofluorescence-H00008878-M01-img0008.jpg "Immunocytochemistry/ Immunofluorescence: p62/SQSTM1 Antibody (2C11) [H00008878-M01]")
Immunocytochemistry/ Immunofluorescence: p62/SQSTM1 Antibody (2C11) [H00008878-M01]
Immunocytochemistry/Immunofluorescence: p62/SQSTM1 Antibody (2C11) [H00008878-M01] - ICC-IF analysis of SQSTM1 protein in HeLa cell using SQSTM1/p62 antibody (clone 2C11) at 10 ug/ml concentration.![Immunocytochemistry/ Immunofluorescence: p62/SQSTM1 Antibody (2C11) [H00008878-M01]](https://resources.rndsystems.com/images/products/p62-SQSTM1-Antibody-2C11-Immunocytochemistry-Immunofluorescence-H00008878-M01-img0010.jpg "Immunocytochemistry/ Immunofluorescence: p62/SQSTM1 Antibody (2C11) [H00008878-M01]")
Immunocytochemistry/ Immunofluorescence: p62/SQSTM1 Antibody (2C11) [H00008878-M01]
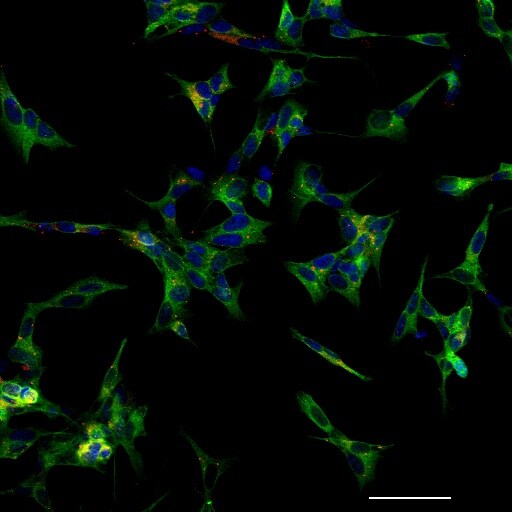
Immunocytochemistry/Immunofluorescence: p62/SQSTM1 Antibody (2C11) [H00008878-M01] - Analysis of p62 in SH-SY5Y cells using anti-p62/SQSTM1 antibody. Red - p62 puncta; Blue - nuclear DAPI; Green - Cytoskeleton. Image from verified customer review.![Western Blot: p62/SQSTM1 Antibody (2C11) [H00008878-M01]](https://resources.rndsystems.com/images/products/p62-SQSTM1-Antibody-2C11-Western-Blot-H00008878-M01-img0014.jpg "Western Blot: p62/SQSTM1 Antibody (2C11) [H00008878-M01]")
Western Blot: p62/SQSTM1 Antibody (2C11) [H00008878-M01]
p62-SQSTM1-Antibody-2C11-Western-Blot-H00008878-M01-img0014.jpg![Immunocytochemistry/ Immunofluorescence: p62/SQSTM1 Antibody (2C11) [H00008878-M01]](https://resources.rndsystems.com/images/products/p62-SQSTM1-Antibody-2C11-Immunocytochemistry-Immunofluorescence-H00008878-M01-img0016.jpg "Immunocytochemistry/ Immunofluorescence: p62/SQSTM1 Antibody (2C11) [H00008878-M01]")
Immunocytochemistry/ Immunofluorescence: p62/SQSTM1 Antibody (2C11) [H00008878-M01]
Immunocytochemistry/Immunofluorescence: p62/SQSTM1 Antibody (2C11) [H00008878-M01] - Analysis of p62/SQSTM1 antibody on HeLa cells. Image from verified customer review.![Western Blot: p62/SQSTM1 Antibody (2C11) [H00008878-M01]](https://resources.rndsystems.com/images/products/p62-SQSTM1-Antibody-2C11-Western-Blot-H00008878-M01-img0015.jpg "Western Blot: p62/SQSTM1 Antibody (2C11) [H00008878-M01]")
Western Blot: p62/SQSTM1 Antibody (2C11) [H00008878-M01]
p62-SQSTM1-Antibody-2C11-Western-Blot-H00008878-M01-img0015.jpg![ELISA: p62/SQSTM1 Antibody (2C11) [H00008878-M01]](https://resources.rndsystems.com/images/products/p62-SQSTM1-Antibody-2C11-ELISA-H00008878-M01-img0013.jpg "ELISA: p62/SQSTM1 Antibody (2C11) [H00008878-M01]")
ELISA: p62/SQSTM1 Antibody (2C11) [H00008878-M01]
ELISA: p62/SQSTM1 Antibody (2C11) [H00008878-M01] - Detection limit for recombinant GST tagged SQSTM1 is approximately 0.03ng/ml as a capture antibody. [H00008878-M01] -")
Western Blot: p62/SQSTM1 Antibody (2C11) [H00008878-M01] -
Western Blot: p62/SQSTM1 Antibody (2C11) [H00008878-M01] - Activation of multiple signaling pathways by dandelion root extractA. Western blots of proteins involved in programmed cell death & cell survival & inflammation B. Densitometry quantification of western blot analysis from three independent experiments. *P<0.05, **P< 0.001. Image collected & cropped by CiteAb from the following publication (https://www.oncotarget.com/lookup/doi/10.18632/oncotarget.11485), licensed under a CC-BY license. Not internally tested by Novus Biologicals. [H00008878-M01] -")
Immunohistochemistry: p62/SQSTM1 Antibody (2C11) [H00008878-M01] -
Immunohistochemistry: p62/SQSTM1 Antibody (2C11) [H00008878-M01] - Elevated levels of additional proteins & GM3 ganglioside in the MEC of MPS IIIB brain.Staining performed with antibodies to the indicated substances was observed in the MEC region of 3 month-old MPS IIIB mice (for total ubiquitin & polyubiquitin) & 6 months for all others. Staining was not seen in the MEC region of age-matched control mice (Naglu +/−) nor in the LEC region of MPS IIIB mice (the latter not shown). Image collected & cropped by CiteAb from the following publication (https://dx.plos.org/10.1371/journal.pone.0027461), licensed under a CC-BY license. Not internally tested by Novus Biologicals. [H00008878-M01] -")
Western Blot: p62/SQSTM1 Antibody (2C11) [H00008878-M01] -
Western Blot: p62/SQSTM1 Antibody (2C11) [H00008878-M01] - Confirmation of loss of hepatic ATG7 protein & a phenotype of hepatic autophagy inactivation. Fourty µg of liver protein were loaded on 4–20% gradient Tris-Glycine gels & subsequently immunoblotted with antibodies against ATG7, p62 & LC3. Blots were visualised with G:BOX Chemi XRQ (SynGene). Representative immunoblots are shown for WT & KO mice. Full-length immunoblots are presented in Supplementary Figure S1. ATG7: autophagy-related protein 7; p62: sequestosome 1; LC3: microtubule-associated protein 1 light chain 3; WT: Mx1-Cre−Atg7F/F mouse; KO: Mx1-Cre+Atg7F/F mouse. Image collected & cropped by CiteAb from the following publication (https://pubmed.ncbi.nlm.nih.gov/29074879), licensed under a CC-BY license. Not internally tested by Novus Biologicals. [H00008878-M01] -")
Western Blot: p62/SQSTM1 Antibody (2C11) [H00008878-M01] -
Western Blot: p62/SQSTM1 Antibody (2C11) [H00008878-M01] - The content of mitochondrial p62, OPTN, & VCP in spinal cord of SOD1‐G93A mice is decreased by Parkin knockoutImmunostaining of anterior horn of lumbar spinal cord for ChAT (in green) & p62 (in red) at 130 days. Scale bar, 10 μm.Quantification of the percentage of ChAT‐positive motor neurons (MN) containing p62‐positive inclusions at 130 days. PKO/G93A MN have less SOD1 aggregates than G93A, while Non Tg & PKO MN have none. Data were collected from n = 4 (two males & two females) mice for Non Tg & PKO & n = 6 (three males & three females) for G93A & PKO/G93A. Number of images recorded for each genotype: n = 9 for Non Tg & PKO, n = 16 for G93A, & n = 12 for PKO/G93A. Results are expressed as mean ± SEM; *P = 0.032, by unpaired one‐tailed Student's t‐test.Representative Western blots of OPTN, p62, & VCP in spinal cord mitochondrial fractions at 130 days. Protein levels are normalized by Complex V. The quantifications in panels (D–F) show that mitochondria of PKO/G93A mice have less mitophagy adaptor proteins than G93A relative to Complex V.Quantification of OPTN relative to Complex V at 130 days. Results are expressed as mean ± SEM & as percent of Non Tg; n = 8 (four males & four females); *P = 0.039 by paired Student's t‐test.Quantification of p62, relative to Complex V at 130 days. Results are expressed as mean ± SEM & as percent of Non Tg; n = 8 (four males & four females); **P = 0.0029 by paired Student's t‐test.VCP was quantified using Complex V as loading reference at 130 days. Results are expressed as mean ± SEM & as percent of Non Tg; n = 8 (four males & four females); *P = 0.044 by paired Student's t‐test.Source data are available online for this figure. Image collected & cropped by CiteAb from the following publication (https://pubmed.ncbi.nlm.nih.gov/30126943), licensed under a CC-BY license. Not internally tested by Novus Biologicals. [H00008878-M01] -")
Western Blot: p62/SQSTM1 Antibody (2C11) [H00008878-M01] -
Western Blot: p62/SQSTM1 Antibody (2C11) [H00008878-M01] - miR-29a downregulates TFEB & ATG9A to inhibit autophagyA. Schematic representation of the miR-29 family members & 3′-UTR binding sites of miR-29 targets as well as mutated binding sites used in Luciferase Assays: Transcription Factor EB (TFEB) & Autophagy-related protein 9A (ATG9A). All three miR-29 family members (miR-29a, miR-29b, & miR-29c) have identical seed sequences. Conserved miR-29 binding sites in the 3′-UTR of mRNA transcripts encoding ATG9A & TFEB are depicted in bold. B. 10ug of total protein cell lysates from Panc-1 transfected with CTRL or miR-29a mimics were subjected to western blot analysis for TFEB, ATG9A, & GAPDH. Relative quantification of band intensities normalized to GAPDH are shown below respective blots. C. Relative firefly luciferase activity from TFEB & ATG9A 3′ UTR wild type (WT) & mutant (mut) reporter constructs following co-transfection into Panc-1 cells with control or miR-29a mimics. All readouts were normalized to renilla luciferase activity for each well. Average relative luminesce normalized to respective controls is presented (n=6) ± S.E.M. D. 5ug of total protein cell lysates from Panc-1 cells were transfected with CTRL, miR-29a mimics, siCTRL, siTFEB, or siATG9A. 24 hours post-transfection, total protein was harvested & subjected to western blot analysis for p62 & LC3B, & GAPDH was used as loading control. Quantification of band intensities normalized to GAPDH & relative to control are shown below respective blots. All experiments were repeated 3 times & representative data is presented. Image collected & cropped by CiteAb from the following publication (https://www.oncotarget.com/lookup/doi/10.18632/oncotarget.11928), licensed under a CC-BY license. Not internally tested by Novus Biologicals. [H00008878-M01] -")
Western Blot: p62/SQSTM1 Antibody (2C11) [H00008878-M01] -
Western Blot: p62/SQSTM1 Antibody (2C11) [H00008878-M01] - Effects of autophagy inhibitors in combination with IFN-gamma on expression of PD-L1 in gastric cancer cell lines. a The effect of chloroquine (CQ) or 3-MA on expression of PD-L1 with or without INF-gamma for 24 h was determined by flow cytometry assays. In AGS & NCI-n87 cells, MFI as the indication of PD-L1 expression level can be further increased by the treatment of INF-gamma. b Levels of LC3B-I/II, p62/SQSTM1 & PD-L1 were determined by Western blots in AGS & NCI-n87 cells treated by CQ, 3-MA, bafilomycin A1 (Baf) or rapamycin (Rap) for 24 h. c Positive staining of PD-L1 (red) & LC3 positive puncta (green) was determined by immunofluorescence in AGS & NCI-n87 cells treated by autophagy inhibitors & activator as in (b). d Rapamycin decreased the levels of PD-L1 protein in AGS & NCI-n87 cells as shown by flow cytometry. Results were averaged & blots were representative of 4 independent experiments, *p < 0.05, **p < 0.01 Image collected & cropped by CiteAb from the following publication (https://pubmed.ncbi.nlm.nih.gov/30925913), licensed under a CC-BY license. Not internally tested by Novus Biologicals. [H00008878-M01] -")
Immunocytochemistry/ Immunofluorescence: p62/SQSTM1 Antibody (2C11) [H00008878-M01] -
Immunocytochemistry/ Immunofluorescence: p62/SQSTM1 Antibody (2C11) [H00008878-M01] - The content of mitochondrial p62, OPTN, & VCP in spinal cord of SOD1‐G93A mice is decreased by Parkin knockoutImmunostaining of anterior horn of lumbar spinal cord for ChAT (in green) & p62 (in red) at 130 days. Scale bar, 10 μm.Quantification of the percentage of ChAT‐positive motor neurons (MN) containing p62‐positive inclusions at 130 days. PKO/G93A MN have less SOD1 aggregates than G93A, while Non Tg & PKO MN have none. Data were collected from n = 4 (two males & two females) mice for Non Tg & PKO & n = 6 (three males & three females) for G93A & PKO/G93A. Number of images recorded for each genotype: n = 9 for Non Tg & PKO, n = 16 for G93A, & n = 12 for PKO/G93A. Results are expressed as mean ± SEM; *P = 0.032, by unpaired one‐tailed Student's t‐test.Representative Western blots of OPTN, p62, & VCP in spinal cord mitochondrial fractions at 130 days. Protein levels are normalized by Complex V. The quantifications in panels (D–F) show that mitochondria of PKO/G93A mice have less mitophagy adaptor proteins than G93A relative to Complex V.Quantification of OPTN relative to Complex V at 130 days. Results are expressed as mean ± SEM & as percent of Non Tg; n = 8 (four males & four females); *P = 0.039 by paired Student's t‐test.Quantification of p62, relative to Complex V at 130 days. Results are expressed as mean ± SEM & as percent of Non Tg; n = 8 (four males & four females); **P = 0.0029 by paired Student's t‐test.VCP was quantified using Complex V as loading reference at 130 days. Results are expressed as mean ± SEM & as percent of Non Tg; n = 8 (four males & four females); *P = 0.044 by paired Student's t‐test.Source data are available online for this figure. Image collected & cropped by CiteAb from the following publication (https://pubmed.ncbi.nlm.nih.gov/30126943), licensed under a CC-BY license. Not internally tested by Novus Biologicals. [H00008878-M01] -")
Western Blot: p62/SQSTM1 Antibody (2C11) [H00008878-M01] -
Western Blot: p62/SQSTM1 Antibody (2C11) [H00008878-M01] - G2019S LRRK2 hippocampal neurons do not have elevated alpha -synuclein pathology 14 days post-transduction. a Primary hippocampal neurons from NTG or G2019S pups were transduced with 2.5 μg/mL alpha -synuclein PFFs & allowed to age a further 14 days prior to sequential detergent fractionation. TX-100-insoluble alpha -synuclein & p62 are similar in both neuron types. b Quantification of soluble proteins shows ~ 25-fold elevation in the expression of LRRK2 & a commensurate ~ 50-fold elevation in pS395 LRRK2, indicative of the elevated LRRK2 kinase activity associated with the G2019S mutation. Soluble alpha -synuclein levels were equivalent between the cultures. c No significant differences were found between the genotypes in insoluble proteins by an unpaired t-test with Welch’s correction. (N = 3 biological replicates for each protein). Means + s.e.m.; **P < 0.01; *P < 0.05 by an unpaired t-test with Welch’s correction for unequal variances. All values are normalized to NTG neurons treated with alpha -synuclein PFFs & DMSO Image collected & cropped by CiteAb from the following publication (https://actaneurocomms.biomedcentral.com/articles/10.1186/s40478-018-05…), licensed under a CC-BY license. Not internally tested by Novus Biologicals. [H00008878-M01] -")
Western Blot: p62/SQSTM1 Antibody (2C11) [H00008878-M01] -
Western Blot: p62/SQSTM1 Antibody (2C11) [H00008878-M01] - LRRK2 inhibition does not reduce insoluble alpha -synuclein in wildtype hippocampal neurons. a Primary hippocampal neurons from CD1 pups were treated with 30 nM LRRK2 inhibitors PF-475, PF-360 or DMSO as a vehicle control, then transduced with 2.5 μg/mL alpha -synuclein PFFs & allowed to age a further 14 days prior to sequential detergent fractionation. TX-100-insoluble alpha -synuclein & p62 are similar in both LRRK2 inhibitor treated & untreated neurons. b Quantification of soluble proteins show some reduction of LRRK2 protein levels PF-475 treatment & ~ 75% inhibition of LRRK2 activity (as assayed by pS935 LRRK2) by both PF-475 & PF-360. c Insoluble pS129 alpha -synuclein was slightly, but significantly elevated by PF-360 treatment, while alpha -synuclein & p62 were unchanged by one-way ANOVA. (N = 5 biological replicates for each protein). Means + s.e.m.; *P < 0.05, ****p < 0.0001 by one-way ANOVA with Dunnett’s multiple comparison test. All values are normalized first to GAPDH, as a loading control, then to DMSO-treated neurons Image collected & cropped by CiteAb from the following publication (https://actaneurocomms.biomedcentral.com/articles/10.1186/s40478-018-05…), licensed under a CC-BY license. Not internally tested by Novus Biologicals. [H00008878-M01] -")
Immunocytochemistry/ Immunofluorescence: p62/SQSTM1 Antibody (2C11) [H00008878-M01] -
Immunocytochemistry/ Immunofluorescence: p62/SQSTM1 Antibody (2C11) [H00008878-M01] - Colocalization of VANGL2 & p62/SQSTM1 in late endosomes.(a) Immunofluorescence staining of SKBR7 cells showed colocalization of endogenous VANGL2 (green) & p62/SQSTM1 (red) in discrete cytoplasmic puncta. Scale bar, 10 μm. The mean Pearson correlation for VANGL2 & p62/SQSTM1 is 0.62, calculated using the Image J software for ∼15 cells per field of view & from 10 images. (b) Partial colocalization of VANGL2 & p62/SQSTM1 in late endosomes of SKBR7 cells stained w/ the LAMP1 marker. Scale bar, 20 μm. (c) SKBR7 ells cultured in a nutrient-deprived medium & treated w/ 100 nM bafilomycin A1 (6 h) before fixation. Double labelling against VANGL2 (arrowheads) & p62/SQSTM1 (arrows), as described in Methods, showed accumulations of both markers in vesicular structures probably resembling endosomes/amphisomes. Scale bar, 200 nm. (d) IMCD3 cells treated w/ PBS or EGTA (5 mM) for 30 min. Immunofluorescence & confocal analysis performed using the indicated antibodies. Scale bar, 10 μm. Inserts show colocalized VANGL2 & p62/SQSTM1. (e) The VANGL2–p62/SQSTM1 complex recovered in confluent SKBR7 or IMCD3 cells w/ 2G4 mAb (IP VANGL2) but not a control antibody (IP IgG2a ctrl) as seen using western blot analysis w/ the indicated antibodies. The complex more abundant in cancer cells (SKBR7) than in polarized cells (IMCD3). Note that human (SKBR7 cells) & murine (IMCD3 cells) p62/SQSTM1 run at different molecular weights. (f) Lysates of confluent IMCD3 cells treated for 30 min w/ PBS or EGTA subjected to 2G4 mAb immunoprecipitation (IP VANGL2). Immunoprecipitated proteins probed by western blot analysis w/ the indicated antibodies. Increased amounts of VANGL2–p62/SQSTM1 complexes recovered after EGTA treatment. Image collected & cropped by CiteAb from the following publication (https://www.nature.com/articles/ncomms10318), licensed under a CC-BY license. Not internally tested by Novus Biologicals. [H00008878-M01] -")
Western Blot: p62/SQSTM1 Antibody (2C11) [H00008878-M01] -
Western Blot: p62/SQSTM1 Antibody (2C11) [H00008878-M01] - Colocalization of VANGL2 & p62/SQSTM1 in late endosomes.(a) Immunofluorescence staining of SKBR7 cells showed colocalization of endogenous VANGL2 (green) & p62/SQSTM1 (red) in discrete cytoplasmic puncta. Scale bar, 10 μm. The mean Pearson correlation for VANGL2 & p62/SQSTM1 is 0.62, calculated using the Image J software for ∼15 cells per field of view & from 10 images. (b) Partial colocalization of VANGL2 & p62/SQSTM1 in late endosomes of SKBR7 cells stained w/ the LAMP1 marker. Scale bar, 20 μm. (c) SKBR7 ells cultured in a nutrient-deprived medium & treated w/ 100 nM bafilomycin A1 (6 h) before fixation. Double labelling against VANGL2 (arrowheads) & p62/SQSTM1 (arrows), as described in Methods, showed accumulations of both markers in vesicular structures probably resembling endosomes/amphisomes. Scale bar, 200 nm. (d) IMCD3 cells treated w/ PBS or EGTA (5 mM) for 30 min. Immunofluorescence & confocal analysis performed using the indicated antibodies. Scale bar, 10 μm. Inserts show colocalized VANGL2 & p62/SQSTM1. (e) The VANGL2–p62/SQSTM1 complex recovered in confluent SKBR7 or IMCD3 cells w/ 2G4 mAb (IP VANGL2) but not a control antibody (IP IgG2a ctrl) as seen using western blot analysis w/ the indicated antibodies. The complex more abundant in cancer cells (SKBR7) than in polarized cells (IMCD3). Note that human (SKBR7 cells) & murine (IMCD3 cells) p62/SQSTM1 run at different molecular weights. (f) Lysates of confluent IMCD3 cells treated for 30 min w/ PBS or EGTA subjected to 2G4 mAb immunoprecipitation (IP VANGL2). Immunoprecipitated proteins probed by western blot analysis w/ the indicated antibodies. Increased amounts of VANGL2–p62/SQSTM1 complexes recovered after EGTA treatment. Image collected & cropped by CiteAb from the following publication (https://www.nature.com/articles/ncomms10318), licensed under a CC-BY license. Not internally tested by Novus Biologicals. [H00008878-M01] -")
Western Blot: p62/SQSTM1 Antibody (2C11) [H00008878-M01] -
Western Blot: p62/SQSTM1 Antibody (2C11) [H00008878-M01] - Parkin protein levels are unaffected in liver while a small decrease is measured in G93A cerebellumRepresentative Western blot for Parkin & p62 in cerebellum (Cb) homogenates at 130 days.Quantification indicates that Parkin is decreased in G93A mice relative to Non Tg at 130 days. Protein levels were normalized by beta ‐actin. Results are expressed as mean ± SEM & percent of Non Tg; n = 8 (four males & four females) mice per group. *P = 0.039 by paired Wilcoxon's test.Quantification of p62 in the homogenates indicates that p62 is increased in PKO & PKO/G93A mice, independent of SOD1‐G93A expression, at 130 days of age. beta ‐actin was used for normalization. Results are expressed as mean ± SEM & percent of Non Tg; n = 8 (four males & four females) mice per group. No statistically significant differences were found between Non Tg & G93A by paired Friedman's test with Dunn's correction (P = 0.99). ***P = 0.0001 by paired Student's t‐test (G93A vs. PKO/G93A).Representative Western blot of Parkin & p62 in liver homogenates at 130 days.Parkin protein levels were quantified at 130 days. beta ‐actin was used for normalization. Results are expressed as mean ± SEM & percent of Non Tg; n = 8 (four males & four females) mice per group. No statistically significant differences were found between Non Tg & G93A (P = 0.546 by paired Wilcoxon's test).Quantification of p62 protein levels in liver at 130 days. Results are expressed as mean ± SEM & percent of Non Tg; n = 8 (four males & four females) mice per group. No statistically significant differences were found between Non Tg & G93A (P = 0.546 by paired Wilcoxon's test). No statistically significant differences were found among the other groups.Source data are available online for this figure. Image collected & cropped by CiteAb from the following publication (https://pubmed.ncbi.nlm.nih.gov/30126943), licensed under a CC-BY license. Not internally tested by Novus Biologicals. [H00008878-M01] -")
Western Blot: p62/SQSTM1 Antibody (2C11) [H00008878-M01] -
Western Blot: p62/SQSTM1 Antibody (2C11) [H00008878-M01] - Parkin knockout mitigates the accumulation of mitophagy adaptors in G93A mitochondria at disease end stageA, BRepresentative Western blots of p62 (A), OPTN, & VCP (B) in spinal cord mitochondria from end‐stage mice.Cp62 quantification, using Complex V as normalizer, shows a strong accumulation of p62 in SOD1‐G93A mitochondria at end stage. Results are expressed as mean ± SEM & as percent of Non Tg; n = 8 (four males & four females) mice per group. No statistically significant differences were found between G93A & PKO/G93A (P = 0.078 by paired Wilcoxon's test); ***P = 0.0007 (Non Tg vs. G93A) & *P = 0.037 (PKO & PKO/G93A) both by paired Friedman's test with Dunn's correction.DQuantification of OPTN accumulation in end‐stage mitochondria, with Complex V as protein loading control. Results are expressed as mean ± SEM & as percent of Non Tg; n = 8 (four males & four females) mice per group. **P = 0.0078 (for G93A & PKO/G93A) by paired Wilcoxon's test; ***P = 0.0003 (Non Tg vs. G93A) by paired Friedman's test with Dunn's correction. No other statistically significant differences were found.EQuantification of VCP in mitochondria at disease end stage. Complex V was used as normalizer. Results are expressed as mean ± SEM & as percent of Non Tg; n = 8 (four males & four females) mice per group. *P = 0.039 (for G93A & PKO/G93A) by paired Wilcoxon's test; ***P = 0.0007 (Non Tg vs. G93A) & *P = 0.037 (PKO & PKO/G93A) both by paired Friedman's test with Dunn's correction.Source data are available online for this figure. Image collected & cropped by CiteAb from the following publication (https://pubmed.ncbi.nlm.nih.gov/30126943), licensed under a CC-BY license. Not internally tested by Novus Biologicals.Applications for p62/SQSTM1 Antibody (2C11) - Azide and BSA Free
Application
Recommended Usage
Immunocytochemistry/ Immunofluorescence
10ug/mL
Immunohistochemistry
1:10-1:500
Immunohistochemistry-Frozen
1:10-1:500
Immunohistochemistry-Paraffin
1:10-1:500
Immunoprecipitation
1:10-1:1000
Western Blot
1:100-1:2000
Application Notes
Use in Immunohistochemistry-paraffin reported in scientific literature (PMID: 23569437).
Reviewed Applications
Read 10 reviews rated 4.2 using H00008878-M01 in the following applications:
Formulation, Preparation, and Storage
Purification
IgG purified
Formulation
In 1x PBS, pH 7.4
Format
Azide and BSA Free
Preservative
No Preservative
Concentration
Concentrations vary lot to lot. See vial label for concentration. If unlisted please contact technical services.
Shipping
The product is shipped with polar packs. Upon receipt, store it immediately at the temperature recommended below.
Stability & Storage
Aliquot and store at -20C or -80C. Avoid freeze-thaw cycles.
Background: p62/SQSTM1
Abnormal function of p62/SQSTM1 is associated with a range of disease states such as neurodegeneration, cancer, and metabolic disorders (2). Mutations in the p62/SQSTM1 sequence have been linked to Paget's disease of the bone, amyotrophic lateral sclerosis, and frontotemporal lobar degeneration. In Parkinson's disease, p62/SQSTM1 has been linked to microglia activation and subsequent neuroinflammation (3). Functionally, p62/SQSTM1 is involved in a broad range of cellular processes such as amino acid sensing by interaction with mTORC1, oxidative stress response through interaction with Keap1, and targeting cargo for autophagy by interacting with ubiquitin labeled proteins (1).
To induce selective autophagy, p62/SQSTM1 forms long oligomers or helical filaments which interact with LC3 and ubiquitin labeled proteins and lead to the initiation of the autophagosome formation (2). p62/SQSTM1 is not only a selective autophagy receptor but also an autophagy substrate, as its engulfed by the autophagosome and degraded by the autophagolysosome. Monitoring LC3 levels is the standard for assessing autophagic flux, however monitoring p62/SQSTM1 levels by Western blot in the presence and absence of autophagy inhibitors (e.g., Chloroquine) is also a common practice (4). Besides its activity as a selective autophagy receptor, p62/SQSTM1 also plays a role as an adaptor in signaling cascades leading to NFkB activation downstream of TNF-R, IL-1 beta R, TrkA and p75NTR. Briefly, for NFkB signaling downstream of the TNF-R activation, p62/SQSTM1 engages RIP1 kinase and PKC iota/lambda through the ZZ and PB1 domains, respectively (5).
References
1.Katsuragi, Y., Ichimura, Y., & Komatsu, M. (2015). P62/SQSTM1 functions as a signaling hub and an autophagy adaptor. FEBS Journal. https://doi.org/10.1111/febs.13540
2. Sanchez-Martin, P., & Komatsu, M. (2018). p62/SQSTM1 - Steering the cell through health and disease. Journal of Cell Science. https://doi.org/10.1242/jcs.222836
3. Yao, L., Zhu, Z., Wu, J., Zhang, Y., Zhang, H., Sun, X.,... Lu, G. (2019). MicroRNA-124 regulates the expression of p62/p38 and promotes autophagy in the inflammatory pathogenesis of Parkinson's disease. The FASEB Journal. https://doi.org/10.1096/fj.201900363r
4 Klionsky, D. J., Abdelmohsen, K., Abe, A., Abedin, M. J., Abeliovich, H., Arozena, A. A.,... Zughaier, S. M. (2016). Guidelines for the use and interpretation of assays for monitoring autophagy (3rd edition). Autophagy. https://doi.org/10.1080/15548627.2015.1100356
5. Bitto, A., Lerner, C. A., Nacarelli, T., Crowe, E., Torres, C., & Sell, C. (2014). p62/SQSTM1 at the interface of aging, autophagy, and disease. Age. https://doi.org/10.1007/s11357-014-9626-3
Long Name
Sequestosome 1
Alternate Names
A170, EBIAP, ORCA, OSIL, PDB3, Sequestosome 1, SQSTM1, ZIP3
Gene Symbol
SQSTM1
UniProt
Additional p62/SQSTM1 Products
Product Documents for p62/SQSTM1 Antibody (2C11) - Azide and BSA Free
Certificate of Analysis
To download a Certificate of Analysis, please enter a lot or batch number in the search box below.
Product Specific Notices for p62/SQSTM1 Antibody (2C11) - Azide and BSA Free
This product is produced by and distributed for Abnova, a company based in Taiwan.
This product is for research use only and is not approved for use in humans or in clinical diagnosis. Primary Antibodies are guaranteed for 1 year from date of receipt.
Related Research Areas
Citations for p62/SQSTM1 Antibody (2C11) - Azide and BSA Free
 Powered by Bioz
Customer Reviews for p62/SQSTM1 Antibody (2C11) - Azide and BSA Free (10)
4.2 out of 5
10 Customer Ratings
Have you used p62/SQSTM1 Antibody (2C11) - Azide and BSA Free?
Submit a review and receive an Amazon gift card!
$25/€18/£15/$25CAN/¥2500 Yen for a review with an image
$10/€7/£6/$10CAN/¥1110 Yen for a review without an image
Submit a review
Customer Images
_H00008878-M01_11606.tif)
-(01-mg)_H00008878-M01_11476.jpg)
-(01-mg)_H00008878-M01_9206.png)
Showing
1
-
5 of
10 reviews
Showing All
Filter By:
-
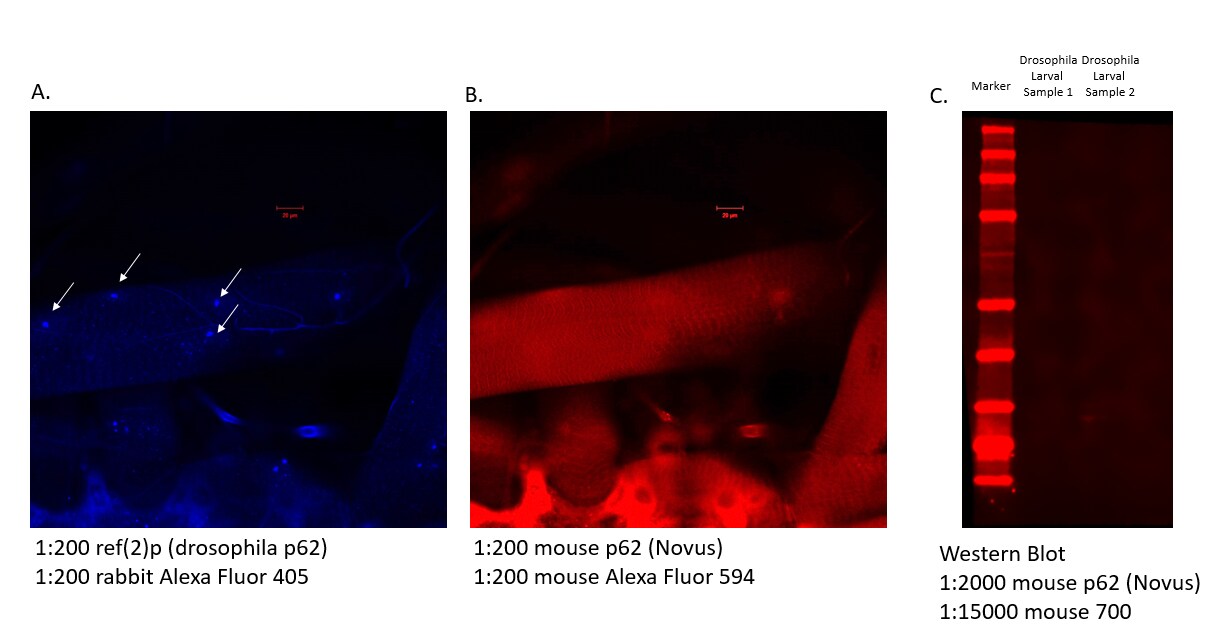
Application: Immunohistochemistry + Western BlotSample Tested: dissected carcass for muscle staining, drosophila larval muscle , whole drosophila larvae and drosophila larvaeSpecies: DrosophilaVerified Customer | Posted 08/21/2023drosophila larval muscle staining with A. a published antibody against drosophila ref(2)P (i.e. p62) and B. Novus antibody against mouse p62. C. Western Blot with the Novus mouse antibody and drosophila whole larval samples.Drosophila muscle staining with the Novus antibody did not match the staining with a published antibody against drosophila ref(2)p (the drosophila equivalent of p62). Western blot with the Novus antibody did not show any bands with drosophila whole larval samples. Immunohistochemistry with fixed drosophila larval tissue Western blot with drosophila whole larval samples
 Bio-Techne ResponseThis review was submitted through the legacy Novus Innovators Program, reflecting a new species or application tested on a primary antibody.
 -
Application: ImmunocytochemistrySample Tested: Hela cell lineSpecies: HumanVerified Customer | Posted 01/24/2022Hela cell line
-
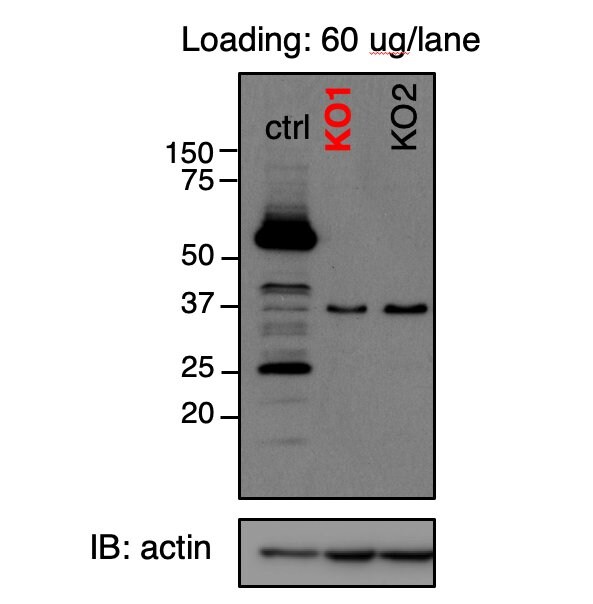
Application: Western BlotSample Tested: HEK293Species: HumanVerified Customer | Posted 08/17/2019HEK293 cells screening for p62 KO using WB method. 60ug/lane was loaded. ECL-film was used for detection.60ug of total cell lysate was loaded for the KO screening. There were several non-specific bands below 50Kda region.
-
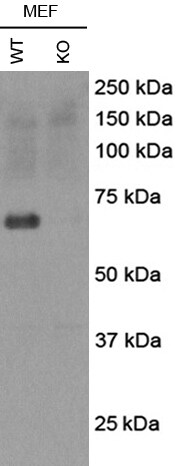
Application: Western BlotSample Tested: Mouse embryonic fibroblastsSpecies: MouseVerified Customer | Posted 12/18/2017Review for anti-p62 antibody (H00008878-M01)p62 knockout mouse embryonic fibroblasts Name: Anti-p62 antibody (H00008878-M01) Catalog #: Anti-p62 antibody (H00008878-M01) Lot Number: Anti-p62 antibody (H00008878-M01, Lot # H5191-2C11) PO/Order Number: Click here to enter text.. WB Image Description (Please provide labels for all lanes): lane 1: WT mouse embryonic fibroblasts; lane 2: p62 knockout mouse embryonic fibroblasts Sample Information: Cell Line or Tissue: mouse embryonic fibroblasts; Species: mouse Treatment: No treatment Lysate Preparation: Date of lysate preparation: December 15, 2017 Lysis buffer used: 1X lysis buffer from Cell Signaling by adding PMSF Reducing agent: beta-mercaptoethanol, DTT If boiled (temperature/time): Yes Controls: Positive Control: Wild type Negative Control: Knockout Loading Control (please attach additional images if applicable): No Protein Amount Loaded per lane: 20 ug Antibody Storage Conditions: -20℃ Electrophoresis: Gel Percentage: 8% Electrophoresis Conditions: Tris-Glycine-SDS at room temperature Voltage: 120V Time: 2 hours Membrane Transfer: Method (Submersion/Semi-dry): wet transfer Membrane Type (PVDF/Nitrocellulose): Nitrocellulose Time: 2 hours Voltage: 100V Blocking: Blocking Solution: 5% milk in 1X TBST Time: 1 hour at room temperature Primary Antibody: Dilution: 1/1000 Diluent Buffer: 2.5% BSA Incubation Time: overnight Incubation Temperature: 4℃ Washing Conditions: Wash Solution: 1X TBST Time and Repetitions: 5 min each for 3 times Secondary Antibody Manufacturer and Catalog #: Promega, W402B, Lot # 0000191071 Secondary description: goat anti-mouse secondary antibody Dilution: 1/2000 Diluent Buffer: 3% milk Incubation Time: 1 hour Incubation Temperature: room temperature Detection Method: Detection: ECL (GE, cat # RPN2209, lot # 9838243) Procedure: Add equal volume of A and B, mix and apply on the membranes for 3-5 min before exposure Development Time: 20 seconds Molecular weight of band(s): ~ 65 kDa Experimental Concerns and Observations: A specific band around 65 kDa was observed
-
Application: Western BlotSample Tested: DEndritic cell lysateSpecies: MouseVerified Customer | Posted 05/04/2017
-
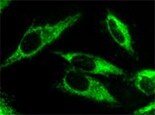
Application: ImmunofluorescenceSample Tested: Differentiated cell lineSpecies: HumanVerified Customer | Posted 04/05/2016SH-SY5Y cell line. Red - p62 puncta; Blue - nuclear DAPI; Green - Cytoskeleton
-
Application: Western BlotSample Tested: Rat brainSpecies: RatVerified Customer | Posted 11/01/2014
-
Application: Western BlotSample Tested: mouse hepatocytes and HepG2 cellsSpecies: MouseVerified Customer | Posted 10/24/2014p62 blot in p62 WT and knockout hepatocytes and HepG2 cells
-
Application: ImmunoprecipitationSample Tested: Human spinal cord cytoplasmic homogenatesSpecies: HumanVerified Customer | Posted 08/07/2014Immunoprecipitation in spinal cord lysates with Ms p62, WB: Rb KEAP (Proteintech). Lane 1: IP with p62, Lane 2:IP with Ms IgG
-
Application: Western BlotSample Tested: MouseSpecies: MouseVerified Customer | Posted 09/28/2011
There are no reviews that match your criteria.
Protocols
Find general support by application which include: protocols, troubleshooting, illustrated assays, videos and webinars.
- Antigen Retrieval Protocol (PIER)
- Antigen Retrieval for Frozen Sections Protocol
- Appropriate Fixation of IHC/ICC Samples
- Cellular Response to Hypoxia Protocols
- Chromogenic IHC Staining of Formalin-Fixed Paraffin-Embedded (FFPE) Tissue Protocol
- Chromogenic Immunohistochemistry Staining of Frozen Tissue
- ClariTSA™ Fluorophore Kits
- Detection & Visualization of Antibody Binding
- ELISA Sample Preparation & Collection Guide
- ELISA Troubleshooting Guide
- Fluorescent IHC Staining of Frozen Tissue Protocol
- Graphic Protocol for Heat-induced Epitope Retrieval
- Graphic Protocol for the Preparation and Fluorescent IHC Staining of Frozen Tissue Sections
- Graphic Protocol for the Preparation and Fluorescent IHC Staining of Paraffin-embedded Tissue Sections
- Graphic Protocol for the Preparation of Gelatin-coated Slides for Histological Tissue Sections
- How to Run an R&D Systems DuoSet ELISA
- How to Run an R&D Systems Quantikine ELISA
- How to Run an R&D Systems Quantikine™ QuicKit™ ELISA
- ICC Cell Smear Protocol for Suspension Cells
- ICC Immunocytochemistry Protocol Videos
- ICC for Adherent Cells
- IHC Sample Preparation (Frozen sections vs Paraffin)
- Immunocytochemistry (ICC) Protocol
- Immunocytochemistry Troubleshooting
- Immunofluorescence of Organoids Embedded in Cultrex Basement Membrane Extract
- Immunofluorescent IHC Staining of Formalin-Fixed Paraffin-Embedded (FFPE) Tissue Protocol
- Immunohistochemistry (IHC) and Immunocytochemistry (ICC) Protocols
- Immunohistochemistry Frozen Troubleshooting
- Immunohistochemistry Paraffin Troubleshooting
- Immunoprecipitation Protocol
- Preparing Samples for IHC/ICC Experiments
- Preventing Non-Specific Staining (Non-Specific Binding)
- Primary Antibody Selection & Optimization
- Protocol for Heat-Induced Epitope Retrieval (HIER)
- Protocol for Making a 4% Formaldehyde Solution in PBS
- Protocol for VisUCyte™ HRP Polymer Detection Reagent
- Protocol for the Fluorescent ICC Staining of Cell Smears - Graphic
- Protocol for the Fluorescent ICC Staining of Cultured Cells on Coverslips - Graphic
- Protocol for the Preparation & Fixation of Cells on Coverslips
- Protocol for the Preparation and Chromogenic IHC Staining of Frozen Tissue Sections
- Protocol for the Preparation and Chromogenic IHC Staining of Frozen Tissue Sections - Graphic
- Protocol for the Preparation and Chromogenic IHC Staining of Paraffin-embedded Tissue Sections
- Protocol for the Preparation and Chromogenic IHC Staining of Paraffin-embedded Tissue Sections - Graphic
- Protocol for the Preparation and Fluorescent ICC Staining of Cells on Coverslips
- Protocol for the Preparation and Fluorescent ICC Staining of Non-adherent Cells
- Protocol for the Preparation and Fluorescent ICC Staining of Stem Cells on Coverslips
- Protocol for the Preparation and Fluorescent IHC Staining of Frozen Tissue Sections
- Protocol for the Preparation and Fluorescent IHC Staining of Paraffin-embedded Tissue Sections
- Protocol for the Preparation of Gelatin-coated Slides for Histological Tissue Sections
- Protocol for the Preparation of a Cell Smear for Non-adherent Cell ICC - Graphic
- Quantikine HS ELISA Kit Assay Principle, Alkaline Phosphatase
- Quantikine HS ELISA Kit Principle, Streptavidin-HRP Polymer
- R&D Systems Quality Control Western Blot Protocol
- Sandwich ELISA (Colorimetric) – Biotin/Streptavidin Detection Protocol
- Sandwich ELISA (Colorimetric) – Direct Detection Protocol
- TUNEL and Active Caspase-3 Detection by IHC/ICC Protocol
- The Importance of IHC/ICC Controls
- Troubleshooting Guide: ELISA
- Troubleshooting Guide: Immunohistochemistry
- Troubleshooting Guide: Western Blot Figures
- Western Blot Conditions
- Western Blot Protocol
- Western Blot Protocol for Cell Lysates
- Western Blot Troubleshooting
- Western Blot Troubleshooting Guide
- View all Protocols, Troubleshooting, Illustrated assays and Webinars
Loading...