PD-L1 Antibody - BSA Free
Novus Biologicals | Catalog # NBP1-76769
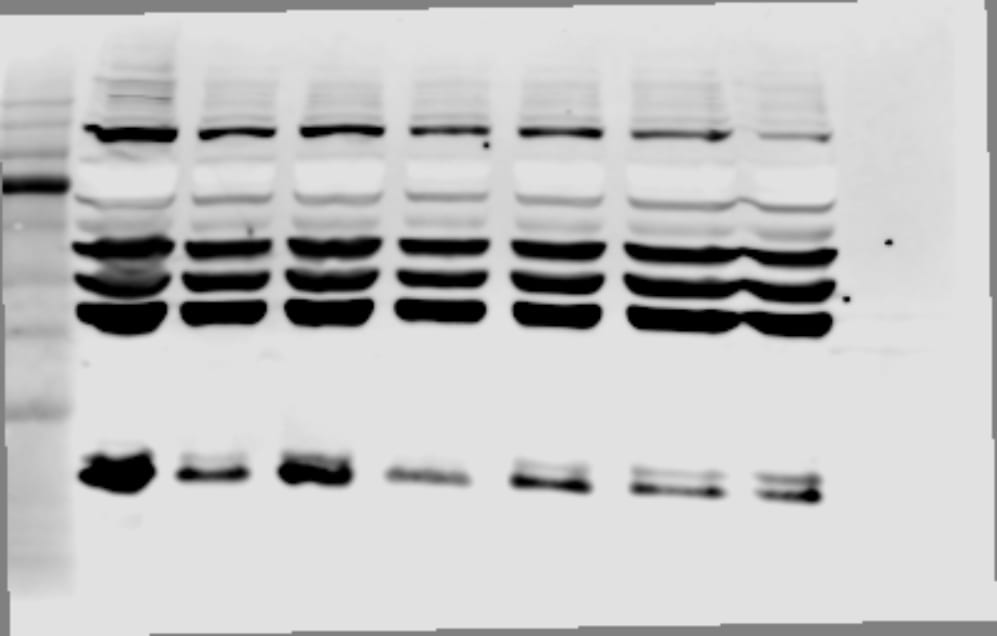
![Knockdown Validated: PD-L1 Antibody - BSA Free [NBP1-76769]](https://resources.rndsystems.com/images/products/PD-L1-Antibody-Knockdown-Validated-NBP1-76769-img0024.jpg "Western Blot: PD-L1 Antibody - BSA Free [NBP1-76769]")
Key Product Details
Validated by
Knockout/Knockdown, Independent Antibodies, Biological Validation
Species Reactivity
Validated:
Human, Mouse, Rat
Cited:
Human, Mouse, Rat
Applications
Validated:
Immunohistochemistry, Immunohistochemistry-Paraffin, Immunohistochemistry-Frozen, Immunohistochemistry Whole-Mount, Western Blot, ELISA, Flow Cytometry, Dual RNAscope ISH-IHC, Immunocytochemistry/ Immunofluorescence, Immunoprecipitation, Knockdown Validated
Cited:
Immunohistochemistry-Paraffin, Immunohistochemistry Whole-Mount, Western Blot, Immunocytochemistry/ Immunofluorescence, Immunoprecipitation, IF/IHC, IHC-F, Knockdown Validated
Label
Unconjugated
Antibody Source
Polyclonal Rabbit IgG
Format
BSA Free
Loading...
Product Specifications
Immunogen
Antibody was raised against a 17 amino acid synthetic peptide from near the center of human PD-L1. The immunogen is located within amino acids 60-110 of PD-L1.
Specificity
PD-L1 antibody has no cross-reactivity to PD-L2.
Clonality
Polyclonal
Host
Rabbit
Isotype
IgG
Theoretical MW
37 kDa.
Disclaimer note: The observed molecular weight of the protein may vary from the listed predicted molecular weight due to post translational modifications, post translation cleavages, relative charges, and other experimental factors.
Disclaimer note: The observed molecular weight of the protein may vary from the listed predicted molecular weight due to post translational modifications, post translation cleavages, relative charges, and other experimental factors.
Scientific Data Images for PD-L1 Antibody - BSA Free
Western Blot: PD-L1 Antibody - BSA Free [NBP1-76769]
Western Blot: PD-L1 Antibody [NBP1-76769] - Validation with PD-L1 siRNA Knockdown. HeLa cells were transfected with control siRNAs (lane 1) or PD-L1 siRNAs (lane 2). Loading: 10 ug of HeLa whole cell lysates per lane. Antibodies: NBP1-76769 (2 ug/mL) and GAPDH (0.02 ug/mL), 1 h incubation at RT in 5% NFDM/TBST. Secondary: Goat anti-rabbit IgG HRP conjugate at 1:10000 dilution.![Western Blot: PD-L1 AntibodyBSA Free [NBP1-76769]](https://resources.rndsystems.com/images/products/PD-L1-Antibody-Western-Blot-NBP1-76769-img0023.jpg "Western Blot: PD-L1 AntibodyBSA Free [NBP1-76769]")
Western Blot: PD-L1 AntibodyBSA Free [NBP1-76769]
Western Blot: PD-L1 Antibody [NBP1-76769] - Independent Antibody Validation (IAV) via Protein Expression ProfileLoading: 15 ug of lysates per lane.Antibodies: NBP1-76769 (2 ug/mL), PD-L1 (2 ug/mL), and beta-actin (1 ug/mL), 1 h incubation at RT in 5% NFDM/TBST.Secondary: Goat anti-rabbit and or anti-mouse IgG HRP conjugate at 1:10000 and 1:5000 dilution, respectively.![Immunohistochemistry-Paraffin: PD-L1 Antibody - BSA Free [NBP1-76769]](https://resources.rndsystems.com/images/products/PD-L1-Antibody-Immunohistochemistry-Paraffin-Negative-NBP1-76769-img0025.jpg "Immunohistochemistry-Paraffin: PD-L1 Antibody - BSA Free [NBP1-76769]")
Immunohistochemistry-Paraffin: PD-L1 Antibody - BSA Free [NBP1-76769]
PD-L1-Antibody-Immunohistochemistry-Paraffin-Negative-NBP1-76769-img0025.jpg![Western Blot: PD-L1 AntibodyBSA Free [NBP1-76769]](https://resources.rndsystems.com/images/products/PD-L1-Antibody-Western-Blot-NBP1-76769-img0026.jpg "Western Blot: PD-L1 AntibodyBSA Free [NBP1-76769]")
Western Blot: PD-L1 AntibodyBSA Free [NBP1-76769]
PD-L1-Antibody-Western-Blot-NBP1-76769-img0026.jpg![Western Blot: PD-L1 AntibodyBSA Free [NBP1-76769]](https://resources.rndsystems.com/images/products/PD-L1-Antibody-Western-Blot-NBP1-76769-img0027.jpg "Western Blot: PD-L1 AntibodyBSA Free [NBP1-76769]")
![Western Blot: PD-L1 AntibodyBSA Free [NBP1-76769]](https://resources.rndsystems.com/images/products/PD-L1-Antibody-Western-Blot-NBP1-76769-img0028.jpg "Western Blot: PD-L1 AntibodyBSA Free [NBP1-76769]")
Western Blot: PD-L1 AntibodyBSA Free [NBP1-76769]
PD-L1-Antibody-Western-Blot-NBP1-76769-img0028.jpg![Immunocytochemistry/ Immunofluorescence: PD-L1 Antibody - BSA Free [NBP1-76769]](https://resources.rndsystems.com/images/products/PD-L1-Antibody-Immunocytochemistry-Immunofluorescence-NBP1-76769-img0029.jpg "Immunocytochemistry/ Immunofluorescence: PD-L1 Antibody - BSA Free [NBP1-76769]")
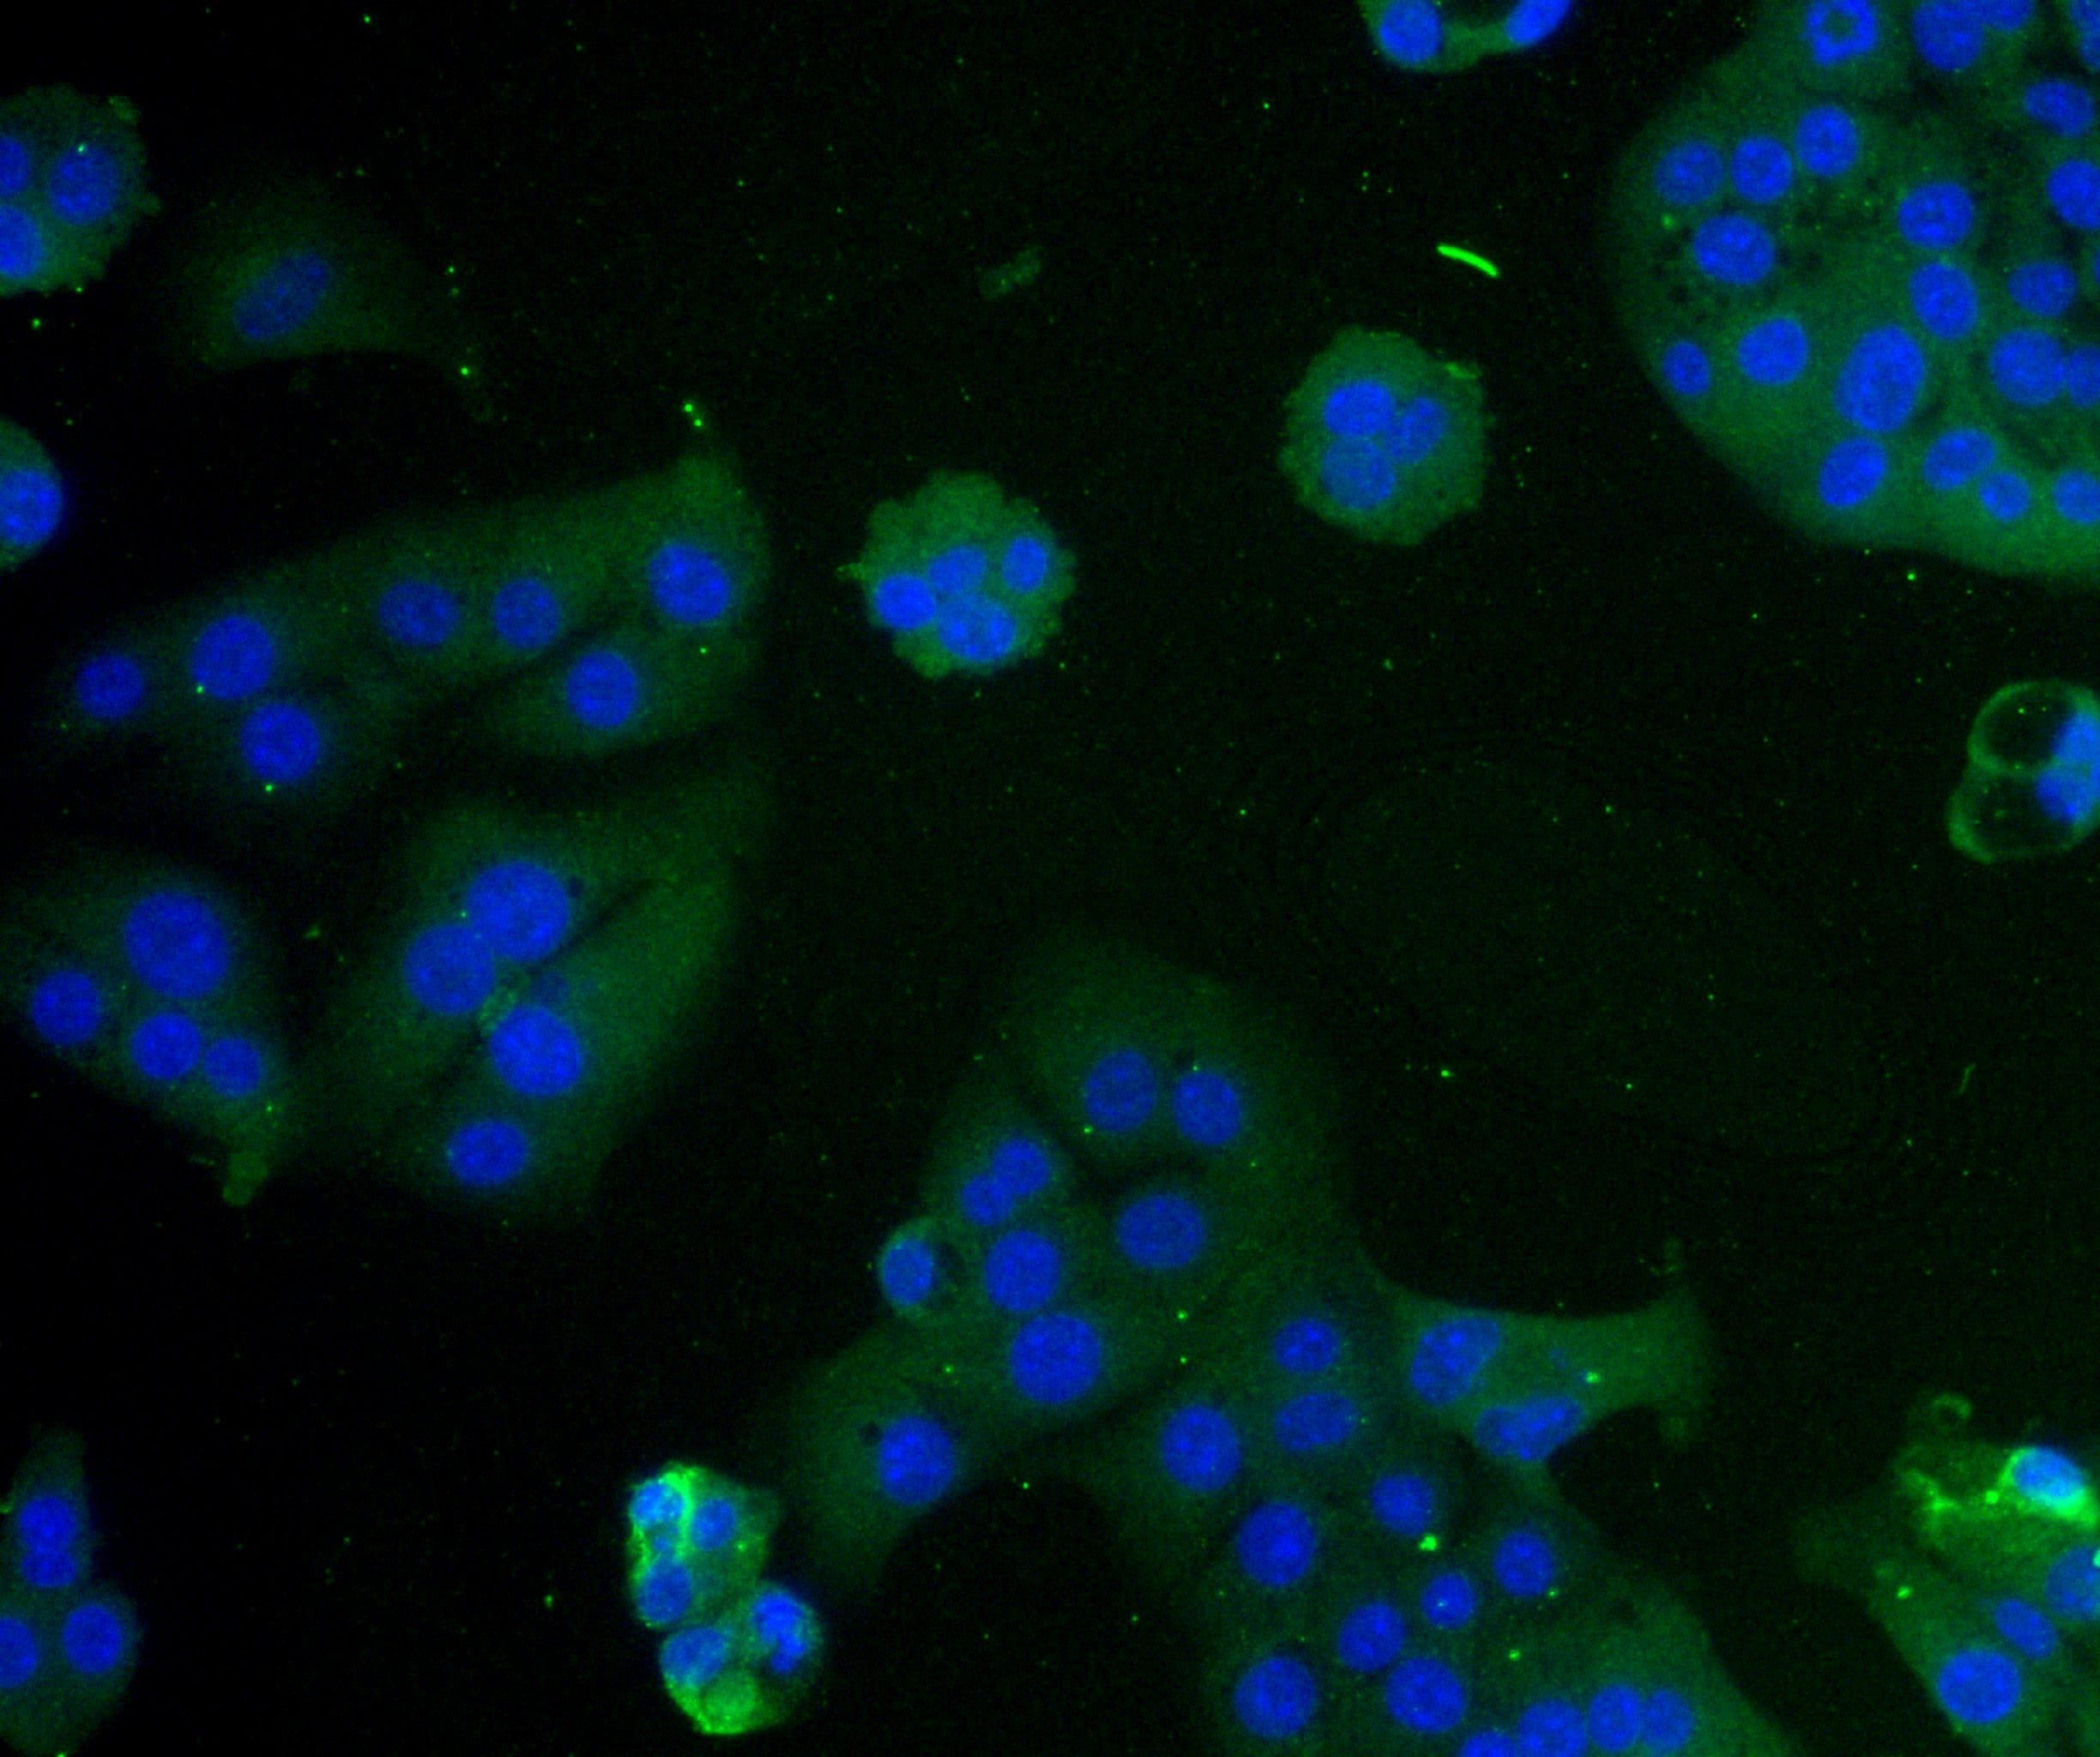
Immunocytochemistry/ Immunofluorescence: PD-L1 Antibody - BSA Free [NBP1-76769]
Immunocytochemistry/Immunofluorescence: PD-L1 Antibody [NBP1-76769] - U-251 MG cells were fixed in 4% paraformaldehyde for 10 minutes and permeabilized in 0.05% Triton X-100 in PBS for 5 minutes. The cells were incubated with anti- NBP1-76769 at 1 ug/ml overnight at 4C and detected with an anti-rabbit Dylight 488 (Green) at a 1:1000 dilution for 60 minutes. Nuclei were counterstained with DAPI (Blue). Cells were imaged using a 100X objective and digitally deconvolved.![Flow Cytometry: PD-L1 Antibody - BSA Free [NBP1-76769]](https://resources.rndsystems.com/images/products/PD-L1-Antibody-Flow-Cytometry-NBP1-76769-img0030.jpg "Flow Cytometry: PD-L1 Antibody - BSA Free [NBP1-76769]")
Flow Cytometry: PD-L1 Antibody - BSA Free [NBP1-76769]
Flow Cytometry: PD-L1 Antibody [NBP1-76769] - An intracellular stain was performed on U-251 MG cells with PD-L1 Antibody NBP1-76769 (blue) and a matched isotype control NBP2-24891 (orange). Cells were fixed with 4% PFA and then permeabilized with 0.1% saponin. Cells were incubated in an antibody dilution of 2.5 ug/mL for 30 minutes at room temperature, followed by Rabbit IgG (H+L) Cross-Adsorbed Secondary Antibody, Dylight 550 (SA5-10033, Thermo Fisher).![Western Blot: PD-L1 AntibodyBSA Free [NBP1-76769]](https://resources.rndsystems.com/images/products/PD-L1-Antibody-Western-Blot-NBP1-76769-img0019.jpg "Western Blot: PD-L1 AntibodyBSA Free [NBP1-76769]")
Western Blot: PD-L1 AntibodyBSA Free [NBP1-76769]
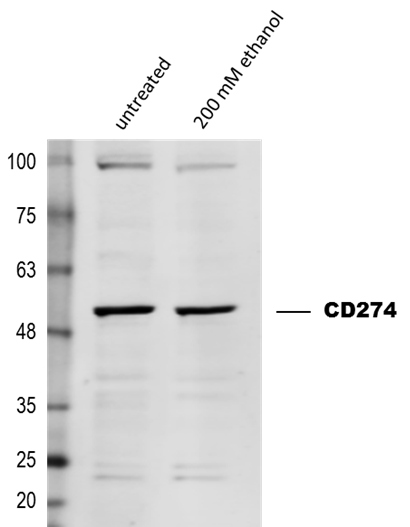
Western Blot: PD-L1 Antibody [NBP1-76769] - Expression of CD274 in Human melanoma SK-MEL-28 cell line upon treatment with 200 mM ethanol. Dilution: 1:1,000 in PBS with 5% BSA. Secondary Ab: anti-Rabbit IgG 1:5,000. Western blot image submitted by a verified customer review.![Immunohistochemistry-Paraffin: PD-L1 Antibody - BSA Free [NBP1-76769]](https://resources.rndsystems.com/images/products/PD-L1-Antibody-Immunohistochemistry-Paraffin-NBP1-76769-img0017.jpg "Immunohistochemistry-Paraffin: PD-L1 Antibody - BSA Free [NBP1-76769]")
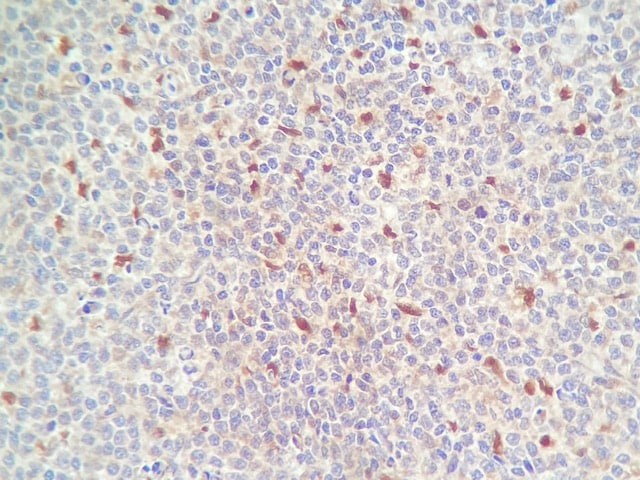
Immunohistochemistry-Paraffin: PD-L1 Antibody - BSA Free [NBP1-76769]
Immunohistochemistry-Paraffin: PD-L1 Antibody [NBP1-76769] - B7-H1/PD-L1/CD274 Antibody [NBP1-76769] - Human tonsil tissue with PD-L1 antibody at 5 ug/mL.![Immunohistochemistry-Paraffin: PD-L1 Antibody - BSA Free [NBP1-76769]](https://resources.rndsystems.com/images/products/PD-L1-Antibody-Immunohistochemistry-Paraffin-NBP1-76769-img0010.jpg "Immunohistochemistry-Paraffin: PD-L1 Antibody - BSA Free [NBP1-76769]")
Immunohistochemistry-Paraffin: PD-L1 Antibody - BSA Free [NBP1-76769]
Immunohistochemistry-Paraffin: PD-L1 Antibody [NBP1-76769] - Staining of human heart tissue with antibody at 2.5 ug/mL.![Immunohistochemistry-Paraffin: PD-L1 Antibody - BSA Free [NBP1-76769]](https://resources.rndsystems.com/images/products/PD-L1-Antibody-Immunohistochemistry-Paraffin-NBP1-76769-img0020.jpg "Immunohistochemistry-Paraffin: PD-L1 Antibody - BSA Free [NBP1-76769]")
Immunohistochemistry-Paraffin: PD-L1 Antibody - BSA Free [NBP1-76769]
Immunohistochemistry-Paraffin: PD-L1 Antibody [NBP1-76769] - PD-L1/B7-H1 Antibody [NBP1-76769] - PD-L1 in rat heart tissue with at 5 ug/mL.![Flow Cytometry: PD-L1 Antibody - BSA Free [NBP1-76769]](https://resources.rndsystems.com/images/products/PD-L1-Antibody-Flow-Cytometry-NBP1-76769-img0018.jpg "Flow Cytometry: PD-L1 Antibody - BSA Free [NBP1-76769]")
Flow Cytometry: PD-L1 Antibody - BSA Free [NBP1-76769]
Flow Cytometry: PD-L1 Antibody [NBP1-76769] - B7-H1/PD-L1/CD274 Antibody [NBP1-76769] - Analysis of A-20 cells using B7-H1/PD-L1/CD274 antibody at 0.5 ug/mL. Green: Isotype control. Red : B7-H1/PD-L1/CD274 antibody.![Immunofluorescence: PD-L1 Antibody - BSA Free [NBP1-76769]](https://resources.rndsystems.com/images/products/PD-L1-Antibody-Immunofluorescence-NBP1-76769-img0009.jpg "Immunofluorescence: PD-L1 Antibody - BSA Free [NBP1-76769]")
Immunofluorescence: PD-L1 Antibody - BSA Free [NBP1-76769]
Immunofluorescence: PD-L1 Antibody [NBP1-76769] - Human Heart cells with PD-L1 antibody at 20 ug/mL.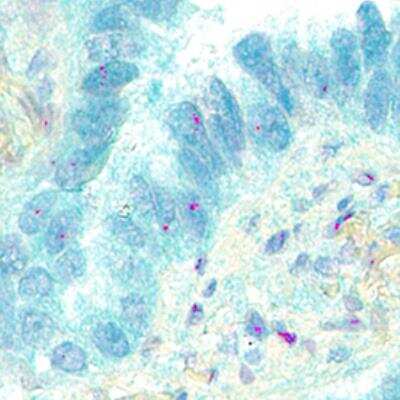
Dual RNAscope ISH-IHC: PD-L1 Antibody [NBP1-76769] - PDCD1 mRNA (red) and PD-L1 protein (green) were detected in formalin-fixed paraffin-embedded tissue sections of human lung cancer. ACD's Integrated Co-Detection Workflow was performed using ACD RNAScope Probe Hs-PDCD1 and PD-L1 antibody at 1:100 dilution. Tissue was stained on Leica Bond RX using RNAscope (TM) 2.5 LS Reagent Kit-RED, BOND Polymer Refine Detection (DAB) and Hematoxylin, BOND Polymer Refine Red Detection and Hematoxylin and RNAscope (TM) 2.5 LS Green Accessory Pack. Tissue was counterstained with 50% hematoxylin (blue).

Western Blot: PD-L1 Antibody - BSA Free [NBP1-76769] -
Abrogation of autophagy by siRNAs targeting autophagy-related genes in gastric cancer cells induced tumor-intrinsic PD-L1 expression. a Inhibition of autophagy by knockdown of ATG5 in AGS & NCI-n87 gastric cancer cells induced the expression of PD-L1 in the presence & absence of INF-gamma (200 U/mL) as shown by flow cytometry analysis at 48 h post-transfection. b The induction of PD-L1 was confirmed by Western blots at 72 h post-transfection. The knockdown efficacies of ATG5 & ATG7 siRNA were verified. The conversion of LC3B-I to LC3B-II was reduced. Results were averaged & blots were representative of 4 independent experiments. The ratio of PD-L1 MFI minus isotype control was shown as mean ± S.D. relative to Ctrl from 4 independent experiments, *p < 0.05 Image collected & cropped by CiteAb from the following publication (https://pubmed.ncbi.nlm.nih.gov/30925913), licensed under a CC-BY license. Not internally tested by Novus Biologicals.
Western Blot: PD-L1 Antibody - BSA Free [NBP1-76769] -
Effects of autophagy inhibitors in combination with IFN-gamma on expression of PD-L1 in gastric cancer cell lines. a The effect of chloroquine (CQ) or 3-MA on expression of PD-L1 with or without INF-gamma for 24 h was determined by flow cytometry assays. In AGS & NCI-n87 cells, MFI as the indication of PD-L1 expression level can be further increased by the treatment of INF-gamma. b Levels of LC3B-I/II, p62/SQSTM1 & PD-L1 were determined by Western blots in AGS & NCI-n87 cells treated by CQ, 3-MA, bafilomycin A1 (Baf) or rapamycin (Rap) for 24 h. c Positive staining of PD-L1 (red) & LC3 positive puncta (green) was determined by immunofluorescence in AGS & NCI-n87 cells treated by autophagy inhibitors & activator as in (b). d Rapamycin decreased the levels of PD-L1 protein in AGS & NCI-n87 cells as shown by flow cytometry. Results were averaged & blots were representative of 4 independent experiments, *p < 0.05, **p < 0.01 Image collected & cropped by CiteAb from the following publication (https://pubmed.ncbi.nlm.nih.gov/30925913), licensed under a CC-BY license. Not internally tested by Novus Biologicals.
Western Blot: PD-L1 Antibody - BSA Free [NBP1-76769] -
Western Blot: PD-L1 Antibody - BSA Free [NBP1-76769] - ROS mediated PD-L1 upregulation in FFA-treated LO2 cells. (a) Intracellular ROS in LO2 cells before & after FFA treatment measured by DCFH-DA. (b–d) Expression levels of NOX2 & NOX4 measured using qRT-PCR & western blot. (e) JC-1 probes were used to detect mitochondrial membrane potential. (f–j) Intracellular ROS in LO2 cells pretreated with siRNA against NOX4, MitoTEMPO (10 μM), or NAC (5 mM) followed by FFA treatment, measured by DCFH-DA, PD-L1 expression determined by western blot. ∗∗P < 0.01. Image collected & cropped by CiteAb from the following publication (https://pubmed.ncbi.nlm.nih.gov/35615575), licensed under a CC-BY license. Not internally tested by Novus Biologicals.
Western Blot: PD-L1 Antibody - BSA Free [NBP1-76769] -
Western Blot: PD-L1 Antibody - BSA Free [NBP1-76769] - Inhibition of NF-kappa B or STAT3 downregulated PD-L1 expression in adi-CM model. a PD-L1 protein levels in HepG2 cells treated with different concentration of NF-kappa B inhibitor, withaferin A (WA). b PD-L1 protein levels in HepG2 cells treated with different concentration of STAT3 inhibitor, BP-1-102. c PD-L1 protein levels in B16-F1 cells incubated with WA. Data are expressed as mean ± SEM, n = 6, **P < 0.01, ***P < 0.001 Vs adi-CM group. ##P < 0.01 & ###P < 0.001 Vs DMSO group Image collected & cropped by CiteAb from the following publication (https://pubmed.ncbi.nlm.nih.gov/32477009), licensed under a CC-BY license. Not internally tested by Novus Biologicals.
Western Blot: PD-L1 Antibody - BSA Free [NBP1-76769] -
Western Blot: PD-L1 Antibody - BSA Free [NBP1-76769] - PD-L1 expression levels in liver samples & FFA-treated LO2 cells. (a–d) PD-L1 expression & CD8+ T cells in the liver tissues determined by immunohistochemistry. (e) Intracellular lipid accumulation after FFA treatment (0.8 mM) for 24 hour measured by Oil Red staining. (f–i) Expression levels of PD-L1 detected by qRT-PCR, western blot, & immunofluorescence. ∗∗P < 0.01. Image collected & cropped by CiteAb from the following publication (https://pubmed.ncbi.nlm.nih.gov/35615575), licensed under a CC-BY license. Not internally tested by Novus Biologicals.
Western Blot: PD-L1 Antibody - BSA Free [NBP1-76769] -
Western Blot: PD-L1 Antibody - BSA Free [NBP1-76769] - Inhibition of NF-kappa B or STAT3 downregulated PD-L1 expression in adi-CM model. a PD-L1 protein levels in HepG2 cells treated with different concentration of NF-kappa B inhibitor, withaferin A (WA). b PD-L1 protein levels in HepG2 cells treated with different concentration of STAT3 inhibitor, BP-1-102. c PD-L1 protein levels in B16-F1 cells incubated with WA. Data are expressed as mean ± SEM, n = 6, **P < 0.01, ***P < 0.001 Vs adi-CM group. ##P < 0.01 & ###P < 0.001 Vs DMSO group Image collected & cropped by CiteAb from the following publication (https://pubmed.ncbi.nlm.nih.gov/32477009), licensed under a CC-BY license. Not internally tested by Novus Biologicals.
Western Blot: PD-L1 Antibody - BSA Free [NBP1-76769] -
Western Blot: PD-L1 Antibody - BSA Free [NBP1-76769] - ROS/ZNF24/PD-L1 pathway activation in NAFLD models. (a) Intracellular ROS in hepatocytes in NAFLD significantly increased. (b) JC-1 probes were used to detect mitochondrial membrane potential. (c & d) NOX4 & ZNF24 expressions were determined by immunohistochemistry. (e & f) ROS/ZNF24/PD-L1 pathway activation examined by western blot. Image collected & cropped by CiteAb from the following publication (https://pubmed.ncbi.nlm.nih.gov/35615575), licensed under a CC-BY license. Not internally tested by Novus Biologicals.
Western Blot: PD-L1 Antibody - BSA Free [NBP1-76769] -
Western Blot: PD-L1 Antibody - BSA Free [NBP1-76769] - PD-L1 limits liver injury in NAFLD models. (a & b) Western blot determined the effect of siRNA against PD-L1. (c) After PD-L1 knockdown, mRNA expression levels of markers of T cell activation measured by qRT-PCR. (d & e) Hepatocyte injury was evaluated by the Tunel assay & ALT/AST measurement. (f) Graph illustrating that both ROS/ZNF24 pathway activation & UBE2I-mediated ZNF24 sumoylation suppression induced by FFA promoted PD-L1 expression. ∗P < 0.05, ∗∗P < 0.01. Image collected & cropped by CiteAb from the following publication (https://pubmed.ncbi.nlm.nih.gov/35615575), licensed under a CC-BY license. Not internally tested by Novus Biologicals.
Western Blot: PD-L1 Antibody - BSA Free [NBP1-76769] -
Western Blot: PD-L1 Antibody - BSA Free [NBP1-76769] - PD-L1 knockdown aggravated the damage of CD8 + T cells to FFA-treated LO2 cells. (a & b) Western blot determined the effect of siRNA against PD-L1. Coculturing of FFA-treated LO2 cells & CD8 + T cells in vitro. (c) mRNA expression levels of markers of T cell activation measured by qRT-PCR, (d) LO2 cell injury was evaluated by LDH assay, (e) AST or ALT in the supernatants measured by commercial assay kits. # represents that CD8 + T cells were incubated separately with LO2 cells, but supernatants were put together. ∗P < 0.05, ∗∗P < 0.01. Image collected & cropped by CiteAb from the following publication (https://pubmed.ncbi.nlm.nih.gov/35615575), licensed under a CC-BY license. Not internally tested by Novus Biologicals.
Western Blot: PD-L1 Antibody - BSA Free [NBP1-76769] -
Western Blot: PD-L1 Antibody - BSA Free [NBP1-76769] - Upregulated expression of PD‐L1 in cisplatin‐resistant cells through IL‐6/STAT3. The cisplatin resistant CAL27cis & Detroit‐562cis cells had increased IL‐6 mRNA & IL‐6 protein production compared to parental cells by qRT‐PCR & ELISA (A, B). CAL27cis & Detroit‐562cis were cultured with IL‐6 (10 ng/mL, human recombinant IL‐6, R&D Systems, Minneapolis, USA) for 48 h (C). An anti‐human IL‐6 polyclonal antibody (R&D Systems, Minneapolis, USA) was used to neutralize the biological activities of IL‐6 (E, F). To inhibit signal transduction, CAL27cis & Detroit‐562cis cells were pre‐incubated for 1 h with STAT3 inhibitor V (Sigma‐Aldrich, Germany, 500 nmol/L), & then incubated with recombinant human IL‐6 (10 ng/mL) for 24 h before analysis. Data are shown as mean ± SD of 3 independent triplicate cultures (A, B, D, E, F, H). *P < .05, **P < .01 & ***P < .001, compared with the results of control without IL‐6 (D), control IgG (E, F) & with IL‐6 alone (H) Image collected & cropped by CiteAb from the following publication (https://pubmed.ncbi.nlm.nih.gov/29761938), licensed under a CC-BY license. Not internally tested by Novus Biologicals.
Western Blot: PD-L1 Antibody - BSA Free [NBP1-76769] -
Western Blot: PD-L1 Antibody - BSA Free [NBP1-76769] - ZNF24 promoted PD-L1 expression through binding to its promoter in FFA-treated LO2 cells. (a) A schematic of the target sites (wild & mutant) of ZNF24 in the promoter of PD-L1. (b–d) Dual-luciferase reporter assays performed in LO2 cells transfected with WT or MT plasmid containing ZNF24-binding sites in the PD-L1 promoter using Lipofectamine 2000 after ZNF24 overexpression. (e–g) ZNF24 expression after FFA treatment determined by qRT-PCR & western blot. (h & i) ZNF24 expression in LO2 cells pretreated with siRNA against NOX4, MitoTEMPO (10 μM), or NAC (5 mM) followed by FFA treatment, measured by western blot. (j & k) ZNF24 & PD-L1 expression in LO2 cells pretreated with siRNA against ZNF24, followed by FFA treatment detected by western blot. ∗∗P < 0.01. Image collected & cropped by CiteAb from the following publication (https://pubmed.ncbi.nlm.nih.gov/35615575), licensed under a CC-BY license. Not internally tested by Novus Biologicals.
Western Blot: PD-L1 Antibody - BSA Free [NBP1-76769] -
Western Blot: PD-L1 Antibody - BSA Free [NBP1-76769] - LfcinB reduced IL‐6‐dependent PD‐L1 expression in cisplatin‐resistant HNSCC cells (A‐C) & inhibited the xenograft growth from CAL27cis & Detroit‐562cis (D, E). The markedly decreased IL‐6 (A) by ELISA & PD‐L1 by WB (B, C) in the acquired cisplatin‐resistant cells were detected. In figure A, C & D, data are shown as mean ± SD of 3 independent triplicate cultures. *P < .05 & **P < .01, compared with the results of control without IL‐6 (A, C). To investigate the effects of LfcinB on in vivo growth of CAL27cis & Detroit‐562cis, we treated nude mice carrying CAL27cis (D) & Detroit‐562cis (E) xenografts with once‐daily injection of 0.75 mg LfcinB (n = 5). Tumor growth of HNSCC xenografts displayed significant reduction after 3 days of LfcinB treatment, compared to control with saline (*P < .05 for LfcinB) Image collected & cropped by CiteAb from the following publication (https://pubmed.ncbi.nlm.nih.gov/29761938), licensed under a CC-BY license. Not internally tested by Novus Biologicals.
Western Blot: PD-L1 Antibody - BSA Free [NBP1-76769] -
Western Blot: PD-L1 Antibody - BSA Free [NBP1-76769] - Identification of ZNF24–UBE2I protein interactions. (a & b) Analysis of protein interactions between ZNF24 & UBE2I using the BioGRID database, further confirmed by Co-IP assays. (c–f) UBE2I expression in LO2 cells treated by FFA or pretreated with siRNA against NOX4, MitoTEMPO (10 μM), or NAC (5 mM) followed by FFA treatment measured by western blot. (g & h) After FFA treatment, Sumo-1: ZNF24 & ZNF24 expression levels detected by western blot. (i & j) After UBE2I overexpression, Sumo-1: ZNF24, ZNF24, PD-L1, & UBE2I expression levels were determined by western blot. (k–m) Dual-luciferase reporter assays performed in LO2 cells transfected with WT plasmid containing ZNF24-binding sites in the PD-L1 promoter using Lipofectamine 2000 after ZNF24 overexpression with or without Sumo-1 overexpression. ∗∗P < 0.01. Image collected & cropped by CiteAb from the following publication (https://pubmed.ncbi.nlm.nih.gov/35615575), licensed under a CC-BY license. Not internally tested by Novus Biologicals.
PD-L1 in U-2 OS Human Cell Line.
PD-L1 was detected in immersion fixed U-2 OS human osteosarcoma cell line using Rabbit anti-PD-L1 Antigen Affinity Purified Polyclonal Antibody conjugated to Alexa Fluor® 647 (Catalog # NBP1-76769AF647) (light blue) at 10 µg/mL overnight at 4C. Cells were counterstained with DAPI (blue). Cells were imaged using a 100X objective and digitally deconvolved.Applications for PD-L1 Antibody - BSA Free
Application
Recommended Usage
ELISA
1:100 - 1:2000
Flow Cytometry
0.5 ug/ml
Immunocytochemistry/ Immunofluorescence
1-5 ug/ml
Immunohistochemistry
1:10-1:500
Immunohistochemistry-Paraffin
1:10-1:500
Western Blot
1:1000
Application Notes
Use in Immunohistochemistry Whole-Mount reported in scientific literature (PMID:34944780).Use in ICC/IF reported in scientific literature (PMID:33220359) Use in IHC-Frozen was reported in scientific literature (PMID: 28402953). Use in immunoprecipitation reported in scientific literature (PMID: 28978117)..
Reviewed Applications
Read 5 reviews rated 3.2 using NBP1-76769 in the following applications:
Flow Cytometry Panel Builder
Bio-Techne Knows Flow Cytometry
Save time and reduce costly mistakes by quickly finding compatible reagents using the Panel Builder Tool.
Advanced Features
- Spectra Viewer - Custom analysis of spectra from multiple fluorochromes
- Spillover Popups - Visualize the spectra of individual fluorochromes
- Antigen Density Selector - Match fluorochrome brightness with antigen density

Formulation, Preparation, and Storage
Purification
Peptide affinity purified
Formulation
PBS
Format
BSA Free
Preservative
0.02% Sodium Azide
Concentration
1 mg/ml
Shipping
The product is shipped with polar packs. Upon receipt, store it immediately at the temperature recommended below.
Stability & Storage
Store at 4C short term. Aliquot and store at -20C long term. Avoid freeze-thaw cycles.
Background: PD-L1/B7-H1
PD-L1 binding with receptor PD-1 results in phosphorylation of in the inhibitory tyrosine-based switch motif (ITSM) domain of PD-1, which leads to recruitment of Src homology 2 domain-containing protein tyrosine-phosphatase 2 (SHP-2) and eventual downstream phosphorylation of spleen tyrosine kinase (Syk) and phospholipid inositol-3-kinase (PI3K) (1,3). Under normal conditions, the PD-L1/PD-1 signaling axis helps maintain immune tolerance and prevent destructive immune responses by inhibiting T cell activity such as proliferation, survival, cytokine production, and cytotoxic T lymphocyte (CTL) cytotoxicity (1-3). In the tumor microenvironment (TME), however, the PD-L1/PD-1 signaling axis is hijacked to promote tumor cell survival and limit anti-tumor immune response (1,3). More precisely, tumor cells can escape killing and immune surveillance due to T cell exhaustion and apoptosis (1-3).
Given the role the PD-L1/PD-1 signaling axis plays in tumor cells' ability to evade immune surveillance, it has become a target of several immunotherapeutic agents in recent years (3,5). Antibody immunotherapies that target these inhibitory checkpoint molecules has shown great promise for cancer treatment (3,5). PD-L1 and PD-1 blocking agents have been approved for treatment in a number of cancers including melanoma, non-small cell lung cancer (NSCLC), urothelial carcinoma, and Merkel-cell carcinoma (3,5). In many cancers the expression of PD-L1 in the TME has predictive value for response to blocking agents (3). Pembrolizumab, for example, is a PD-1 inhibitor that has been approved by the FDA as a second-line therapy for treatment of metastatic NSCLC in patients whose tumors express PD-L1 with a Tumor Proportion Score (TPS) greater than 1%, but also for first-line treatment in cases where patients' tumors expression PD-L1 with a TPS greater than 50%) (5). The most promising cancer immunotherapy treatments seem to point to combination therapy with both anti-cancer drugs (e.g. Gefitibin, Metformin, Etoposide) with PD-L1/PD-1 antibody blockade inhibitors (e.g. Atezolizumab, Nivolumab) (6).
References
1. Han, Y., Liu, D., & Li, L. (2020). PD-1/PD-L1 pathway: current researches in cancer. American journal of cancer research, 10(3), 727-742.
2. Jiang, Y., Chen, M., Nie, H., & Yuan, Y. (2019). PD-1 and PD-L1 in cancer immunotherapy: clinical implications and future considerations. Human vaccines & immunotherapeutics, 15(5), 1111-1122. https://doi.org/10.1080/21645515.2019.1571892
3. Sun, C., Mezzadra, R., & Schumacher, T. N. (2018). Regulation and Function of the PD-L1 Checkpoint. Immunity, 48(3), 434-452. https://doi.org/10.1016/j.immuni.2018.03.014
4. Cha, J. H., Chan, L. C., Li, C. W., Hsu, J. L., & Hung, M. C. (2019). Mechanisms Controlling PD-L1 Expression in Cancer. Molecular cell, 76(3), 359-370. https://doi.org/10.1016/j.molcel.2019.09.030
5. Tsoukalas, N., Kiakou, M., Tsapakidis, K., Tolia, M., Aravantinou-Fatorou, E., Baxevanos, P., Kyrgias, G., & Theocharis, S. (2019). PD-1 and PD-L1 as immunotherapy targets and biomarkers in non-small cell lung cancer. Journal of B.U.ON. : official journal of the Balkan Union of Oncology, 24(3), 883-888.
6. Gou, Q., Dong, C., Xu, H., Khan, B., Jin, J., Liu, Q., Shi, J., & Hou, Y. (2020). PD-L1 degradation pathway and immunotherapy for cancer. Cell death & disease, 11(11), 955. https://doi.org/10.1038/s41419-020-03140-2
Long Name
Programmed Death Ligand 1
Alternate Names
B7-H1, B7H1, CD274, PDCD1L1, PDCD1LG1, PDL1
Gene Symbol
CD274
UniProt
Additional PD-L1/B7-H1 Products
Product Documents for PD-L1 Antibody - BSA Free
Certificate of Analysis
To download a Certificate of Analysis, please enter a lot or batch number in the search box below.
Product Specific Notices for PD-L1 Antibody - BSA Free
This product is for research use only and is not approved for use in humans or in clinical diagnosis. Primary Antibodies are guaranteed for 1 year from date of receipt.
Citations for PD-L1 Antibody - BSA Free
 Powered by Bioz
Customer Reviews for PD-L1 Antibody - BSA Free (5)
3.2 out of 5
5 Customer Ratings
Have you used PD-L1 Antibody - BSA Free?
Submit a review and receive an Amazon gift card!
$25/€18/£15/$25CAN/¥2500 Yen for a review with an image
$10/€7/£6/$10CAN/¥1110 Yen for a review without an image
Submit a review
Customer Images
Showing
1
-
5 of
5 reviews
Showing All
Filter By:
-
Application: Immunohistochemistry-ParaffinSample Tested: FFPESpecies: CanineVerified Customer | Posted 08/27/2020Histopathological section of a lymph node from a dog with lymphomaParaffin-embedded tissue blocks of 2 different samples were cut into 2 μm sections. Automated deparaffinization and rehydration was performed by immersing the slides in Xylene, in graded alcohol series and finally in water as indicated. 0.3% hydrogen peroxide was used to block endogenous peroxidase activity for 30 minutes. Antigen retrieval was performed for each sample both in citrate 10 mM (pH 6.0) buffer and in Tris-EDTA 10 mM (pH 9.0) buffer at 98°C for 30 minutes. Primary antibody was used both at final dilution of 5 ug/mL and 10 ug/mL in 1.5% horse serum in PBS, and sections were incubated for 2 hours at room temperature. Incubation with biotinylated secondary antibody and streptavidin/HRP complex were performed using the VECTASTAIN® Universal Quick Kit Peroxidase, R.T.U. following manufacturer’s instructions. DAB was added to tissue sections until brown color developed (3 minutes), then slides were moved to water for 5 minutes and counterstained in hematoxylin. Finally, slides were dehydrated and mounted.
 Bio-Techne ResponseThis review was submitted through the legacy Novus Innovators Program, reflecting a new species or application tested on a primary antibody.
 -
Application: ImmunocytochemistrySample Tested: pancreas cancer cellsSpecies: MouseVerified Customer | Posted 05/12/2018dilution 1:100 overnight incubation @ 4 C
-
Application: Western BlotSample Tested: human melanomaSpecies: HumanVerified Customer | Posted 03/02/2017Expression of CD274 in Human melanoma SK-MEL-28 cell line upon treatment with 200 mM ethanol. Dilution: 1:1,000 in PBS with 5% BSA. Secondary Ab: anti-Rabbit IgG 1:5,000.
-
Application: Immunohistochemistry-ParaffinSample Tested: transgenic mouse pancreas and Pancreatic cancer tissueSpecies: Mouse and HumanVerified Customer | Posted 01/18/2017
-
Application: Western BlotSample Tested: HCT-116 colon cancer cell line w/wo drug treatmentSpecies: HumanVerified Customer | Posted 11/09/2016I used Odyssey system for imaging, overall performance was ok, however a lot of non-specific bands show up, I didn’t know which band was real PD-L1. Very confusing result and very non-specific.I tested protein lording amount, 25, 30, and 50 ug to optimize the PD-L1 expression. Blocking buffer was Li-COR synthetic protein blocking buffer for 1 hr. The dilution of Primary antibody(PD-L1, NBP1-76769) were 1:500, 1:1000 and 1:2000 that I tested. Secondary antibody, Li-COR, IRdye 800CW goat anti-rabbit, 1:5000 dilution for 45 min.
There are no reviews that match your criteria.
Protocols
Find general support by application which include: protocols, troubleshooting, illustrated assays, videos and webinars.
- 7-Amino Actinomycin D (7-AAD) Cell Viability Flow Cytometry Protocol
- Antigen Retrieval Protocol (PIER)
- Antigen Retrieval for Frozen Sections Protocol
- Appropriate Fixation of IHC/ICC Samples
- Cellular Response to Hypoxia Protocols
- Chromogenic IHC Staining of Formalin-Fixed Paraffin-Embedded (FFPE) Tissue Protocol
- Chromogenic Immunohistochemistry Staining of Frozen Tissue
- ClariTSA™ Fluorophore Kits
- Detection & Visualization of Antibody Binding
- ELISA Sample Preparation & Collection Guide
- ELISA Troubleshooting Guide
- Extracellular Membrane Flow Cytometry Protocol
- Flow Cytometry Protocol for Cell Surface Markers
- Flow Cytometry Protocol for Staining Membrane Associated Proteins
- Flow Cytometry Staining Protocols
- Flow Cytometry Troubleshooting Guide
- Fluorescent IHC Staining of Frozen Tissue Protocol
- Graphic Protocol for Heat-induced Epitope Retrieval
- Graphic Protocol for the Preparation and Fluorescent IHC Staining of Frozen Tissue Sections
- Graphic Protocol for the Preparation and Fluorescent IHC Staining of Paraffin-embedded Tissue Sections
- Graphic Protocol for the Preparation of Gelatin-coated Slides for Histological Tissue Sections
- How to Run an R&D Systems DuoSet ELISA
- How to Run an R&D Systems Quantikine ELISA
- How to Run an R&D Systems Quantikine™ QuicKit™ ELISA
- ICC Cell Smear Protocol for Suspension Cells
- ICC Immunocytochemistry Protocol Videos
- ICC for Adherent Cells
- IHC Sample Preparation (Frozen sections vs Paraffin)
- ISH-IHC Protocol for Chromogenic Detection on Formalin Fixed Paraffin Embedded (FFPE) Tissue
- Immunocytochemistry (ICC) Protocol
- Immunocytochemistry Troubleshooting
- Immunofluorescence of Organoids Embedded in Cultrex Basement Membrane Extract
- Immunofluorescent IHC Staining of Formalin-Fixed Paraffin-Embedded (FFPE) Tissue Protocol
- Immunohistochemistry (IHC) and Immunocytochemistry (ICC) Protocols
- Immunohistochemistry Frozen Troubleshooting
- Immunohistochemistry Paraffin Troubleshooting
- Immunoprecipitation Protocol
- Intracellular Flow Cytometry Protocol Using Alcohol (Methanol)
- Intracellular Flow Cytometry Protocol Using Detergents
- Intracellular Nuclear Staining Flow Cytometry Protocol Using Detergents
- Intracellular Staining Flow Cytometry Protocol Using Alcohol Permeabilization
- Intracellular Staining Flow Cytometry Protocol Using Detergents to Permeabilize Cells
- Preparing Samples for IHC/ICC Experiments
- Preventing Non-Specific Staining (Non-Specific Binding)
- Primary Antibody Selection & Optimization
- Propidium Iodide Cell Viability Flow Cytometry Protocol
- Protocol for Heat-Induced Epitope Retrieval (HIER)
- Protocol for Liperfluo
- Protocol for Making a 4% Formaldehyde Solution in PBS
- Protocol for VisUCyte™ HRP Polymer Detection Reagent
- Protocol for the Characterization of Human Th22 Cells
- Protocol for the Characterization of Human Th9 Cells
- Protocol for the Fluorescent ICC Staining of Cell Smears - Graphic
- Protocol for the Fluorescent ICC Staining of Cultured Cells on Coverslips - Graphic
- Protocol for the Preparation & Fixation of Cells on Coverslips
- Protocol for the Preparation and Chromogenic IHC Staining of Frozen Tissue Sections
- Protocol for the Preparation and Chromogenic IHC Staining of Frozen Tissue Sections - Graphic
- Protocol for the Preparation and Chromogenic IHC Staining of Paraffin-embedded Tissue Sections
- Protocol for the Preparation and Chromogenic IHC Staining of Paraffin-embedded Tissue Sections - Graphic
- Protocol for the Preparation and Fluorescent ICC Staining of Cells on Coverslips
- Protocol for the Preparation and Fluorescent ICC Staining of Non-adherent Cells
- Protocol for the Preparation and Fluorescent ICC Staining of Stem Cells on Coverslips
- Protocol for the Preparation and Fluorescent IHC Staining of Frozen Tissue Sections
- Protocol for the Preparation and Fluorescent IHC Staining of Paraffin-embedded Tissue Sections
- Protocol for the Preparation of Gelatin-coated Slides for Histological Tissue Sections
- Protocol for the Preparation of a Cell Smear for Non-adherent Cell ICC - Graphic
- Protocol: Annexin V and PI Staining by Flow Cytometry
- Protocol: Annexin V and PI Staining for Apoptosis by Flow Cytometry
- Quantikine HS ELISA Kit Assay Principle, Alkaline Phosphatase
- Quantikine HS ELISA Kit Principle, Streptavidin-HRP Polymer
- R&D Systems Quality Control Western Blot Protocol
- Sandwich ELISA (Colorimetric) – Biotin/Streptavidin Detection Protocol
- Sandwich ELISA (Colorimetric) – Direct Detection Protocol
- TUNEL and Active Caspase-3 Detection by IHC/ICC Protocol
- The Importance of IHC/ICC Controls
- Troubleshooting Guide: ELISA
- Troubleshooting Guide: Fluorokine Flow Cytometry Kits
- Troubleshooting Guide: Immunohistochemistry
- Troubleshooting Guide: Western Blot Figures
- Western Blot Conditions
- Western Blot Protocol
- Western Blot Protocol for Cell Lysates
- Western Blot Troubleshooting
- Western Blot Troubleshooting Guide
- View all Protocols, Troubleshooting, Illustrated assays and Webinars
FAQs for PD-L1 Antibody - BSA Free
Showing
1
-
1 of
1 FAQ
Showing All
-
Q: What can I use as positive controls for B7-H1 (NBP1-76769) other than the myocardial tissue?
A: For CD274 (B7-H1), this protein is highly expressed in the heart, skeletal muscle, placenta and lung ( uniprot site). It can also be found at lower levels in other tissues as well: protein atlas site.
Loading...