
alpha ‑Smooth Muscle Actin has been frequently used as a marker of smooth muscle differentiation (1, 2).
alpha-Smooth Muscle Actin Antibody (1A4)
R&D Systems | Catalog # MAB1420

Scientific images may be resized, cropped, or adjusted for brightness or contrast for presentation purposes. These updates are limited to presentation and do not affect the underlying scientific interpretation of the data. Where available, additional source data may be provided upon request.
Key Product Details
Validated by
Orthogonal Validation
Species Reactivity
Validated:
Human, Mouse, Rat
Cited:
Human, Mouse, Rat, Bovine, Canine, Primate - Macaca mulatta (Rhesus Macaque), Primate - Papio anubis (Olive Baboon), Rabbit, Transgenic Mouse
Applications
Validated:
Immunohistochemistry, Western Blot, Intracellular Staining by Flow Cytometry, Dual RNAscope ISH-IHC Compatible, Immunocytochemistry, Simple Western, COMET, CyTOF-ready
Cited:
Immunohistochemistry, Immunohistochemistry-Paraffin, Immunohistochemistry-Frozen, Western Blot, Neutralization, Flow Cytometry, Immunocytochemistry, Immunocytochemistry/ Immunofluorescence, CyTof
Label
Unconjugated
Antibody Source
Monoclonal Mouse IgG2A Clone # 1A4
Loading...
Product Specifications
Immunogen
Peptide corresponding to
residues EEEDSTALVC of the N-term of human alpha -smooth muscle actin (1)
Specificity
Detects human alpha -Smooth Muscle Actin.
Clonality
Monoclonal
Host
Mouse
Isotype
IgG2A
Scientific Data Images for alpha-Smooth Muscle Actin Antibody (1A4)
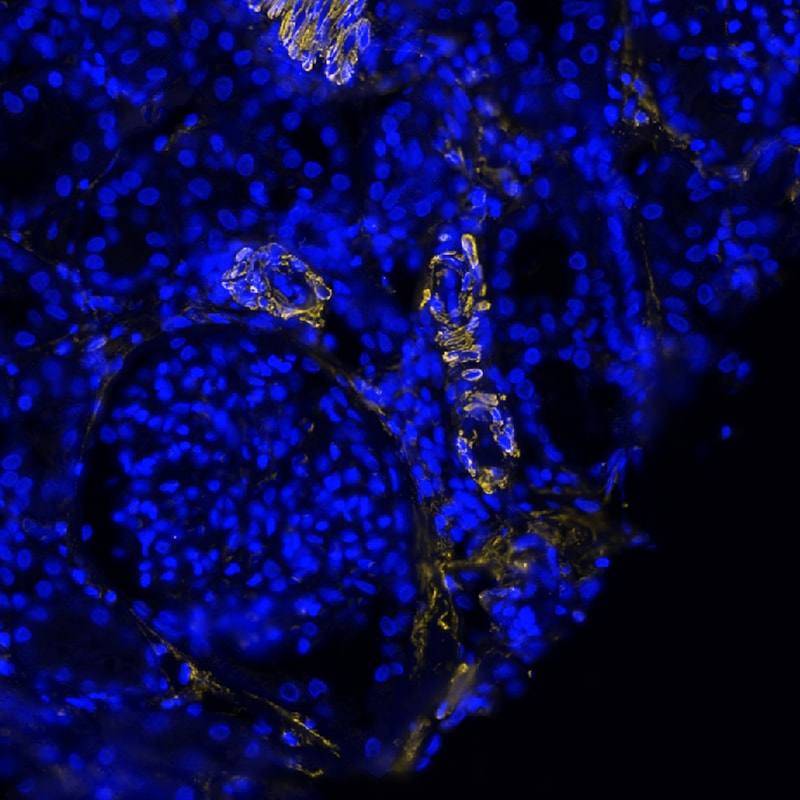
Detection of alpha-Smooth Muscle Actin inHuman Kidney via seqIF™ Staining onCOMET™
ACTA2 was detected in immersion fixed paraffin-embedded sections of human kidney using Mouse Anti-Human/Mouse/Rat alpha-Smooth Muscle Actin Monoclonal Antibody (Catalog # MAB1420) at 0.5ug/mL at 37° Celsius for 4 minutes. Before incubation with the primary antibody, tissue underwent an all-in-one dewaxing and antigen retrieval preprocessing using PreTreatment Module (PT Module) and Dewax and HIER Buffer H (pH 9; Epredia Catalog # TA-999-DHBH). Tissue was stained using the Alexa Fluor™ 555 Goat anti-Mouse IgG Secondary Antibody at 1:100 at 37 ° Celsius for 2 minutes. (Yellow; Lunaphore Catalog # DR555MS) and counterstained with DAPI (blue; Lunaphore Catalog # DR100). Specific staining was localized to the cytoplasm of smooth muscle cells. Protocol available in COMET™ Panel Builder.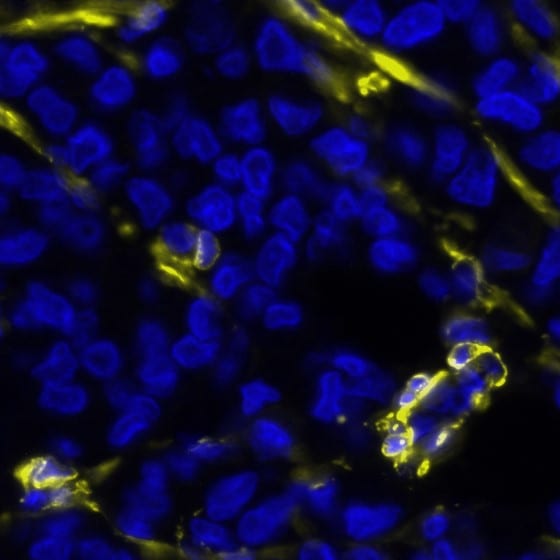
Detection of alpha-Smooth Muscle Actin in Human Breast Tumor via seqIF™ Staining on COMET™
ACTA2 was detected in immersion fixed paraffin-embedded sections of human breast tumor using Mouse Anti-Human/Mouse/Rat alpha-Smooth Muscle Actin Monoclonal Antibody (Catalog # MAB1420) at 0.5ug/mL at 37° Celsius for 4 minutes. Before incubation with the primary antibody, tissue underwent an all-in-one dewaxing and antigen retrieval preprocessing using PreTreatment Module (PT Module) and Dewax and HIER Buffer H (pH 9; Epredia Catalog # TA-999-DHBH). Tissue was stained using the Alexa Fluor™ 555 Goat anti-Mouse IgG Secondary Antibody at 1:100 at 37 ° Celsius for 2 minutes. (Yellow; Lunaphore Catalog # DR555MS) and counterstained with DAPI (blue; Lunaphore Catalog # DR100).. Specific staining was localized to the cytoplasm of smooth muscle cells. Protocol available in available in COMET™ Panel Builder.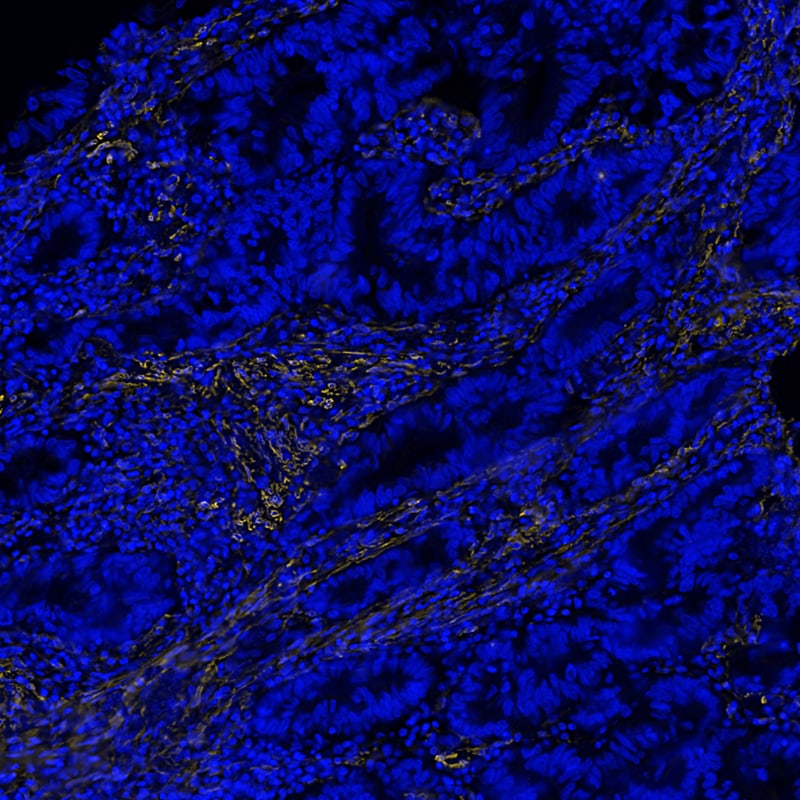
Detection of alpha-Smooth Muscle Actin inHuman Colon Tumor via seqIF™ Staining onCOMET™
ACTA2 was detected in immersion fixed paraffin-embedded sections of human colon tumor using Mouse Anti-Human/Mouse/Rat alpha-Smooth Muscle Actin Monoclonal Antibody (Catalog # MAB1420) at 0.5ug/mL at 37° Celsius for 4 minutes. Before incubation with the primary antibody, tissue underwent an all-in-one dewaxing and antigen retrieval preprocessing using PreTreatment Module (PT Module) and Dewax and HIER Buffer H (pH 9; Epredia Catalog # TA-999-DHBH). Tissue was stained using the Alexa Fluor™ 555 Goat anti-Mouse IgG Secondary Antibody at 1:100 at 37 ° Celsius for 2 minutes. (Yellow; Lunaphore Catalog # DR555MS) and counterstained with DAPI (blue; Lunaphore Catalog # DR100). Specific staining was localized to the cytoplasm of smooth muscle cells. Protocol available in COMET™ Panel Builder.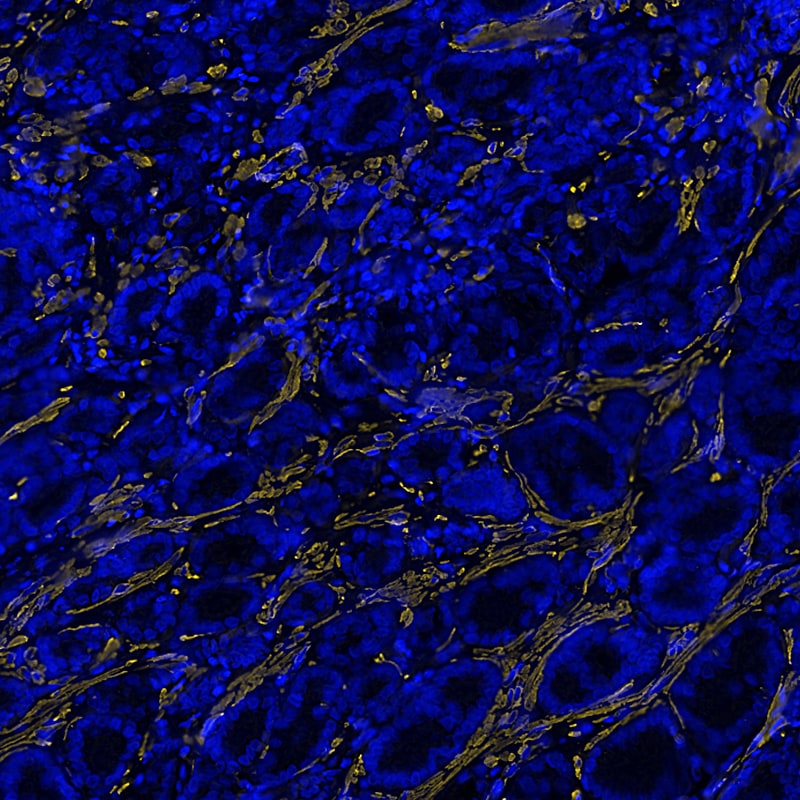
Detection of alpha-Smooth Muscle Actin inHuman Prostate Tumor via seqIF™ Stainingon COMET™
ACTA2 was detected in immersion fixed paraffin-embedded sections of human prostate tumor using Mouse Anti-Human/Mouse/Rat alpha-Smooth Muscle Actin Monoclonal Antibody (Catalog # MAB1420) at 0.5ug/mL at 37° Celsius for 4 minutes. Before incubation with the primary antibody, tissue underwent an all-in-one dewaxing and antigen retrieval preprocessing using PreTreatment Module (PT Module) and Dewax and HIER Buffer H (pH 9; Epredia Catalog # TA-999-DHBH). Tissue was stained using the Alexa Fluor™ 555 Goat anti-Mouse IgG Secondary Antibody at 1:100 at 37 ° Celsius for 2 minutes. (Yellow; Lunaphore Catalog # DR555MS) and counterstained with DAPI (blue; Lunaphore Catalog # DR100). Specific staining was localized to the cytoplasm of smooth muscle cells. Protocol available in COMET™ Panel Builder.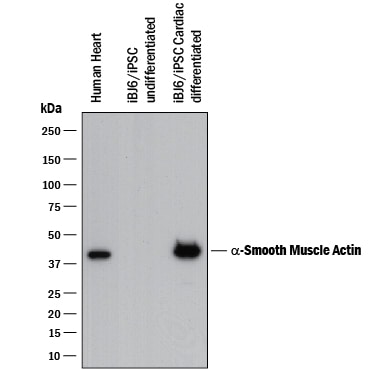
Detection of Human alpha ‑Smooth Muscle Actin by Western Blot.
Western blot shows lysates of human heart tissue and iBJ6 human induced pluripotent stem cell line undifferentiated or cardiac differentiated. PVDF membrane was probed with 0.25 µg/mL of Mouse Anti-Human/ Mouse/Rat a-Smooth Muscle Actin Monoclonal Antibody (Catalog # MAB1420) followed by HRP-conjugated Anti-Mouse IgG Secondary Antibody (HAF018). A specific band was detected for a-Smooth Muscle Actin at approximately 40 kDa (as indicated). This experiment was conducted under reducing conditions and using Immunoblot Buffer Group 1.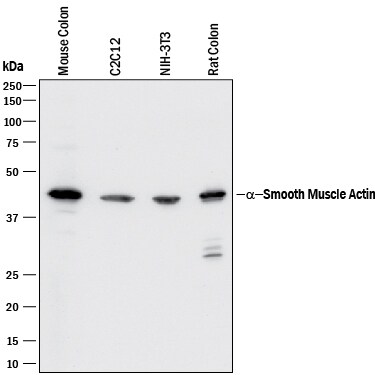
Detection of Mouse and Rat alpha ‑Smooth Muscle Actin by Western Blot.
Western blot shows lysates of mouse colon tissue, C2C12 mouse myoblast cell line, NIH-3T3 mouse embryonic fibroblast cell line, and rat colon tissue. PVDF membrane was probed with 0.1 µg/mL of Mouse Anti-Human/Mouse/Rat a-Smooth Muscle Actin Monoclonal Antibody (Catalog # MAB1420) followed by HRP-conjugated Anti-Mouse IgG Secondary Antibody (HAF018). A specific band was detected for a-Smooth Muscle Actin at approximately 42 kDa (as indicated). This experiment was conducted under reducing conditions and using Immunoblot Buffer Group 1.
alpha ‑Smooth Muscle Actin in BG01V Human Embryonic Stem Cells.
a-Smooth Muscle Actin was detected in immersion fixed BG01V human embryonic stem cells differentiated to cardiomyocytes using Mouse Anti-Human/Mouse/ Rat a-Smooth Muscle Actin Monoclonal Antibody (Catalog # MAB1420) at 10 µg/mL for 3 hours at room temperature. Cells were stained using the NorthernLights™ 557-conjugated Anti-Mouse IgG Secondary Antibody (red; NL007) and counterstained with DAPI (blue). Specific staining was localized to cytoplasm and cytoskeleton. View our protocol for Fluorescent ICC Staining of Cells on Coverslips.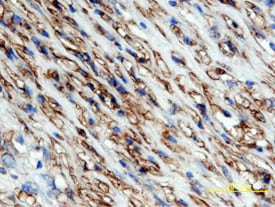
alpha -Smooth Muscle Actin in Human Breast Cancer Tissue.
a-Smooth Muscle Actin was detected in immersion fixed paraffin-embedded sections of human breast cancer tissue using Mouse Anti-Human/ Mouse/Rat a-Smooth Muscle Actin Monoclonal Antibody (Catalog # MAB1420) at 8 µg/mL overnight at 4 °C. Tissue was stained using the Anti-Mouse HRP-DAB Cell & Tissue Staining Kit (brown; CTS002) and counterstained with hematoxylin (blue). View our protocol for Chromogenic IHC Staining of Paraffin-embedded Tissue Sections.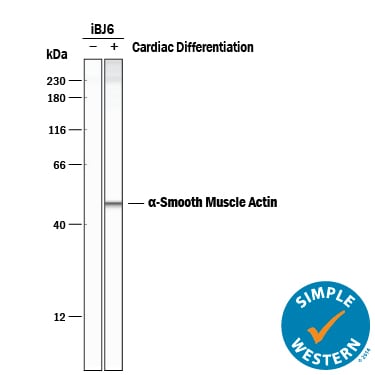
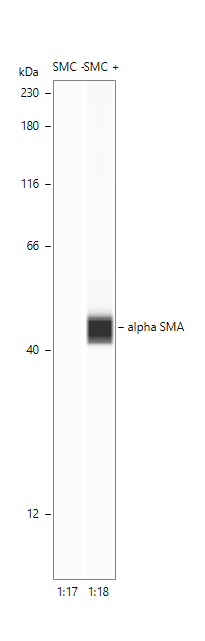
Detection of Human alpha ‑Smooth Muscle Actin by Simple WesternTM.
Simple Western lane view shows lysates of iBJ6 human induced pluripotent stem cell line untreated (-) or differentiated to cardiomyocytes (+), loaded at 0.2 mg/mL. A specific band was detected for alpha ‑Smooth Muscle Actin at approximately 49 kDa (as indicated) using 10 µg/mL of Mouse Anti-Human/Mouse/Rat alpha ‑Smooth Muscle Actin Monoclonal Antibody (Catalog # MAB1420). This experiment was conducted under reducing conditions and using the 12-230 kDa separation system.
alpha-Smooth Muscle Actin in Human Breast Cancer Tissue Using Dual RNAscope®ISH and IHC.
alpha-Smooth Muscle Actin mRNA was detected (top image) in formalin-fixed paraffin-embedded tissue sections of human breast cancer tissue probed with ACD RNAScope® Probe (Catalog # 444771-C2) and stained using ACD RNAscope® 2.5 HD Duplex Detection Reagents (red, Catalog # 322500). Adjacent tissue section (bottom image) was processed for immunohistochemistry using R&D Systems Mouse Anti-Human/Mouse/Rat alpha-Smooth Muscle Actin Monoclonal Antibody (Catalog # MAB1420) at 0.5 μg/mL for 1 hour at room temperature followed by incubation with the Anti-Mouse IgG VisUCyte HRP Polymer Antibody (VC001) and DAB chromogen (brown). Tissues were counterstained with hematoxylin (blue).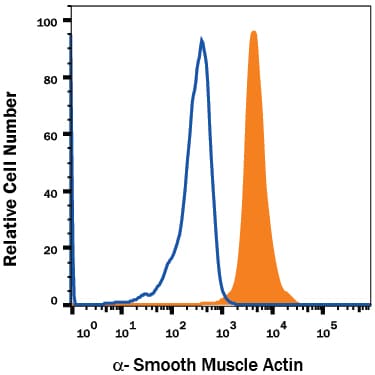
Detection of alpha ‑Smooth Muscle Actin in Human Blood Monocytes by Flow Cytometry.
Human peripheral blood monocytes were stained with Mouse Anti-Human/Mouse/Rat a-Smooth Muscle Actin Monoclonal Antibody (Catalog # MAB1420, filled histogram) or isotype control antibody (MAB003, open histogram), followed by Allophycocyanin-conjugated Anti-Mouse IgG Secondary Antibody (F0101B). To facilitate intracellular staining, cells were fixed with Flow Cytometry Fixation Buffer (FC004) and permeabilized with Flow Cytometry Permeabilization/Wash Buffer I (Catalog # FC005). View our protocol for Staining Intracellular Molecules.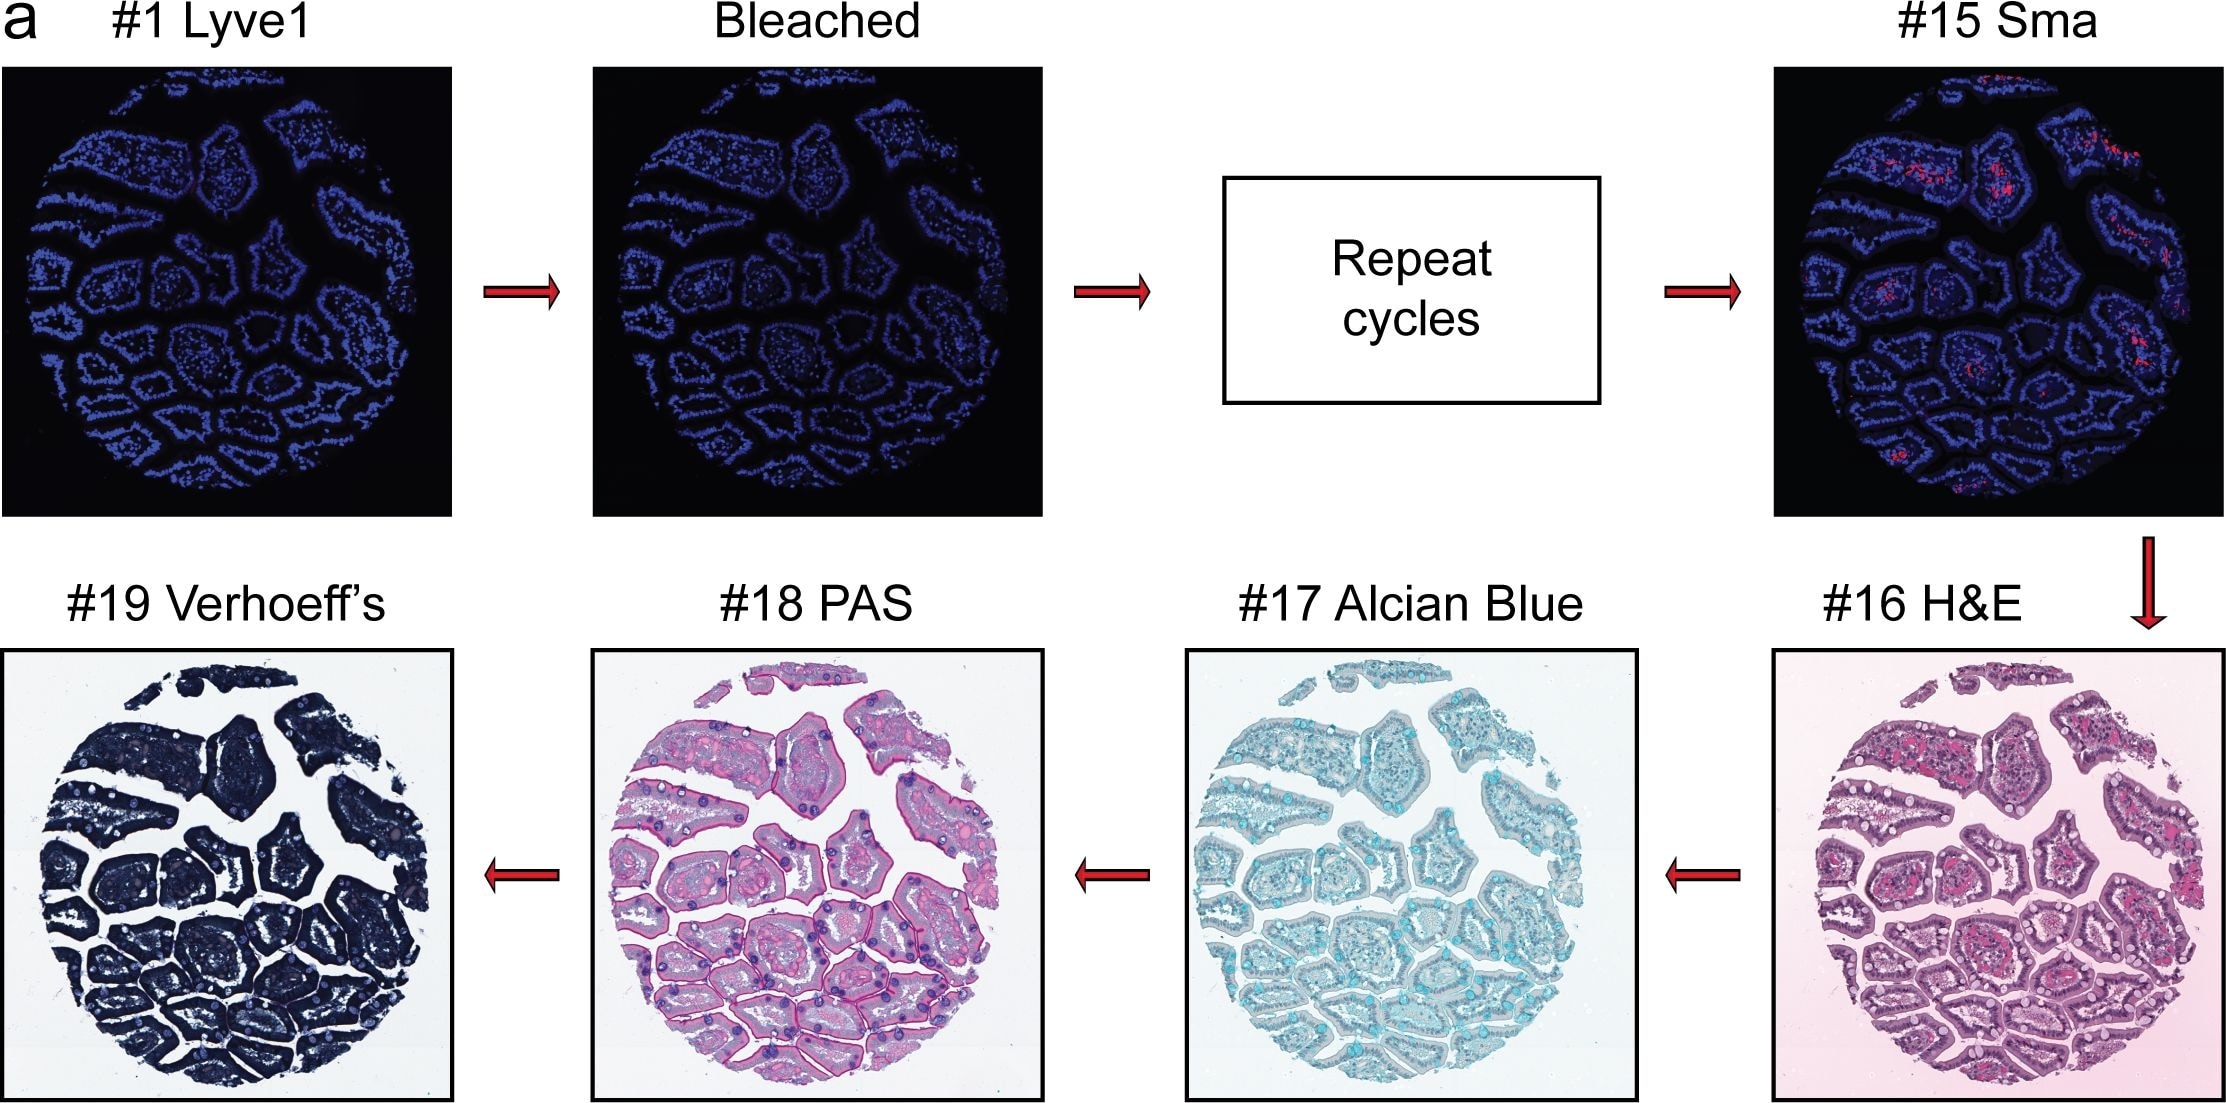
Detection of Human alpha-Smooth Muscle Actin by Immunocytochemistry/Immunofluorescence
Overview of Multi-dimensional Microscopic Molecular Profiling (MMMP).The overall MMMP approach is depicted using an example tissue section from normal human duodenum (sample #1.9.7). (a) Slides were subjected to repeated cycles of staining and imaging with fluorescent primary antibodies and DAPI. At the end of each cycle, fluorescent signal was removed by a chemical bleaching process, and slides were again imaged, before proceeding to the next round of this iterative procedure. After the final antibody stain (#15 Sma), slides were analyzed with a series of histochemical stains. (b) A set of tiling images spanning each tissue section was initially generated by the microscope system. The tiling images were then computationally ‘stitched’ together to produce a single image per staining cycle for each sample. (c) Image registration was performed to align images from the same tissue section across cycles. Mean intensities of the DAPI signal from all immuno-fluorescence images are shown from before (Unregistered) and after (Registered) the image registration procedure was completed. (d) Following registration, signal intensities from the relevant channels for each image (columns) in the MMMP series were extracted for each pixel (rows) within the tissue section and compiled into a large data matrix of in situ molecular profiles. Image collected and cropped by CiteAb from the following publication (https://dx.plos.org/10.1371/journal.pone.0128975), licensed under a CC-BY license. Not internally tested by R&D Systems.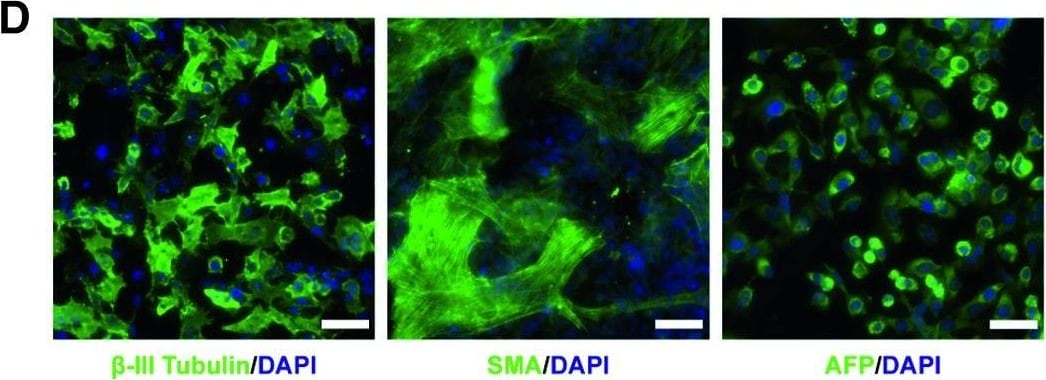
Detection of Human alpha-Smooth Muscle Actin by Immunocytochemistry/Immunofluorescence
Functional glycosylation of alpha ‐dystroglycan and characterization of dystroglycanopathy patient‐specific iPSCsCurrent model of the core M3 functional glycan structure on alpha ‐dystroglycan and enzymes involved in its synthesis. ECM ligands, such as laminins, bind to the Xyl‐GlucA disaccharide repeats (IIH6 epitope). Man, mannose; GlcNAc, N‐acetylglucosamine; GalNAc, N‐acetylgalactosamine; Rbo5P, ribitol‐5‐phosphate; Xyl, xylose; GlcA, glucuronic acid.Representative images of immunostaining demonstrate that FKRP‐iPSCs express specific pluripotency‐associated markers, including NANOG, OCT4, Tra‐1‐60, and SSEA4.FKRP‐iPSCs have a normal karyotype.In vitro differentiation of FKRP‐iPSCs to cells representing ectoderm ( beta ‐III Tubulin, Tuj1), mesoderm (SMA, smooth muscle actin), and endoderm (AFP, alpha ‐fetoprotein).Data information: Scale bars, 50 μm. Image collected and cropped by CiteAb from the following publication (https://pubmed.ncbi.nlm.nih.gov/31566294), licensed under a CC-BY license. Not internally tested by R&D Systems.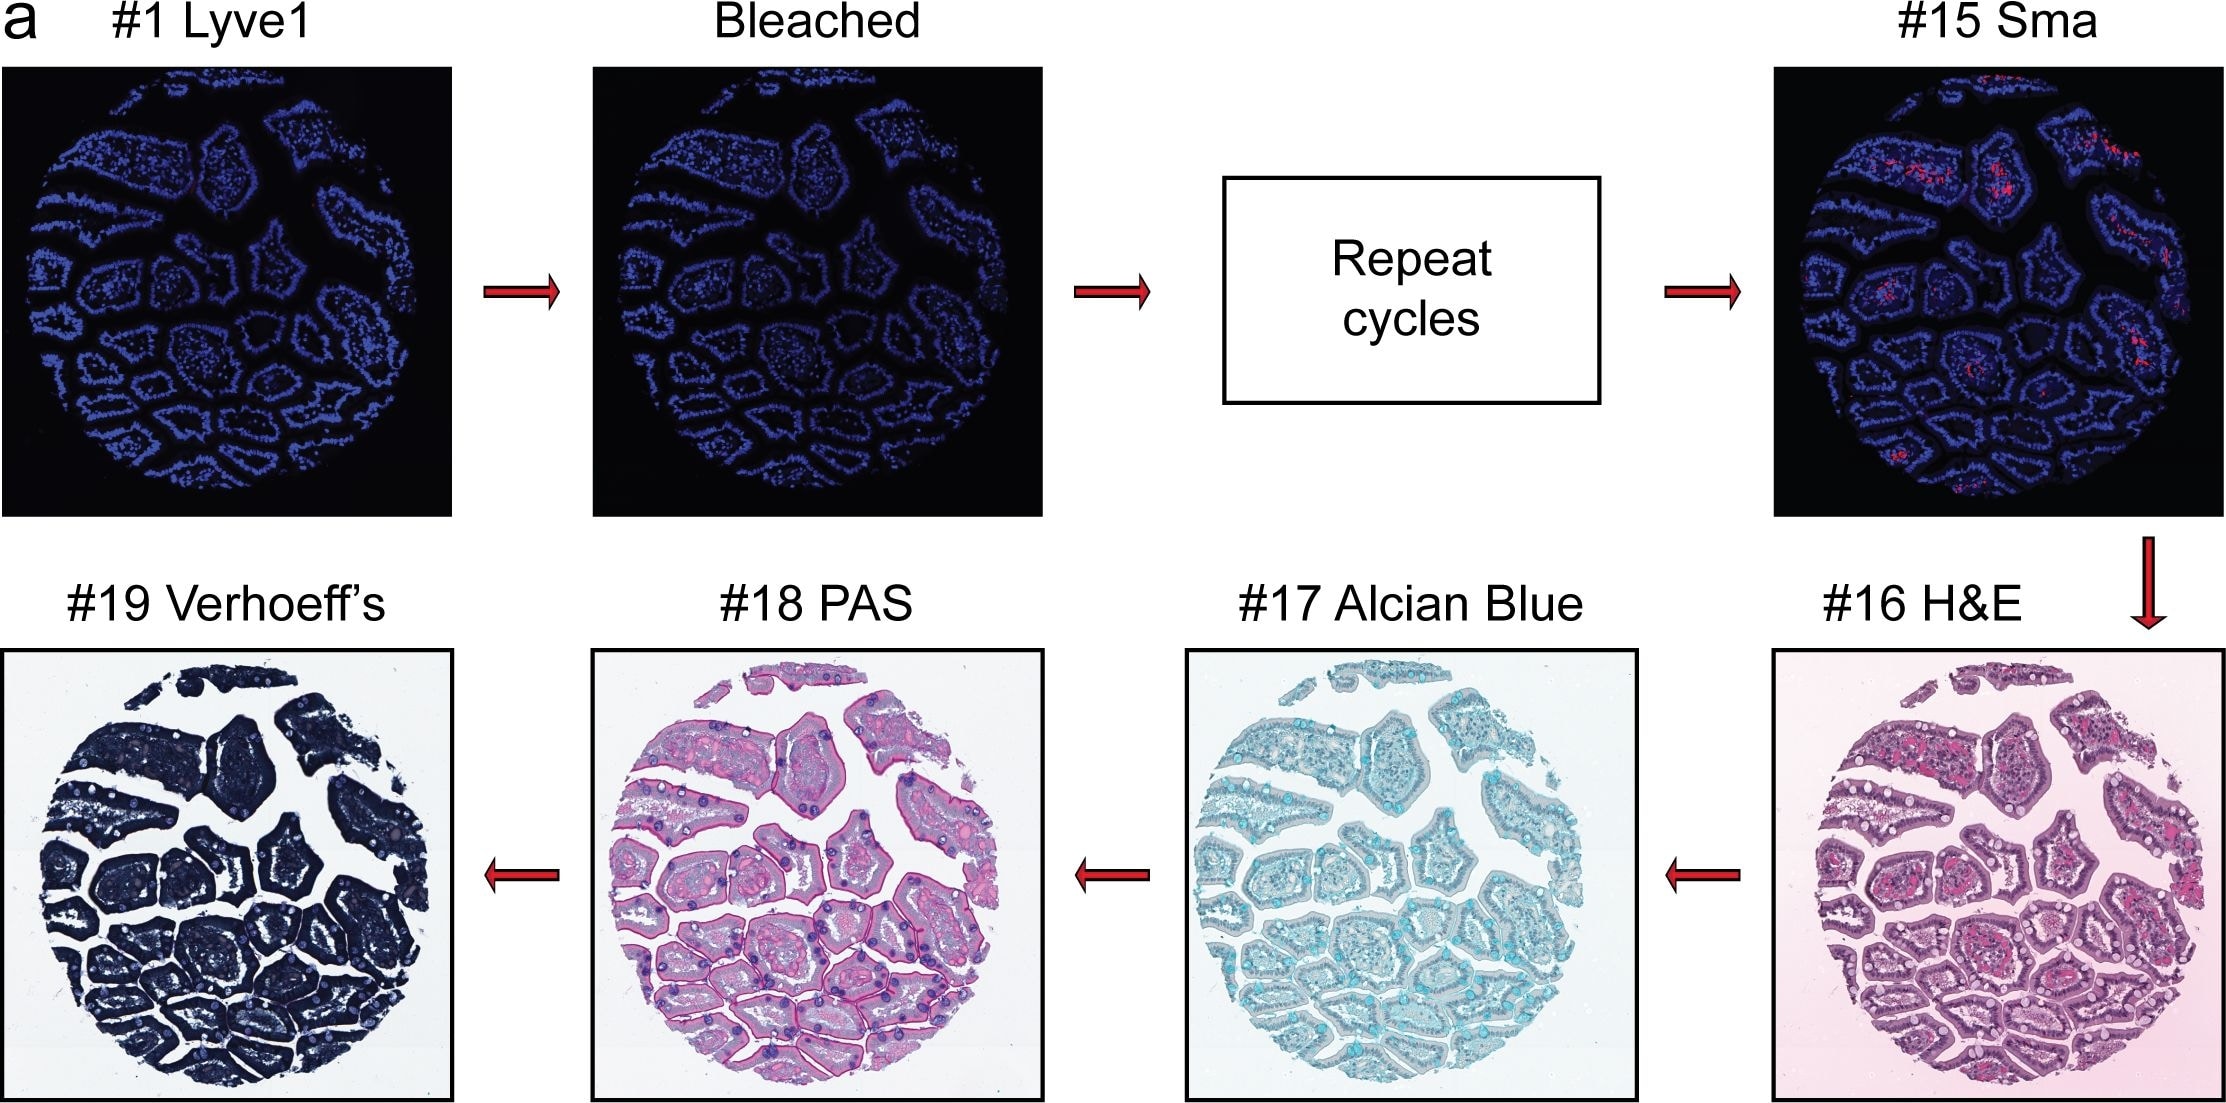
Detection of Human Human/Mouse/Rat alpha-Smooth Muscle Actin Antibody by Immunohistochemistry
Overview of Multi-dimensional Microscopic Molecular Profiling (MMMP).The overall MMMP approach is depicted using an example tissue section from normal human duodenum (sample #1.9.7). (a) Slides were subjected to repeated cycles of staining and imaging with fluorescent primary antibodies and DAPI. At the end of each cycle, fluorescent signal was removed by a chemical bleaching process, and slides were again imaged, before proceeding to the next round of this iterative procedure. After the final antibody stain (#15 Sma), slides were analyzed with a series of histochemical stains. (b) A set of tiling images spanning each tissue section was initially generated by the microscope system. The tiling images were then computationally ‘stitched’ together to produce a single image per staining cycle for each sample. (c) Image registration was performed to align images from the same tissue section across cycles. Mean intensities of the DAPI signal from all immuno-fluorescence images are shown from before (Unregistered) and after (Registered) the image registration procedure was completed. (d) Following registration, signal intensities from the relevant channels for each image (columns) in the MMMP series were extracted for each pixel (rows) within the tissue section and compiled into a large data matrix of in situ molecular profiles. Image collected and cropped by CiteAb from the following publication (https://pubmed.ncbi.nlm.nih.gov/26176839), licensed under a CC-BY license. Not internally tested by R&D Systems.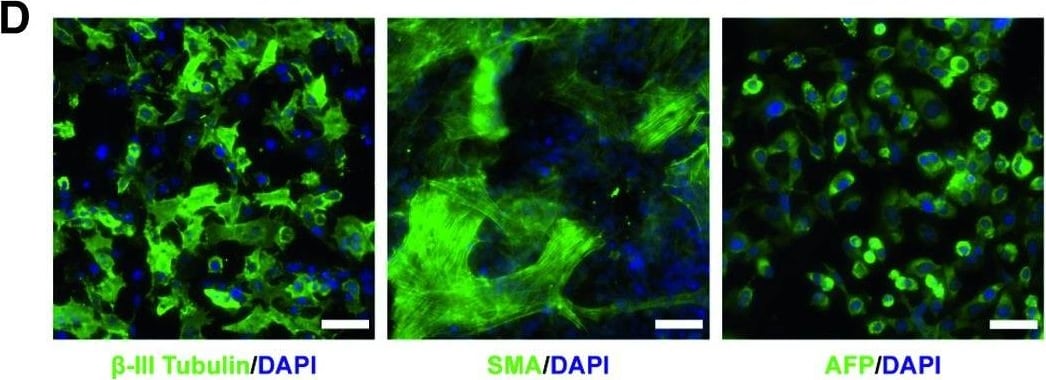
Detection of Human Human/Mouse/Rat alpha-Smooth Muscle Actin Antibody by Immunocytochemistry/ Immunofluorescence
Functional glycosylation of alpha ‐dystroglycan and characterization of dystroglycanopathy patient‐specific iPSCsCurrent model of the core M3 functional glycan structure on alpha ‐dystroglycan and enzymes involved in its synthesis. ECM ligands, such as laminins, bind to the Xyl‐GlucA disaccharide repeats (IIH6 epitope). Man, mannose; GlcNAc, N‐acetylglucosamine; GalNAc, N‐acetylgalactosamine; Rbo5P, ribitol‐5‐phosphate; Xyl, xylose; GlcA, glucuronic acid.Representative images of immunostaining demonstrate that FKRP‐iPSCs express specific pluripotency‐associated markers, including NANOG, OCT4, Tra‐1‐60, and SSEA4.FKRP‐iPSCs have a normal karyotype.In vitro differentiation of FKRP‐iPSCs to cells representing ectoderm ( beta ‐III Tubulin, Tuj1), mesoderm (SMA, smooth muscle actin), and endoderm (AFP, alpha ‐fetoprotein).Data information: Scale bars, 50 μm. Image collected and cropped by CiteAb from the following publication (https://pubmed.ncbi.nlm.nih.gov/31566294), licensed under a CC-BY license. Not internally tested by R&D Systems.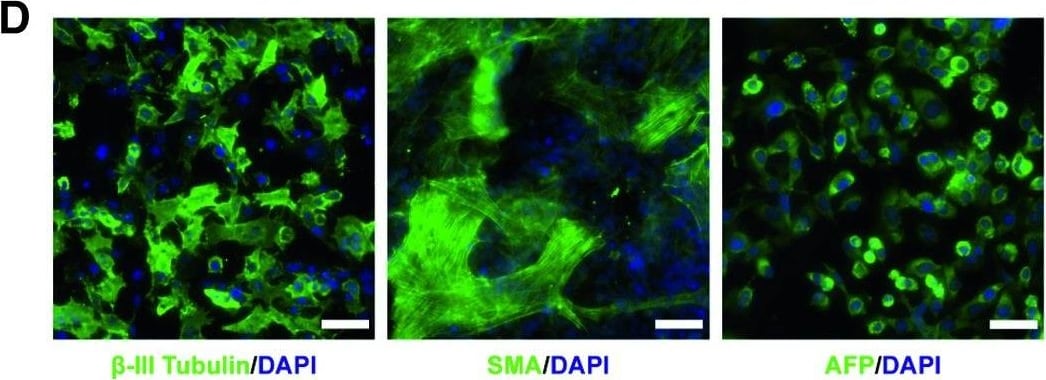
Detection of Human alpha-Smooth Muscle Actin by Immunocytochemistry/ Immunofluorescence
Functional glycosylation of alpha ‐dystroglycan and characterization of dystroglycanopathy patient‐specific iPSCsCurrent model of the core M3 functional glycan structure on alpha ‐dystroglycan and enzymes involved in its synthesis. ECM ligands, such as laminins, bind to the Xyl‐GlucA disaccharide repeats (IIH6 epitope). Man, mannose; GlcNAc, N‐acetylglucosamine; GalNAc, N‐acetylgalactosamine; Rbo5P, ribitol‐5‐phosphate; Xyl, xylose; GlcA, glucuronic acid.Representative images of immunostaining demonstrate that FKRP‐iPSCs express specific pluripotency‐associated markers, including NANOG, OCT4, Tra‐1‐60, and SSEA4.FKRP‐iPSCs have a normal karyotype.In vitro differentiation of FKRP‐iPSCs to cells representing ectoderm ( beta ‐III Tubulin, Tuj1), mesoderm (SMA, smooth muscle actin), and endoderm (AFP, alpha ‐fetoprotein).Data information: Scale bars, 50 μm. Image collected and cropped by CiteAb from the following open publication (https://pubmed.ncbi.nlm.nih.gov/31566294), licensed under a CC-BY license. Not internally tested by R&D Systems.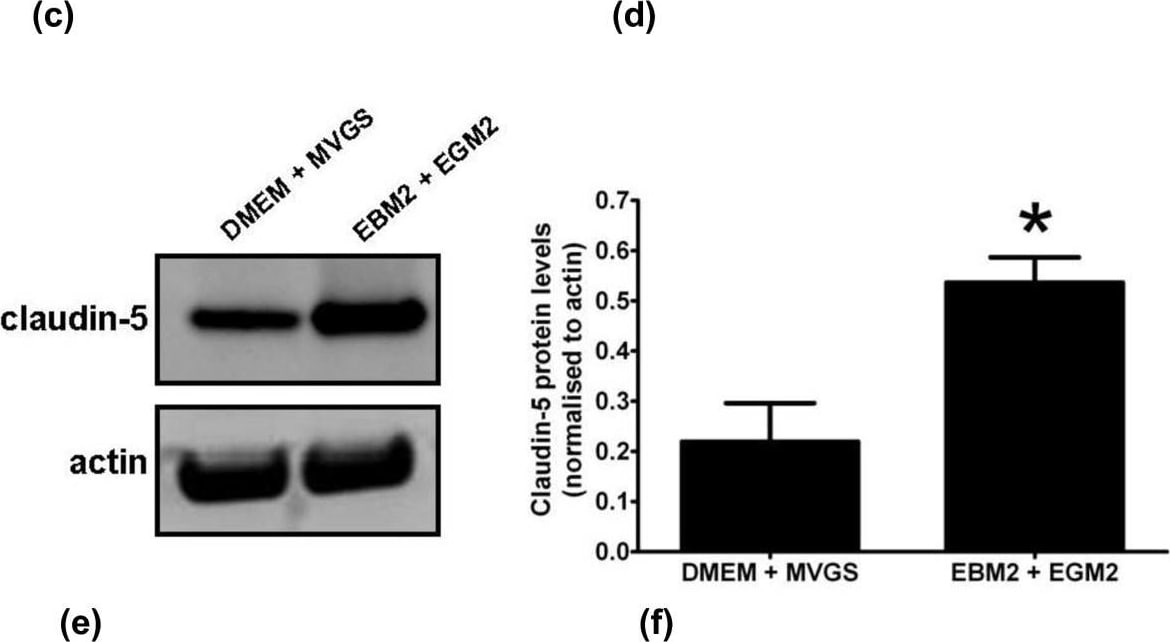
Detection of Rat alpha-Smooth Muscle Actin by Western Blot
Effect of media composition on RBEC barrier formation&characteristics. (a) Comparison of the effects of the DMEM/MVGS&EBM-2/EGM-2 media formulations on the TEER of RBECs grown for 14 days on cell culture inserts. Data is presented as mean ± SEM&was analysed using an unpaired, two-tailed students t-test, ***P < 0.0001; n = 5 independent cell culture experiments in 24-well plates, with 3 inserts per experiment, equivalent to 15 inserts total. (b) Calculated permeability coefficients for the paracellular passage of 100 μM (50 μg/mL) Lucifer yellow over a 90 minute period at 37°C across RBEC monolayers on cell culture inserts cultured in DMEM/MVGS&EBM-2/EGM-2 media formulations. Data is presented as mean ± SEM&was analysed using an unpaired, two-tailed students t-test, ***P < 0.0001; n = 5 independent cell culture experiments, with 3 inserts per experiment, equivalent to 15 inserts total. Fluorescence microscope images of RBECs stained with an antibody raised against the tight junction protein claudin-5 following culture in (c) DMEM/MVGS supplement, or (d) EBM-2/EGM-2. White arrows indicate regions of discontinuous claudin-5 staining. Images are representative of 3 independent cultures, with five fields of view taken from each individual preparation of cells using the 20× objective on an Olympus IX81 microscope. (e) WB analysis of claudin-5 protein expression levels in RBECs cultured in DMEM/MVGS&EBM-2/EGM-2. Blots reprobed with anti-actin antibodies as a control for equal loading of cell lysates. (f) Densitometry analysis of claudin-5 band intensity, normalised to actin levels, for RBECs grown in DMEM/MVGS vs. EBM-2/EGM-2. Data is presented as mean ± SEM&was analysed using an unpaired, two-tailed students t-test, *P < 0.01; n = 3 independent experiments. Image collected&cropped by CiteAb from the following open publication (https://pubmed.ncbi.nlm.nih.gov/23773766), licensed under a CC-BY license. Not internally tested by R&D Systems.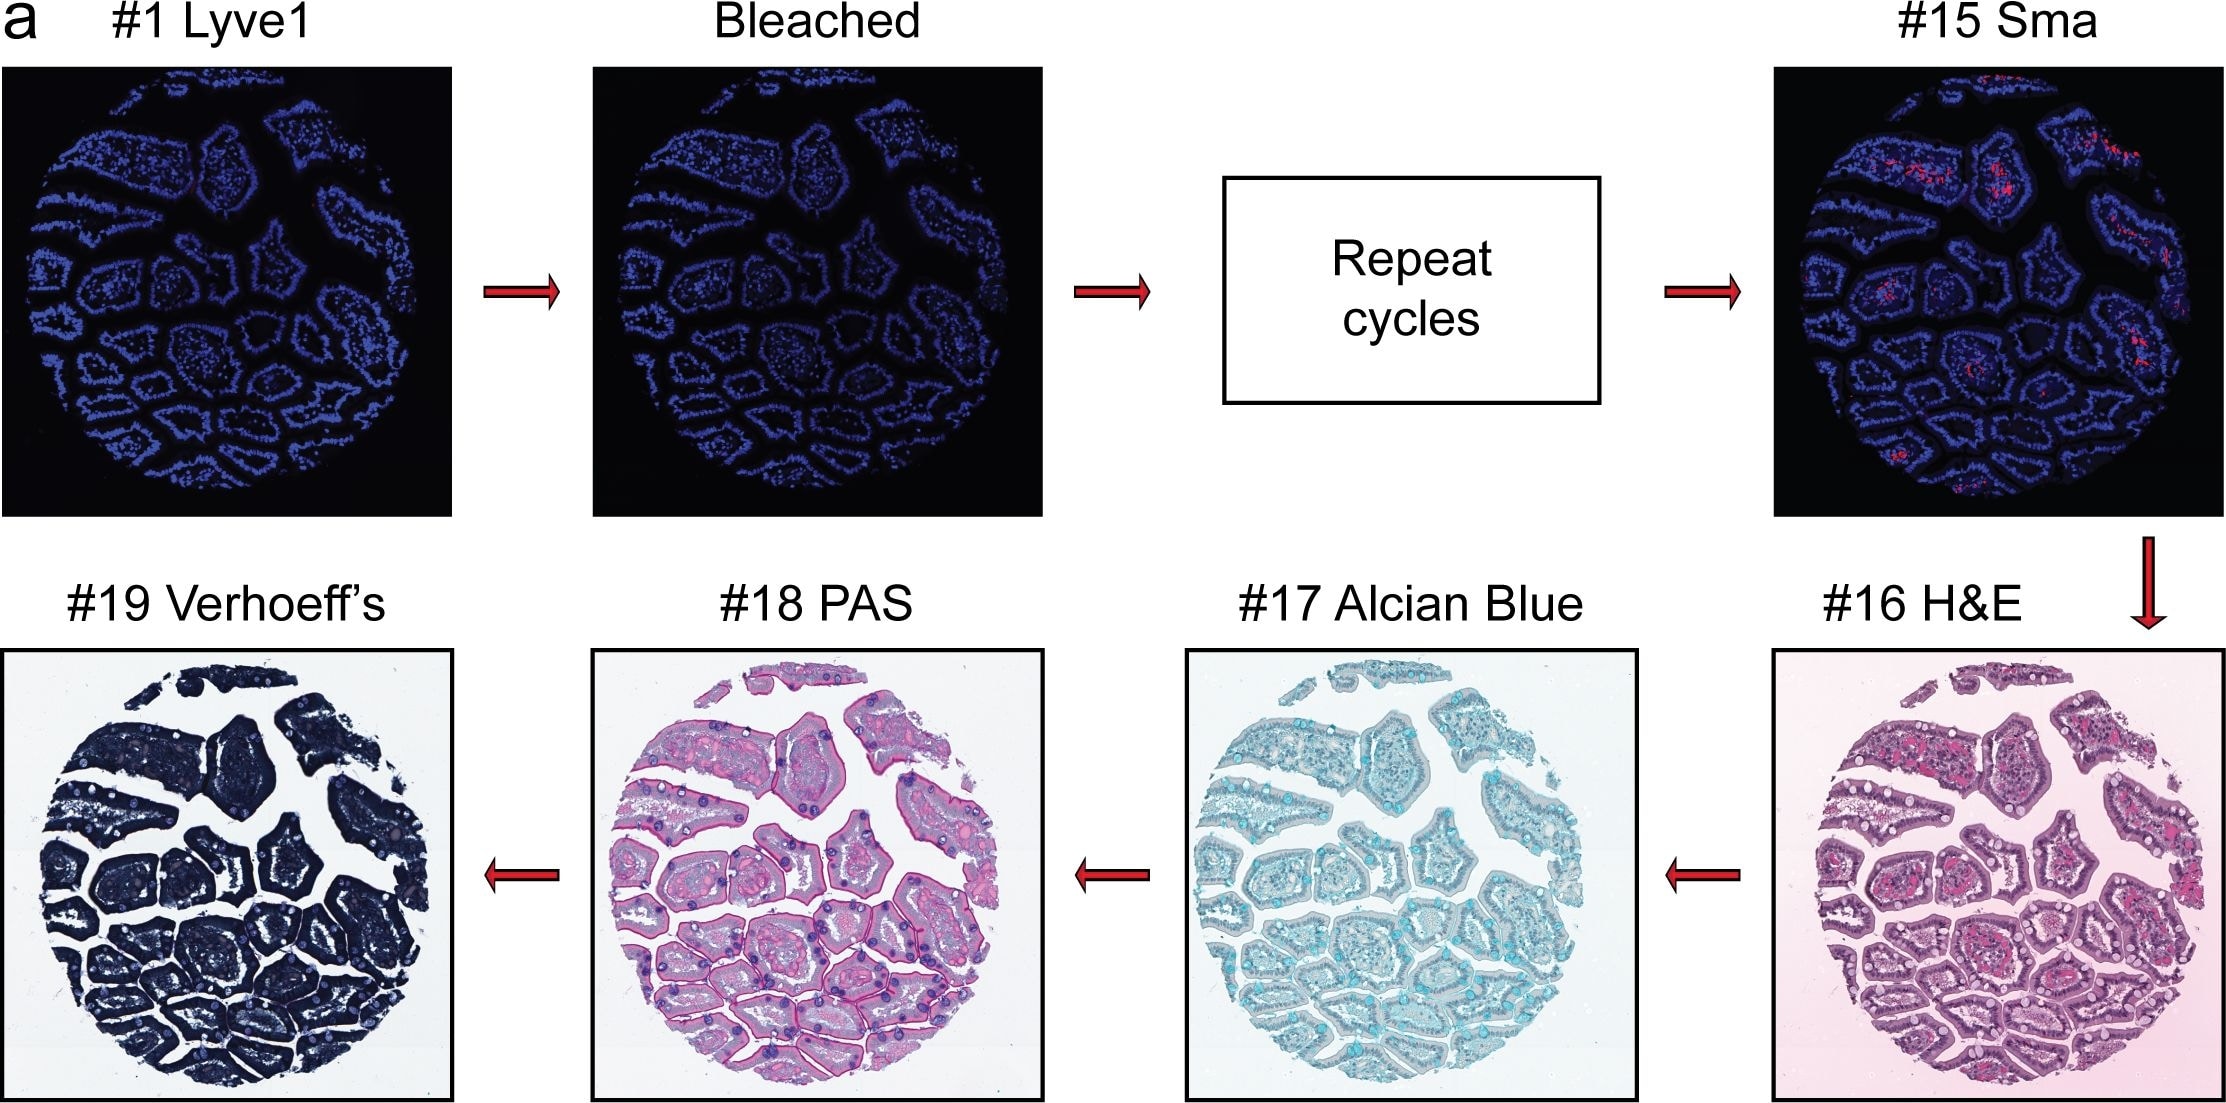
Detection of Human alpha-Smooth Muscle Actin by Immunohistochemistry
Overview of Multi-dimensional Microscopic Molecular Profiling (MMMP).The overall MMMP approach is depicted using an example tissue section from normal human duodenum (sample #1.9.7). (a) Slides were subjected to repeated cycles of staining and imaging with fluorescent primary antibodies and DAPI. At the end of each cycle, fluorescent signal was removed by a chemical bleaching process, and slides were again imaged, before proceeding to the next round of this iterative procedure. After the final antibody stain (#15 Sma), slides were analyzed with a series of histochemical stains. (b) A set of tiling images spanning each tissue section was initially generated by the microscope system. The tiling images were then computationally ‘stitched’ together to produce a single image per staining cycle for each sample. (c) Image registration was performed to align images from the same tissue section across cycles. Mean intensities of the DAPI signal from all immuno-fluorescence images are shown from before (Unregistered) and after (Registered) the image registration procedure was completed. (d) Following registration, signal intensities from the relevant channels for each image (columns) in the MMMP series were extracted for each pixel (rows) within the tissue section and compiled into a large data matrix of in situ molecular profiles. Image collected and cropped by CiteAb from the following open publication (https://pubmed.ncbi.nlm.nih.gov/26176839), licensed under a CC-BY license. Not internally tested by R&D Systems.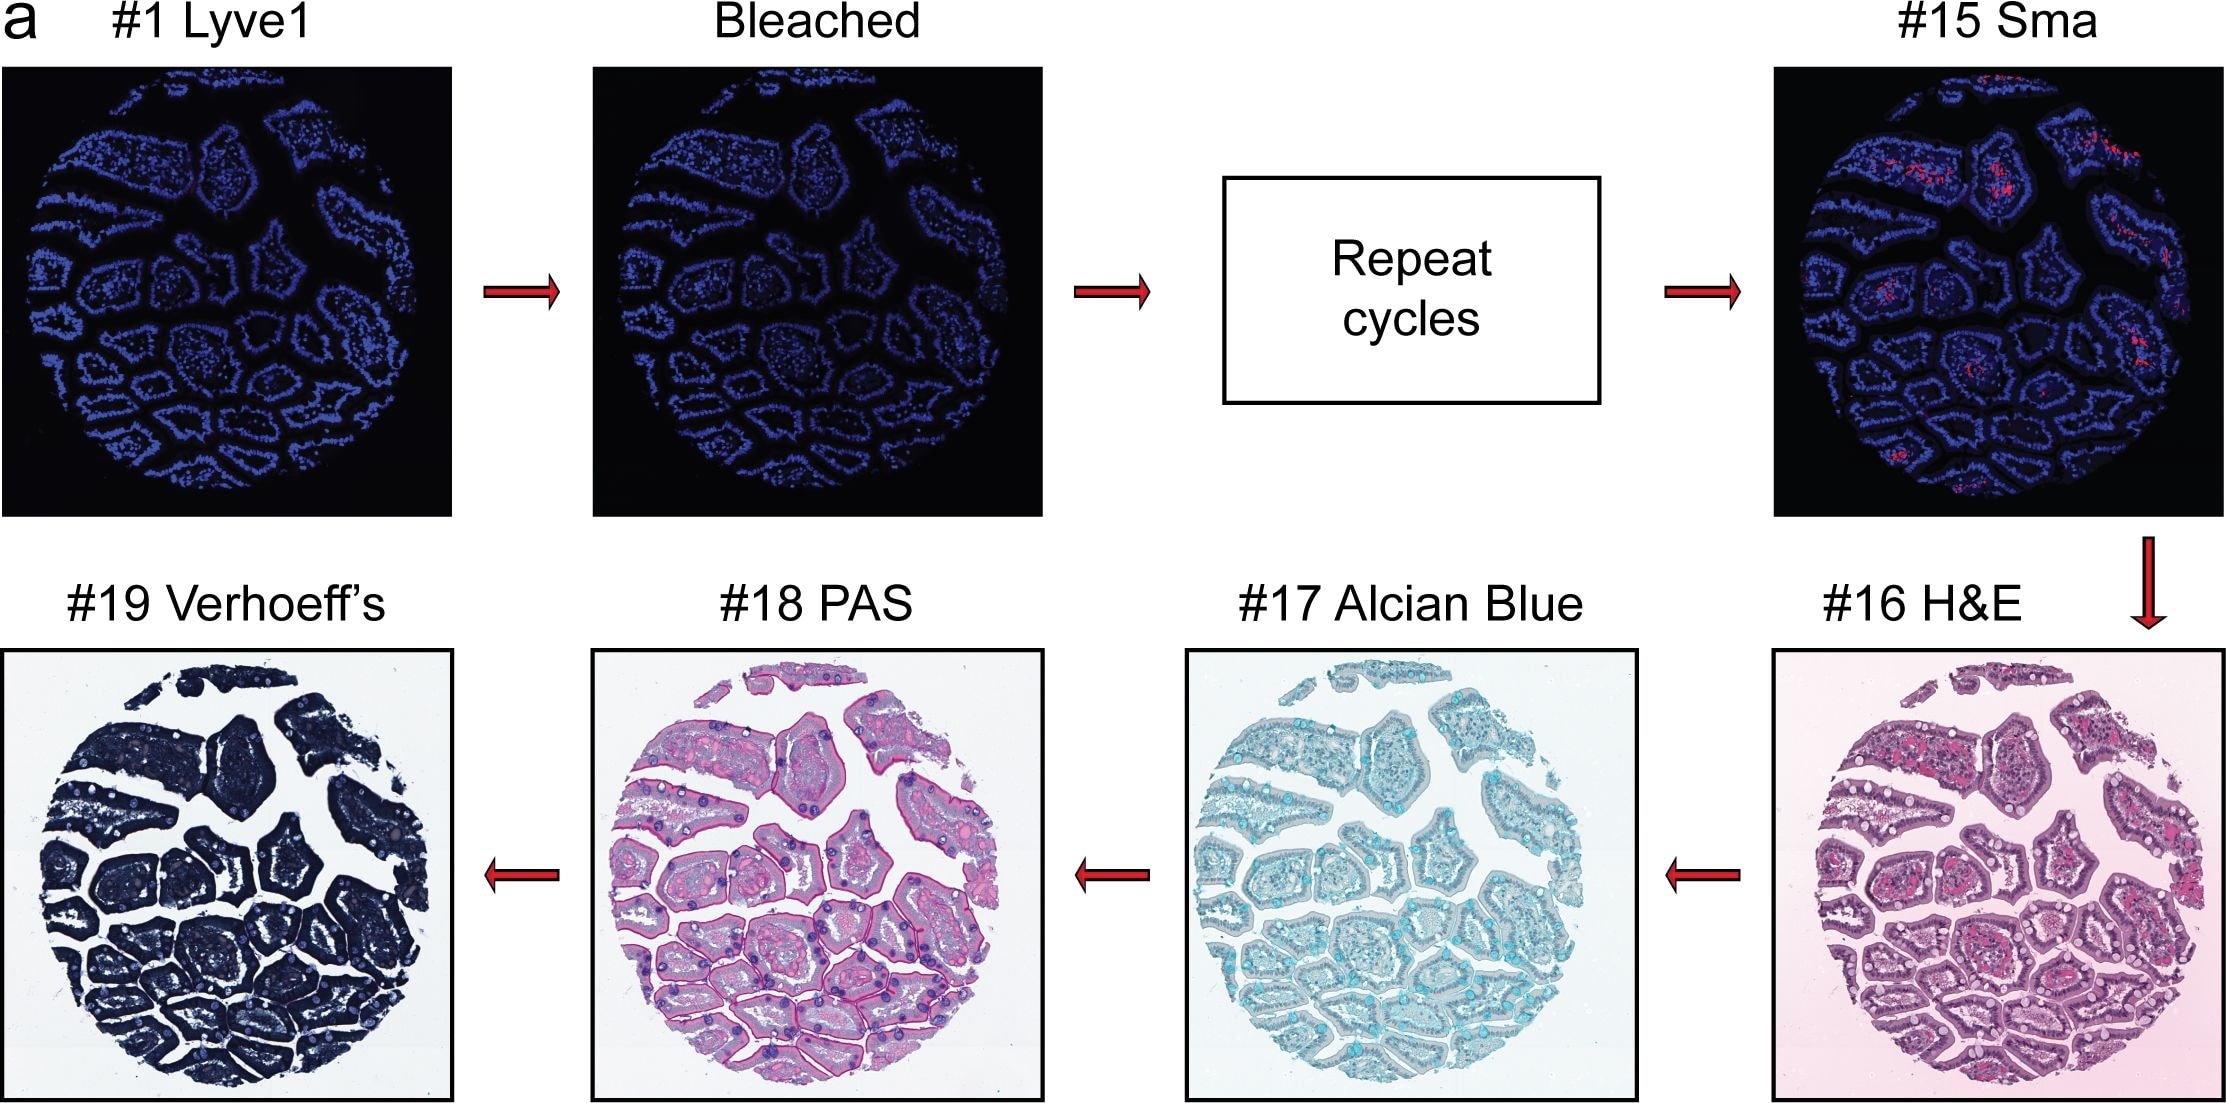
Detection of Human alpha-Smooth Muscle Actin by Immunocytochemistry/ Immunofluorescence
Overview of Multi-dimensional Microscopic Molecular Profiling (MMMP).The overall MMMP approach is depicted using an example tissue section from normal human duodenum (sample #1.9.7). (a) Slides were subjected to repeated cycles of staining and imaging with fluorescent primary antibodies and DAPI. At the end of each cycle, fluorescent signal was removed by a chemical bleaching process, and slides were again imaged, before proceeding to the next round of this iterative procedure. After the final antibody stain (#15 Sma), slides were analyzed with a series of histochemical stains. (b) A set of tiling images spanning each tissue section was initially generated by the microscope system. The tiling images were then computationally ‘stitched’ together to produce a single image per staining cycle for each sample. (c) Image registration was performed to align images from the same tissue section across cycles. Mean intensities of the DAPI signal from all immuno-fluorescence images are shown from before (Unregistered) and after (Registered) the image registration procedure was completed. (d) Following registration, signal intensities from the relevant channels for each image (columns) in the MMMP series were extracted for each pixel (rows) within the tissue section and compiled into a large data matrix of in situ molecular profiles. Image collected and cropped by CiteAb from the following open publication (https://pubmed.ncbi.nlm.nih.gov/26176839), licensed under a CC-BY license. Not internally tested by R&D Systems.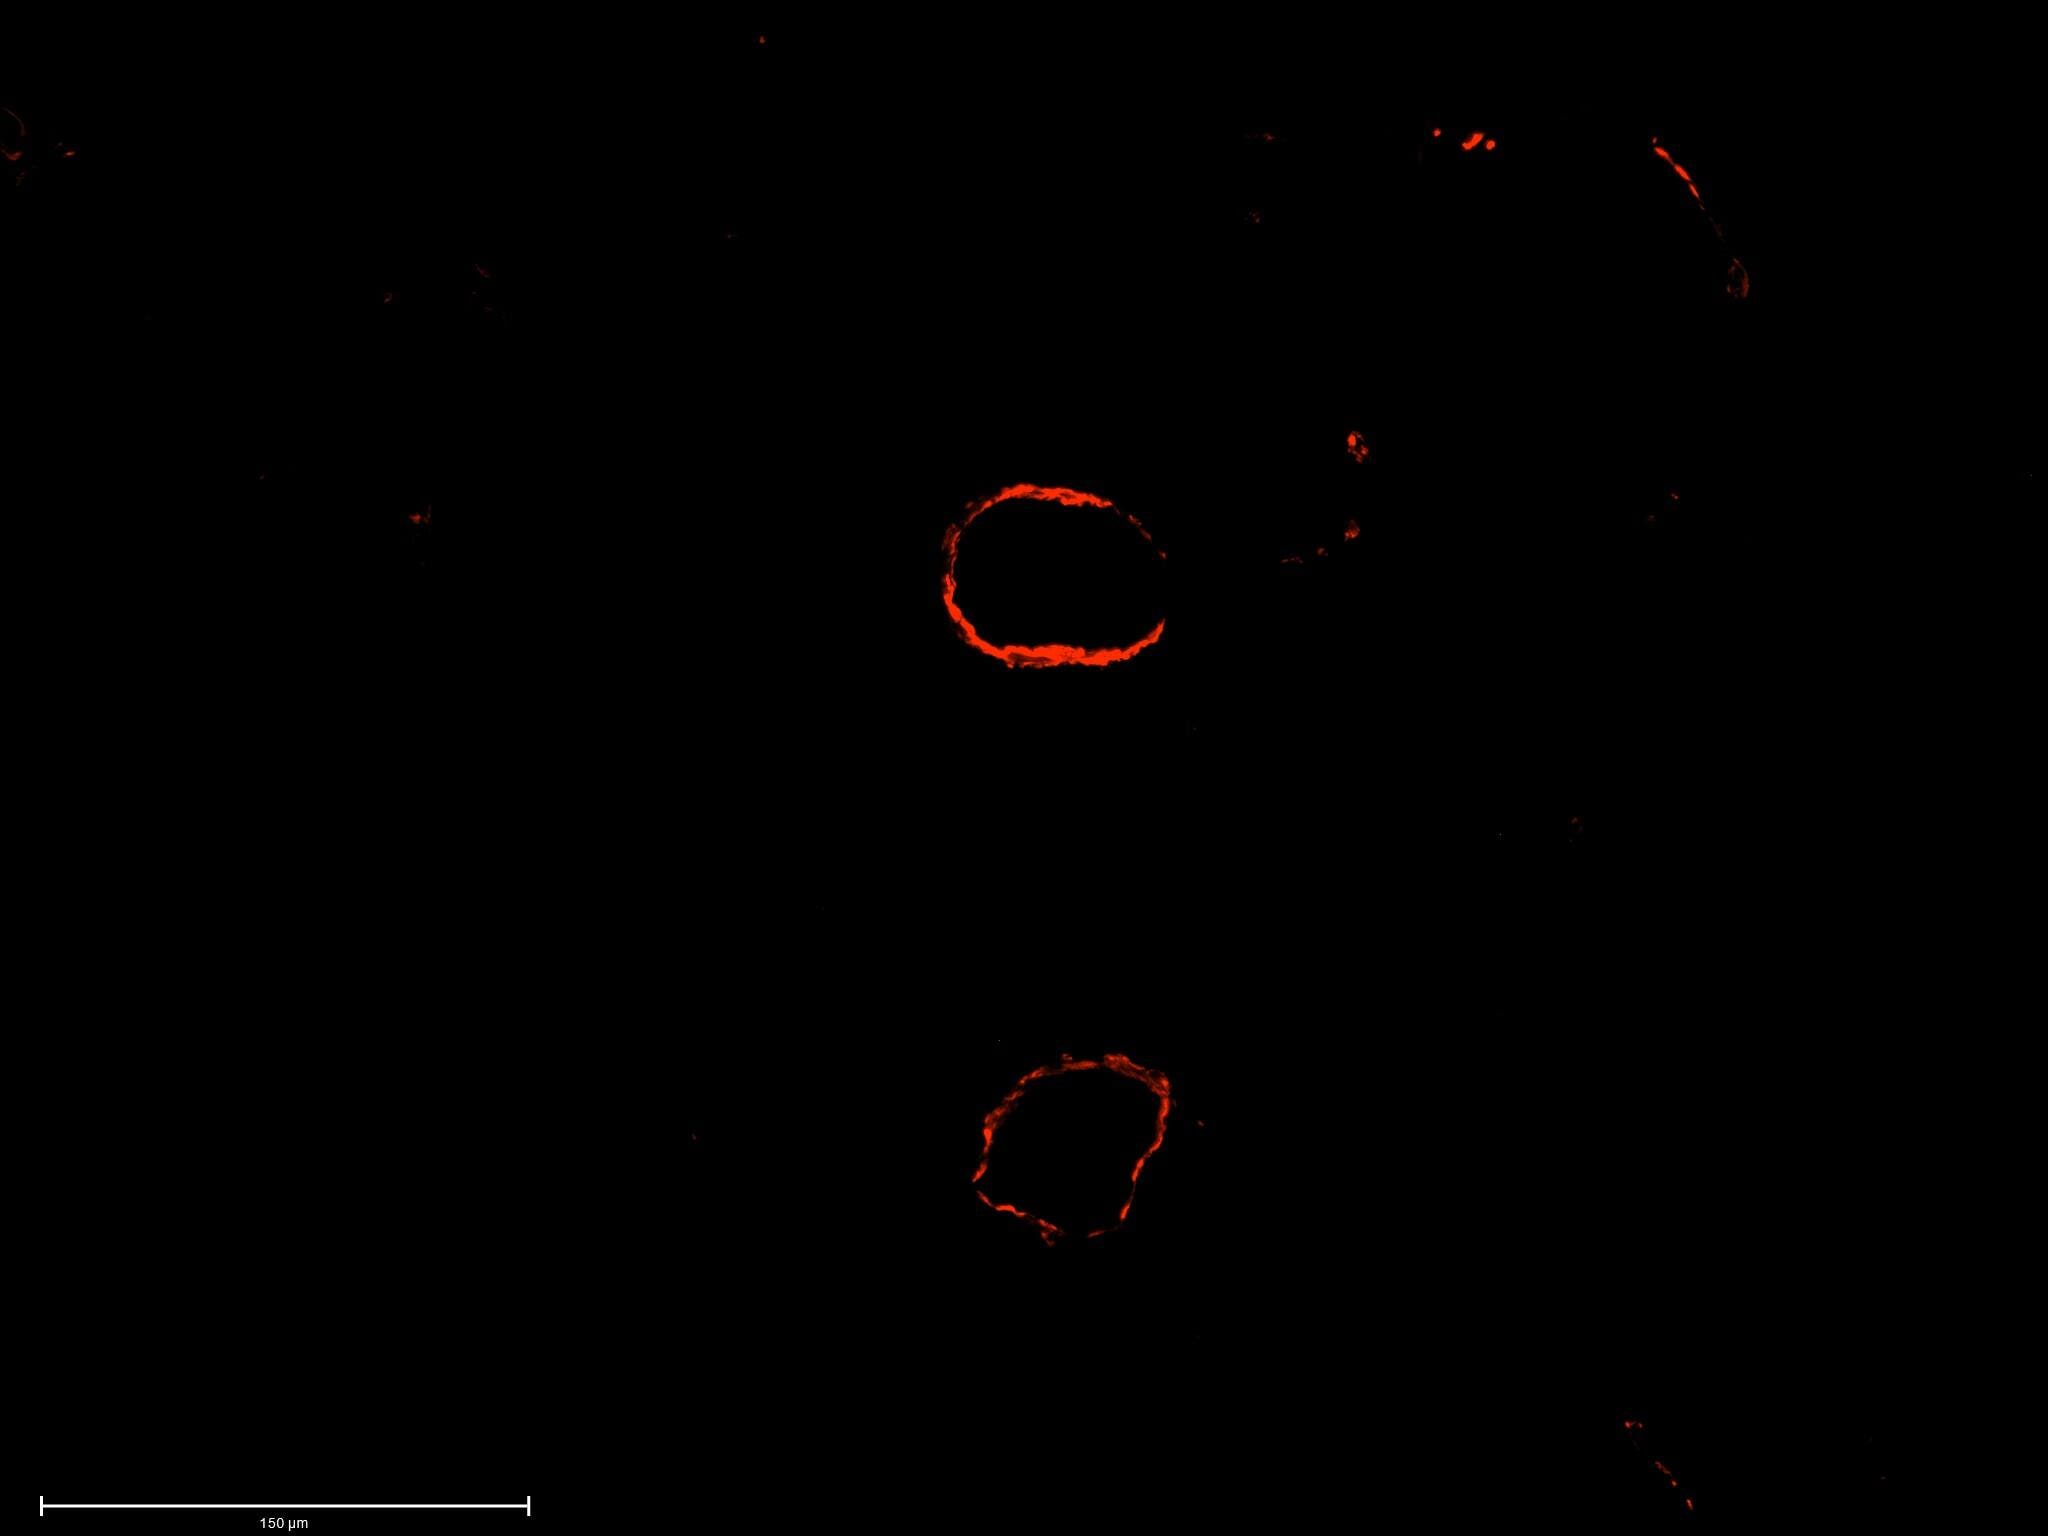
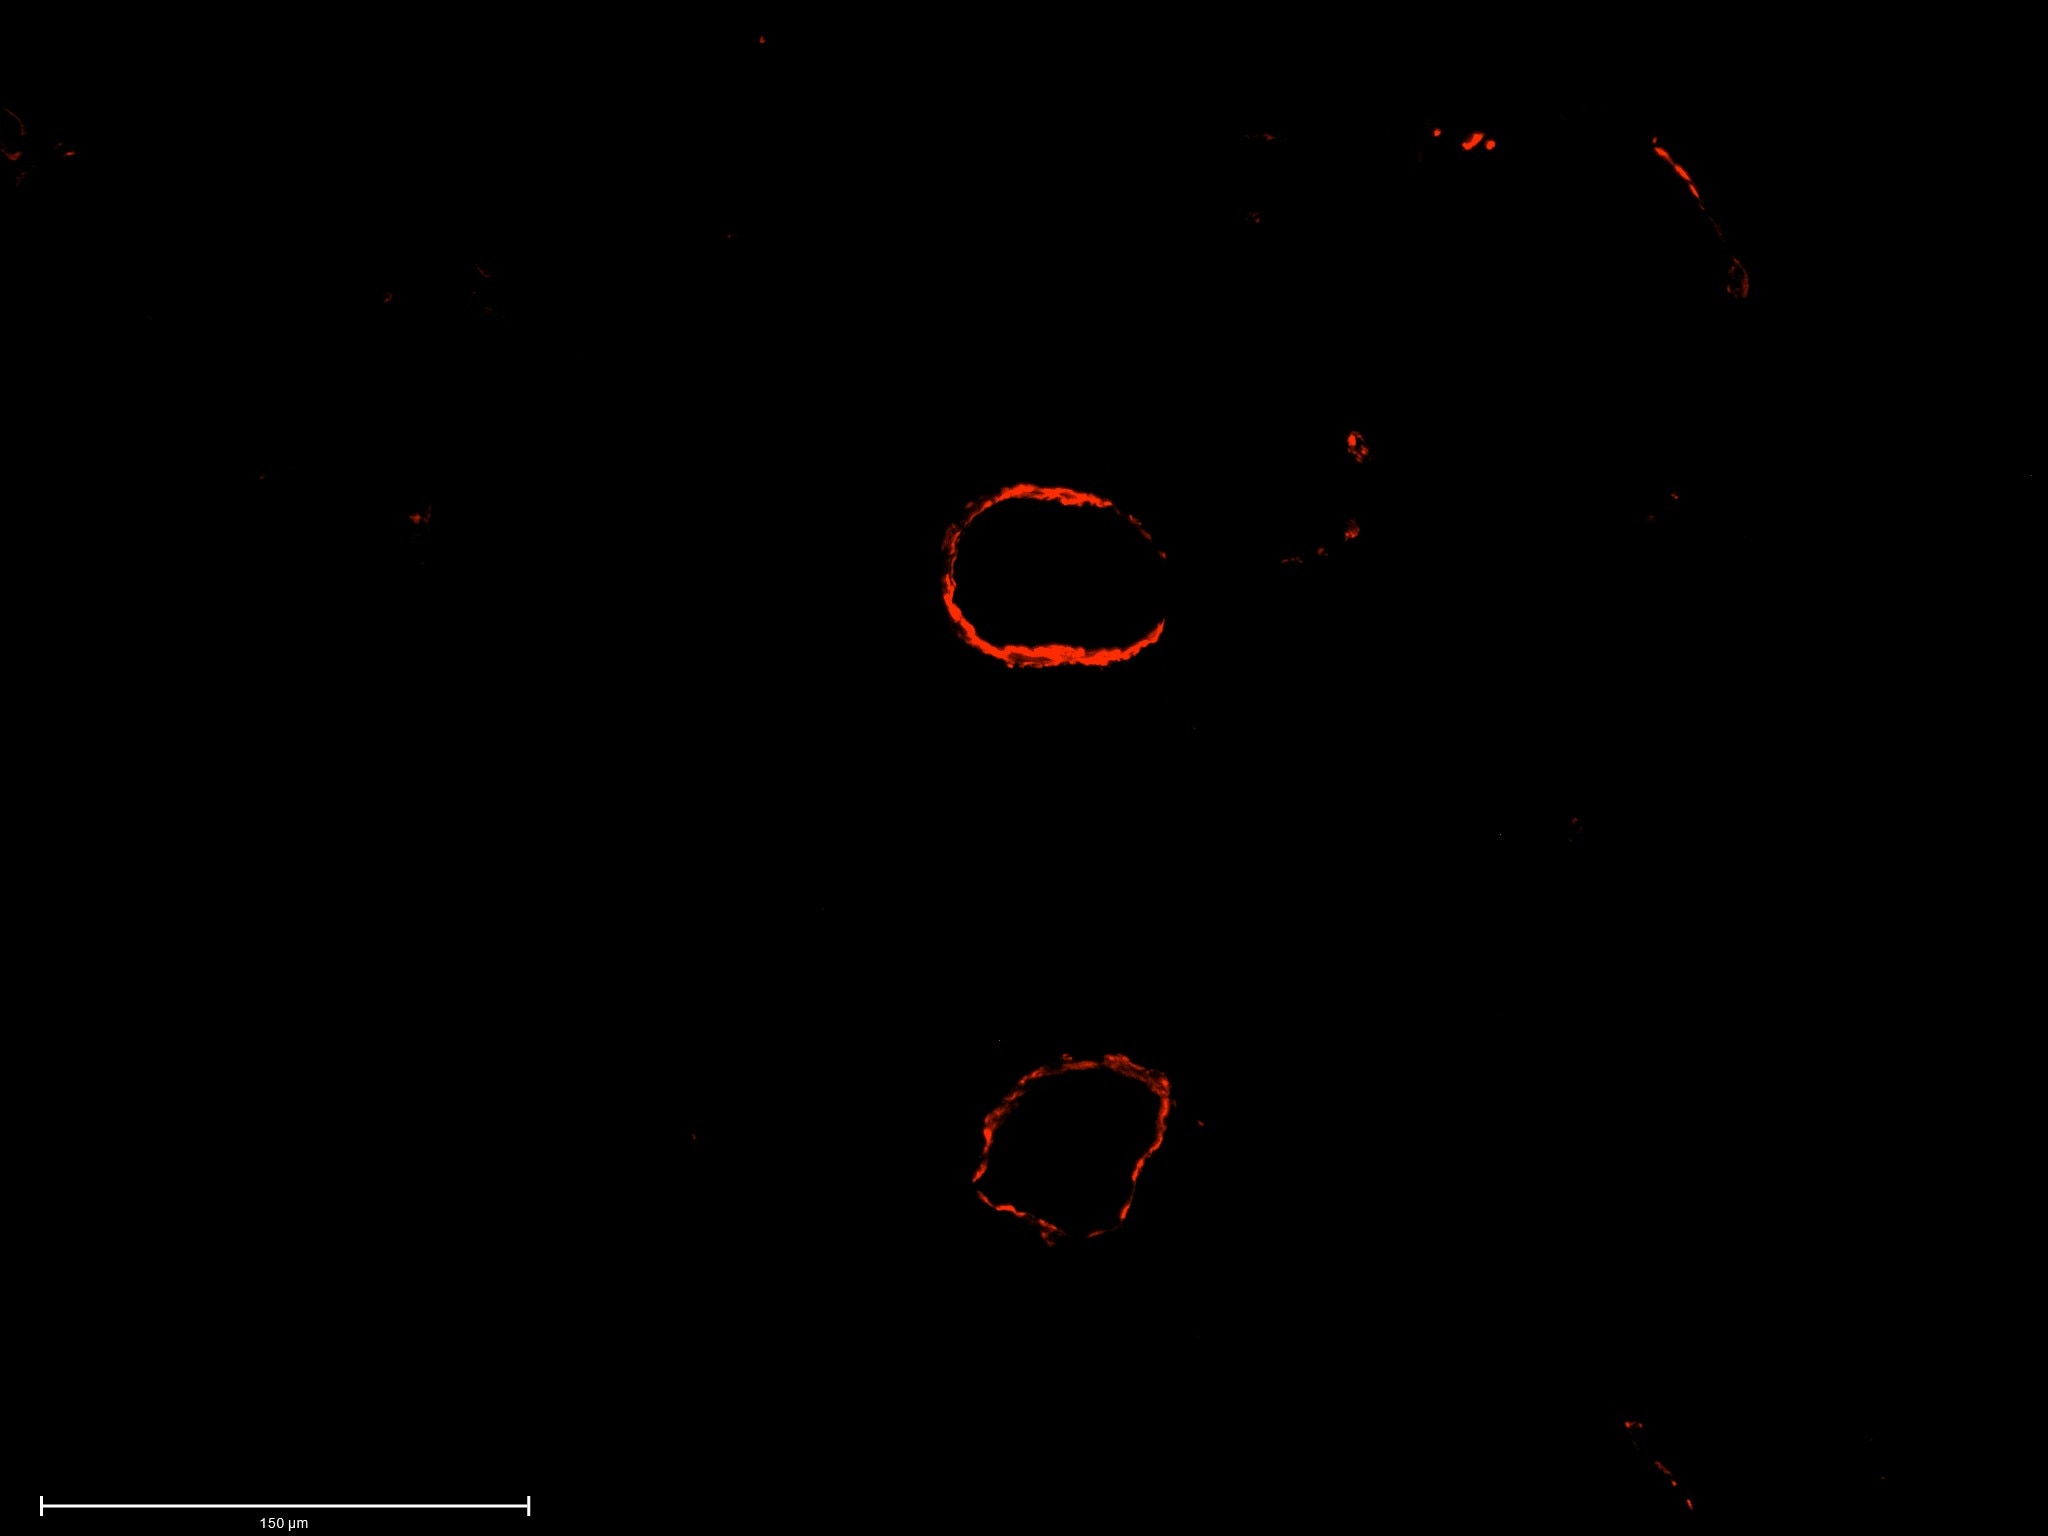
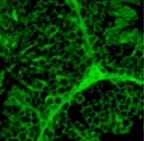
Detection of alpha-Smooth Muscle Actin in Mouse Lung.
IF staining with a-sma in mouse lung tissue to visualize vessels, 10x. Image from a verified customer review.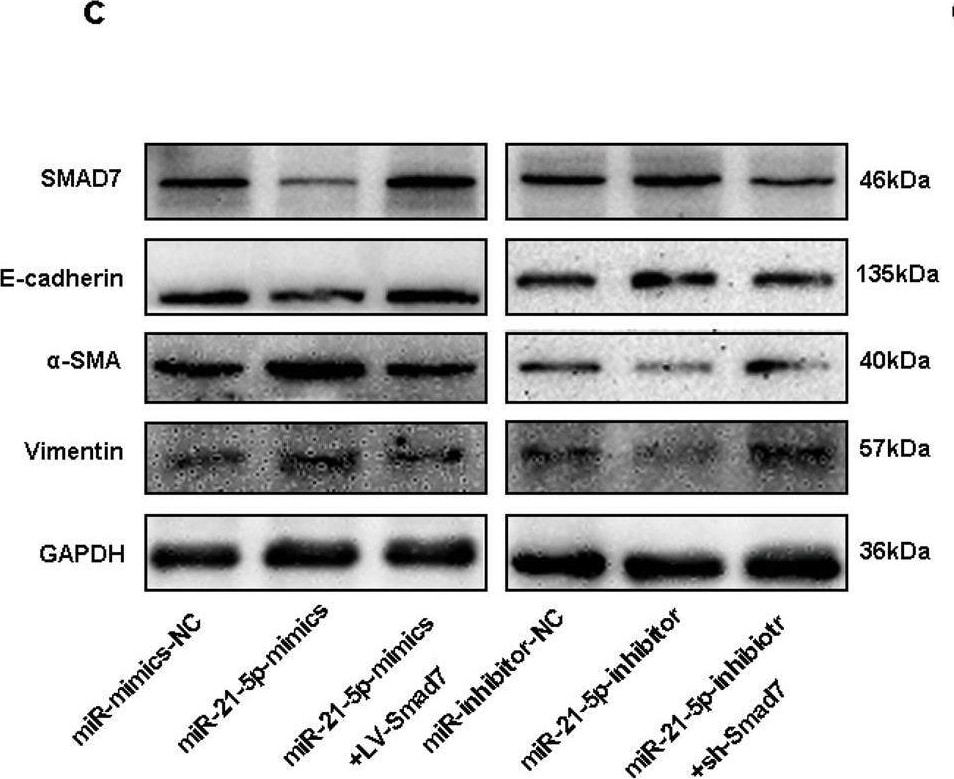
Detection of alpha -Smooth Muscle Actin by Western Blot
MiR-21-5p promotes MMT of HMrSV5 via targeting SMAD7.a, b To investigate the rescue function of SMAD7, adhesion (Scale bar = 100 µm) and invasion (Scale bar = 100 µm) assays were performed in HMrSV5-miR-21-5p-mimics or HMrSV5-miR-21-5p-inhibitor cells which were transfected with LV-SMAD7 or sh-SMAD7 without its 3’UTR. The negative controls for miR-21-5p-mimics + LV-SMAD7 and miR-21-5p-inhibitor + sh-SMAD7 were miR-21-5p-mimics and miR-21-5p-inhibitor, respectively. c, d The alteration of protein levels (including SMAD7, E-cadherin, alpha -SMA and Vimentin) were measured by western blot. GAPDH was used as a loading control. Each experiment was repeated at least three times. All the data were expressed as the mean ± SEM, and the results of multiple comparisons were corrected with Bonferroni method (Student’s t-test *P < 0.05, **P < 0.01, ***P < 0.001) Image collected and cropped by CiteAb from the following open publication (https://pubmed.ncbi.nlm.nih.gov/30154401), licensed under a CC-BY license. Not internally tested by R&D Systems.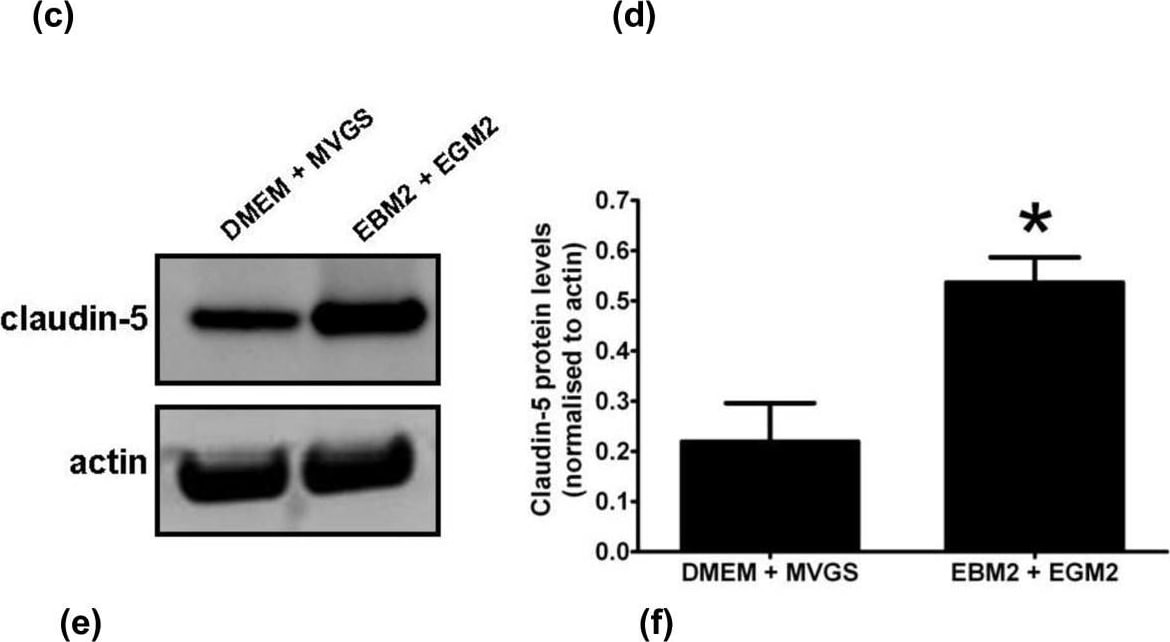
Detection of Rat alpha -Smooth Muscle Actin by Western Blot
Effect of media composition on RBEC barrier formation & characteristics. (a) Comparison of the effects of the DMEM/MVGS & EBM-2/EGM-2 media formulations on the TEER of RBECs grown for 14 days on cell culture inserts. Data is presented as mean ± SEM & was analysed using an unpaired, two-tailed students t-test, ***P < 0.0001; n = 5 independent cell culture experiments in 24-well plates, with 3 inserts per experiment, equivalent to 15 inserts total. (b) Calculated permeability coefficients for the paracellular passage of 100 μM (50 μg/mL) Lucifer yellow over a 90 minute period at 37°C across RBEC monolayers on cell culture inserts cultured in DMEM/MVGS & EBM-2/EGM-2 media formulations. Data is presented as mean ± SEM & was analysed using an unpaired, two-tailed students t-test, ***P < 0.0001; n = 5 independent cell culture experiments, with 3 inserts per experiment, equivalent to 15 inserts total. Fluorescence microscope images of RBECs stained with an antibody raised against the tight junction protein claudin-5 following culture in (c) DMEM/MVGS supplement, or (d) EBM-2/EGM-2. White arrows indicate regions of discontinuous claudin-5 staining. Images are representative of 3 independent cultures, with five fields of view taken from each individual preparation of cells using the 20× objective on an Olympus IX81 microscope. (e) Western blot analysis of claudin-5 protein expression levels in RBECs cultured in DMEM/MVGS & EBM-2/EGM-2. Blots were reprobed with anti-actin antibodies as a control for equal loading of cell lysates. (f) Densitometry analysis of claudin-5 band intensity, normalised to actin levels, for RBECs grown in DMEM/MVGS vs. EBM-2/EGM-2. Data is presented as mean ± SEM & was analysed using an unpaired, two-tailed students t-test, *P < 0.01; n = 3 independent experiments. Image collected & cropped by CiteAb from the following open publication (https://pubmed.ncbi.nlm.nih.gov/23773766), licensed under a CC-BY license. Not internally tested by R&D Systems.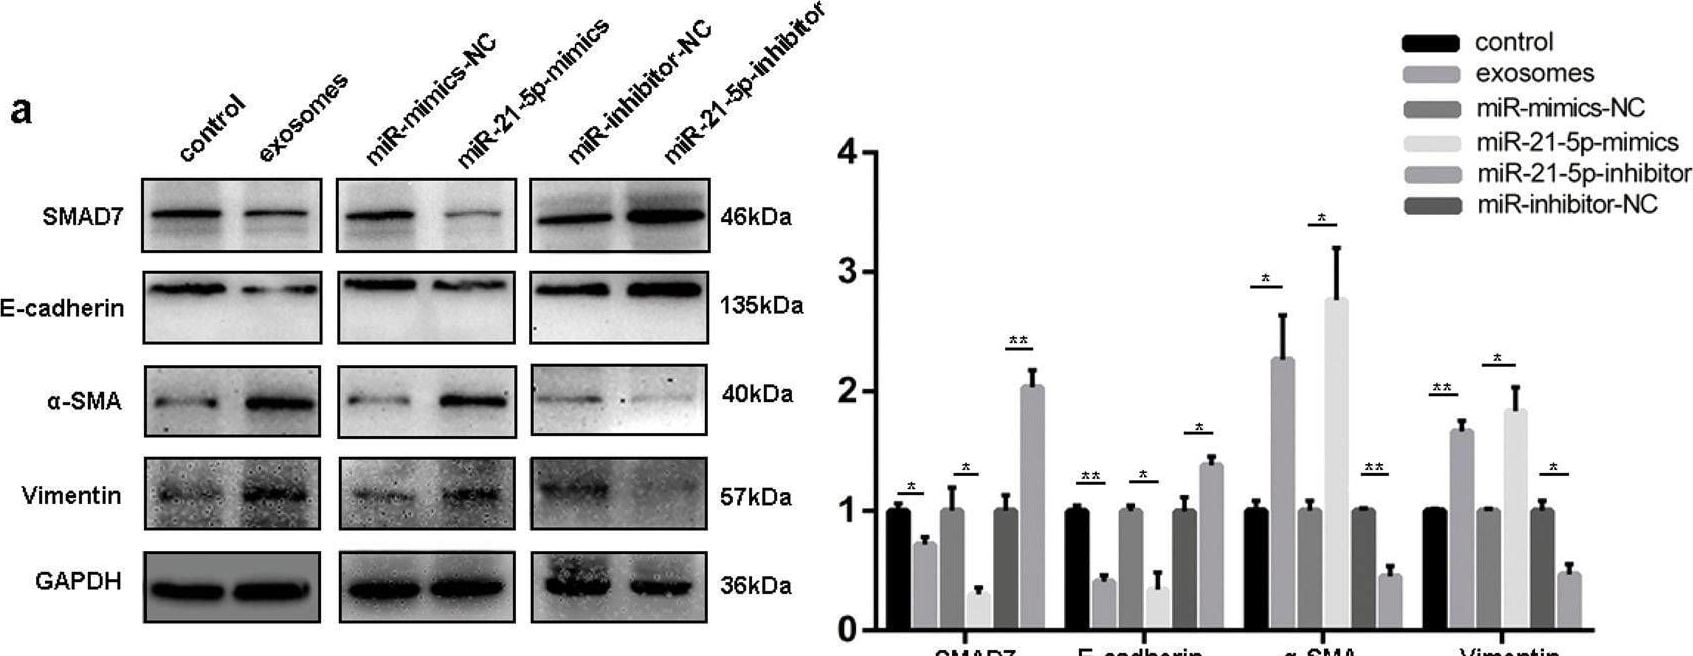
Detection of alpha -Smooth Muscle Actin by Western Blot
MiR-21-5p promotes GC peritoneal metastasis by inducing MMT in vivo. A Western blot was performed to analyse the expression levels of SMAD7, E-cadherin, alpha -SMA, and Vimentin in peritoneal tissues from different groups. GAPDH was used as a loading control. b, d Bioluminescence images of tumor peritoneal dissemination in different groups, and the luciferase activity was analyzed. c, e Representative images were captured from different groups, and tumors were outlined in white. f HE stain for tumor tissues from each groups (Scale bar = 50 µm, 100X magnification; Scale bar = 100 µm, 400X magnification). Each experiment was repeated at least three times. All the data were expressed as mean ± SEM (Student’s t-test *P < 0.05, **P < 0.01, ***P < 0.001) Image collected and cropped by CiteAb from the following open publication (https://pubmed.ncbi.nlm.nih.gov/30154401), licensed under a CC-BY license. Not internally tested by R&D Systems.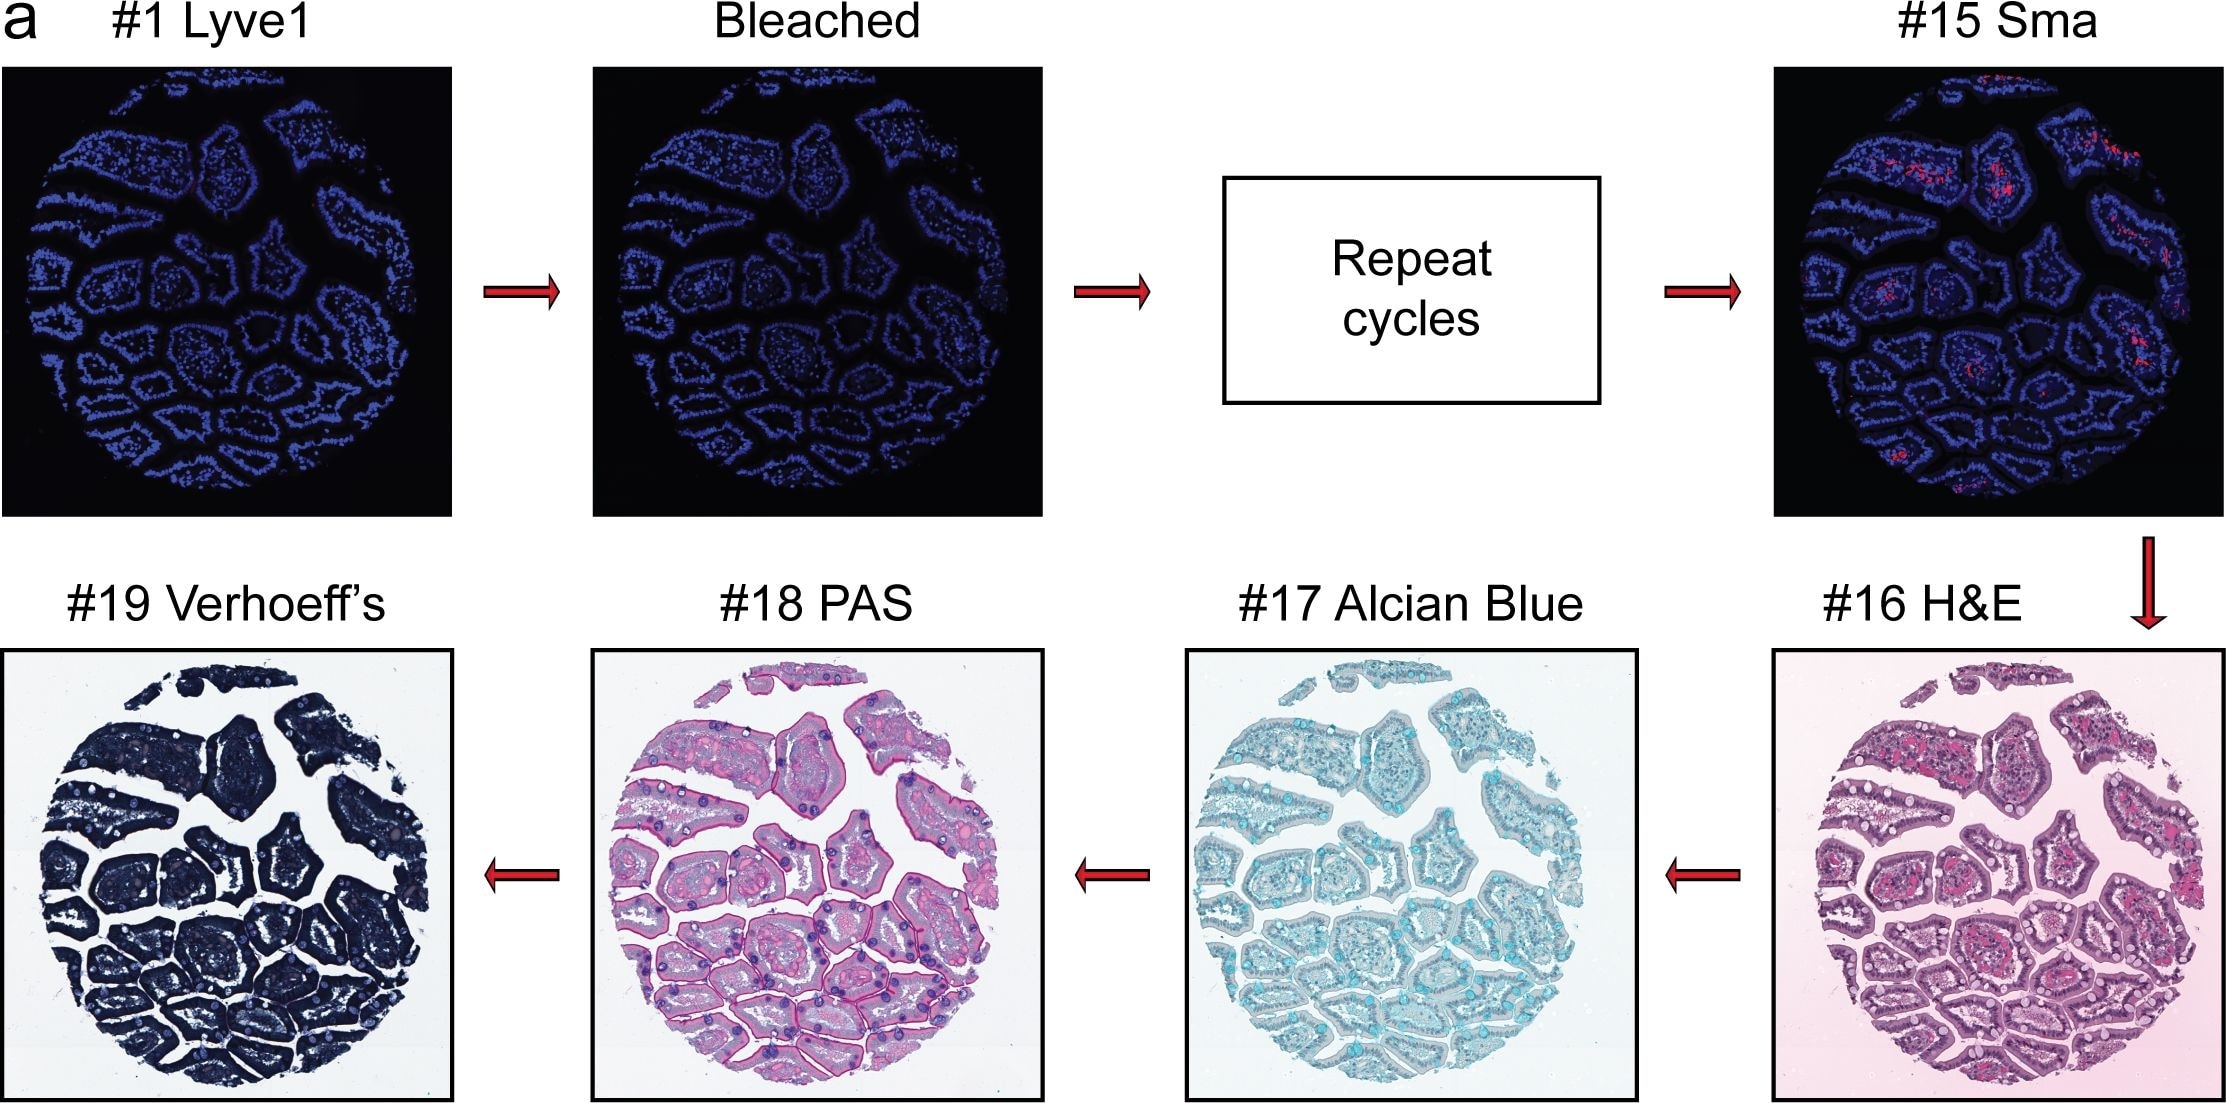
Detection of Human alpha -Smooth Muscle Actin by Immunohistochemistry
Overview of Multi-dimensional Microscopic Molecular Profiling (MMMP).The overall MMMP approach is depicted using an example tissue section from normal human duodenum (sample #1.9.7). (a) Slides were subjected to repeated cycles of staining and imaging with fluorescent primary antibodies and DAPI. At the end of each cycle, fluorescent signal was removed by a chemical bleaching process, and slides were again imaged, before proceeding to the next round of this iterative procedure. After the final antibody stain (#15 Sma), slides were analyzed with a series of histochemical stains. (b) A set of tiling images spanning each tissue section was initially generated by the microscope system. The tiling images were then computationally ‘stitched’ together to produce a single image per staining cycle for each sample. (c) Image registration was performed to align images from the same tissue section across cycles. Mean intensities of the DAPI signal from all immuno-fluorescence images are shown from before (Unregistered) and after (Registered) the image registration procedure was completed. (d) Following registration, signal intensities from the relevant channels for each image (columns) in the MMMP series were extracted for each pixel (rows) within the tissue section and compiled into a large data matrix of in situ molecular profiles. Image collected and cropped by CiteAb from the following open publication (https://pubmed.ncbi.nlm.nih.gov/26176839), licensed under a CC-BY license. Not internally tested by R&D Systems.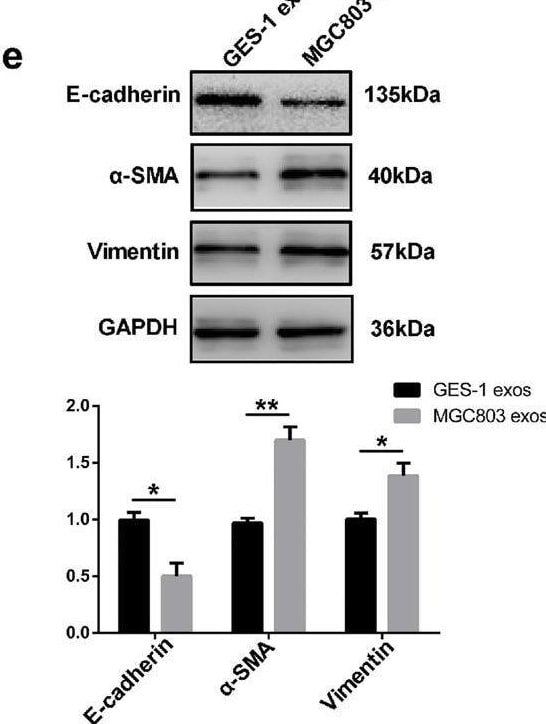
Detection of alpha -Smooth Muscle Actin by Western Blot
GC-derived exosomes induce MMT of HMrSV5 cells in vivo and promote peritoneal metastasis. A Invasion assays of HMrSV5 cells which were pretreated with 200 µg exosomes isolated from culture supernatant of four GC cells and GES-1 cells. Scale bar = 100 µm. b Adhesion assays of HMrSV5 cells which were pretreated with 200 µg exosomes. Scale bar = 100 µm. Calcein AM labeled BGC823 cells were added to investigate the adhesion ability of HMrSV5. c Bioluminescence images of tumor peritoneal dissemination. d MMT protein markers (Vimentin and alpha -SMA) were identified by immunofluorescence assays in exosomes-treated group and control group. Scale bar = 50 µm. e Western blot was performed to further confirm the MMT protein markers (including E-cadherin, alpha -SMA, and Vimentin). GES-1 cells-derived exosomes were used as the negative control in vivo and in vitro. GAPDH was used as an internal reference for western blot. Each experiment was repeated at least three times. All the data were expressed as mean ± SEM, and the results of multiple comparisons were corrected with Bonferroni method (Student’s t-test *P < 0.05, **P < 0.01, ***P < 0.001) Image collected and cropped by CiteAb from the following open publication (https://pubmed.ncbi.nlm.nih.gov/30154401), licensed under a CC-BY license. Not internally tested by R&D Systems.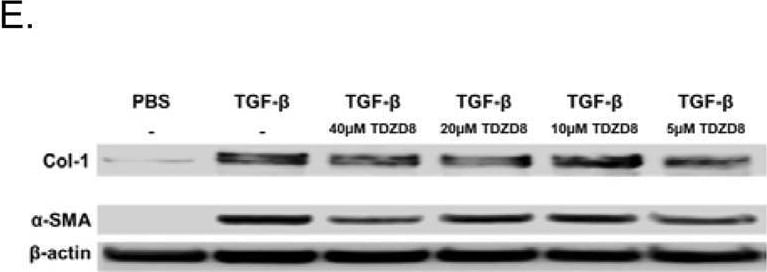
Detection of alpha -Smooth Muscle Actin by Western Blot
9-ING-41 blocks TGF-beta mediated fibroblast to myofibroblast transition. Fibroblasts (normal, A,B and IPF, C,D) were treated with various doses of 9-ING-41 (10-0.5 µM) in serum free media. Cells were then treated with TGF-beta for 48 h. Conditioned medias and cell lysates were then resolved by SDS-PAGE and immunoblotted for collagen (Col-1), alpha -SMA, GSK-3 beta, and tyrosine-216 phosphorylated GSK-3 beta. Under control conditions, TGF-beta induced Col-1 and alpha -SMA protein in NF and IPF fibroblasts (A and C). 9-ING-41 (10 and 5 µM) significantly blocked TGF-beta mediated induction of alpha -SMA and Col-1 in NF and IPF cells. Tyr-216 phosphorylation of GSK-3 beta (pGSKt) was likewise reduced by pretreatment with 9-ING-41 in both NF and IPF fibroblasts. Graphed data are the means of n = 3 independent experiments. Images are representative of 3–4 independent experiments. Total RNA was isolated from TGF-beta treated cells in the presence or absence varying doses 9-ING-41 (10–0.5 µM). Changes in alpha -SMA and collagen 1 expression were then determined by qPCR analyses (B and D). GAPDH was used as the reference gene. Data are expressed as mean ± SEM. n = 3 independent experiments. *Denotes p < 0.05 compared to TGF-beta control. Normal (E) and IPF (F) fibroblasts were treated with varying doses of TDZD-8 (40-5 µM) prior to the addition of TGF-beta. Cell lysates and conditioned media were then resolved via SDS-PAGE and probed for changes alpha -SMA and collagen. beta -actin was the loading control. TDZD-8 modestly reduced alpha -SMA and collagen induction by TGF-beta at the highest dose (40 µM). Images are representative of two independent experiments. Image collected and cropped by CiteAb from the following open publication (https://pubmed.ncbi.nlm.nih.gov/31831767), licensed under a CC-BY license. Not internally tested by R&D Systems.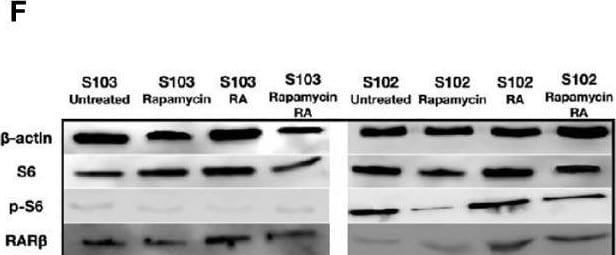
Detection of Human alpha -Smooth Muscle Actin by Western Blot
Restoration of RAR beta expression by RA. (A) mRNA expression levels of RAR beta are significantly increased in LAM cell lines (n=4) compared to controls BSMC and NHLF after 2 μM RA treatment for 24 h. Significant changes are marked as ★ (P<0.05). (B, C), Protein expression levels of RAR beta using immunofluorescence staining in LAM cell lines compared to controls (BSMC and NHLF) after 2 μM RA treatment for 24 h. Immunofluorescence staining RAR beta green, DAPI blue, magnification 40x, size-bar 40 μm. (D, E) Western blot analysis of RAR beta protein levels in LAM cell lines and control cells (NHLF and BSMC). (F, G) Western blot analysis of RAR beta, S6 and pS6 protein levels in S102 cell line compared to S103. WB protein expression levels were quantified by ImageJ and are presented as percentage compared to controls. Changes are marked as N.S. (Non Significant) or significant ★, ★★, ★★★ and ★★★★ (P<0.05, P<0.001, P<0.0002 and P<0.0001, respectively). Image collected and cropped by CiteAb from the following open publication (https://pubmed.ncbi.nlm.nih.gov/34178631), licensed under a CC-BY license. Not internally tested by R&D Systems.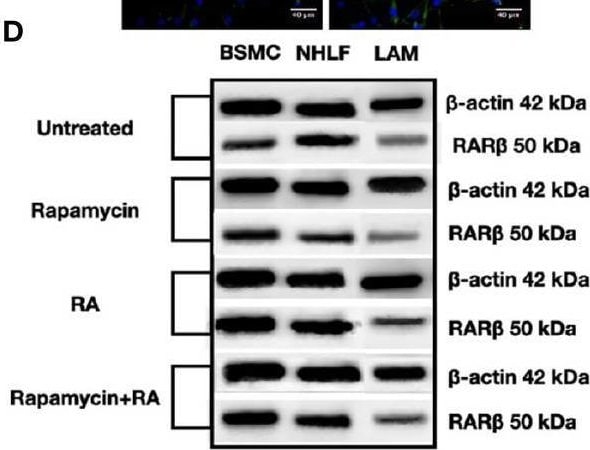
Detection of Human alpha -Smooth Muscle Actin by Western Blot
Restoration of RAR beta expression by RA. (A) mRNA expression levels of RAR beta are significantly increased in LAM cell lines (n=4) compared to controls BSMC and NHLF after 2 μM RA treatment for 24 h. Significant changes are marked as ★ (P<0.05). (B, C), Protein expression levels of RAR beta using immunofluorescence staining in LAM cell lines compared to controls (BSMC and NHLF) after 2 μM RA treatment for 24 h. Immunofluorescence staining RAR beta green, DAPI blue, magnification 40x, size-bar 40 μm. (D, E) Western blot analysis of RAR beta protein levels in LAM cell lines and control cells (NHLF and BSMC). (F, G) Western blot analysis of RAR beta, S6 and pS6 protein levels in S102 cell line compared to S103. WB protein expression levels were quantified by ImageJ and are presented as percentage compared to controls. Changes are marked as N.S. (Non Significant) or significant ★, ★★, ★★★ and ★★★★ (P<0.05, P<0.001, P<0.0002 and P<0.0001, respectively). Image collected and cropped by CiteAb from the following open publication (https://pubmed.ncbi.nlm.nih.gov/34178631), licensed under a CC-BY license. Not internally tested by R&D Systems.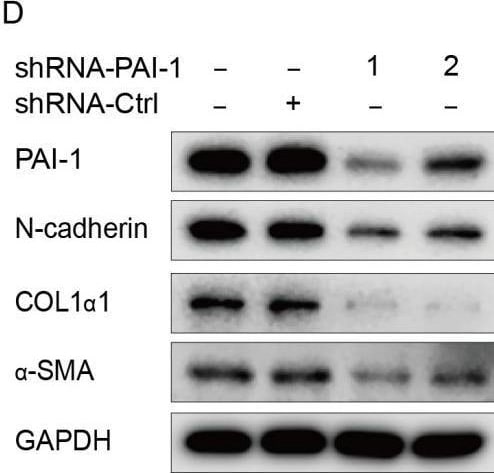
Detection of Mouse alpha -Smooth Muscle Actin by Western Blot
PAI-1 regulates the activation of LX-2 cells involving EMT pathway. (A) Relative mRNA expression of PAI-1 in LX-2 cells when treated with eupatilin (mean ± SD, n = 3). (B) Western blot analysis of PAI-1 in LX-2 cells. (C) Relative protein signal intensity of Figure 4B was quantified as mean ± standard deviation (mean ± SD, n = 3). (D) Protein levels of PAI-1, N-cadherin, COL1 alpha 1 and alpha -SMA detected by Western blotting. LX-2 cells were transfected with control (shRNA-Ctrl) or shRNA targeting PAI-1 (shRNA-PAI-1 1 and shRNA-PAI-1 2) for 48 h. (E) Relative protein signal intensity of Figure 4D was quantified as mean ± standard deviation (mean ± SD, n = 3). (F) Cell viability of LX-2 cells transfected with shRNA-Ctrl or shRNA-PAI-1 detected by CCK8 assay (mean ± SD, n = 4). p values are calculated by one-way ANOVA followed by the Tukey’s test. ** p < 0.01 and *** p < 0.001 vs. 0 μM EUP group. #p < 0.05, ##p < 0.01 and ###p < 0.001 vs. shRNA-Ctrl group. EUP: Eupatilin; alpha -SMA: alpha -smooth muscle actin; COL1 alpha 1: Collagen type I alpha 1; PAI-1: Plasminogen activator inhibitor-1; GAPDH: Glyceraldehyde-3-phosphate dehydrogenase. Image collected and cropped by CiteAb from the following open publication (https://www.mdpi.com/1422-0067/24/6/5933), licensed under a CC-BY license. Not internally tested by R&D Systems.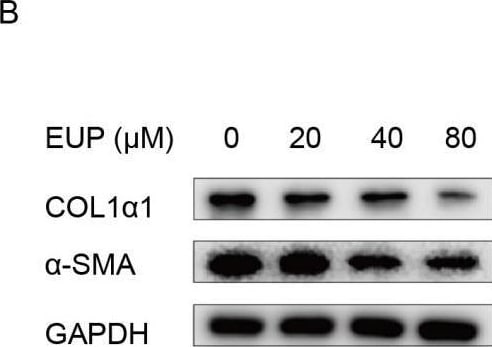
Detection of Mouse alpha -Smooth Muscle Actin by Western Blot
Eupatilin represses the activation of LX-2 cells. (A) Chemical structure of eupatilin. (B) Protein expression of COL1 alpha 1, alpha -SMA detected 48 h after eupatilin treatment by Western blotting. (C) Relative protein signal intensity was quantified as mean ± standard deviation (mean ± SD, n = 3). p values are calculated by one-way ANOVA followed by the Tukey’s test. * p < 0.05, ** p < 0.01 and *** p < 0.001 vs. 0 μM EUP group. (D) Heatmap showing expression level of collagens evaluated by transcriptome analysis (n = 3). (E) The top five reactome pathways of the DEGs in transcriptome analysis. EUP: Eupatilin; alpha -SMA: alpha -smooth muscle actin; COL1 alpha 1: Collagen type I alpha 1; COL1 alpha 2: Collagen type I alpha 2; COL8 alpha 1: Collagen type VIII alpha 1; COL9 alpha 2: Collagen type IX alpha 2; COL12 alpha 1: Collagen type XII alpha 1; COL11 alpha 1: Collagen type XI alpha 1; COL17 alpha 1: Collagen type X VII alpha 1; GAPDH: Glyceraldehyde-3-phosphate dehydrogenase. Image collected and cropped by CiteAb from the following open publication (https://www.mdpi.com/1422-0067/24/6/5933), licensed under a CC-BY license. Not internally tested by R&D Systems.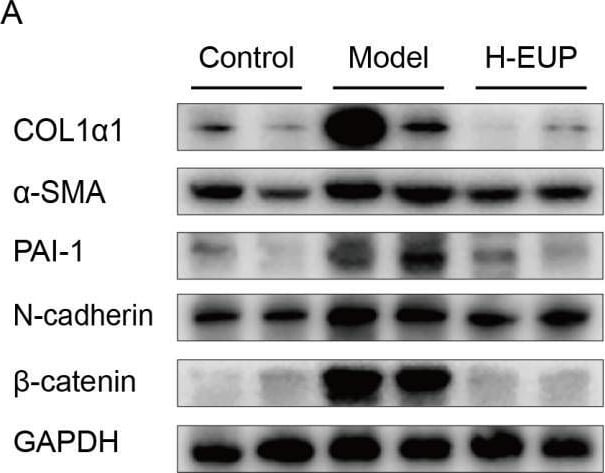
Detection of Mouse alpha -Smooth Muscle Actin by Western Blot
Eupatilin inhibits expression of COL1 alpha 1, alpha -SMA, PAI-1, N-cadherin, and beta -catenin in the liver tissues of model group treated with the high-dose eupatilin. (A) Western blot analysis of COL1 alpha 1, alpha -SMA, PAI-1, N-cadherin and beta -catenin in CCl4-induced mice liver tissues treated with eupatilin (40 mg/kg). (B) Relative protein signal intensity was quantified as mean ± standard deviation (mean ± SD, n = 6). ##p < 0.01 and ###p < 0.001 vs. control group. ** p < 0.01 and *** p < 0.001 vs. model group. p values are calculated by one-way ANOVA followed by the Tukey’s test. H-EUP: High-dose eupatilin; COL1 alpha 1: Collagen type I alpha 1; alpha -SMA: alpha -smooth muscle actin; PAI-1: Plasminogen activator inhibitor-1; GAPDH: Glyceraldehyde-3-phosphate dehydrogenase; EMT: Epithelial–mesenchymal transition; ECM: Extracellular matrix. Image collected and cropped by CiteAb from the following open publication (https://www.mdpi.com/1422-0067/24/6/5933), licensed under a CC-BY license. Not internally tested by R&D Systems.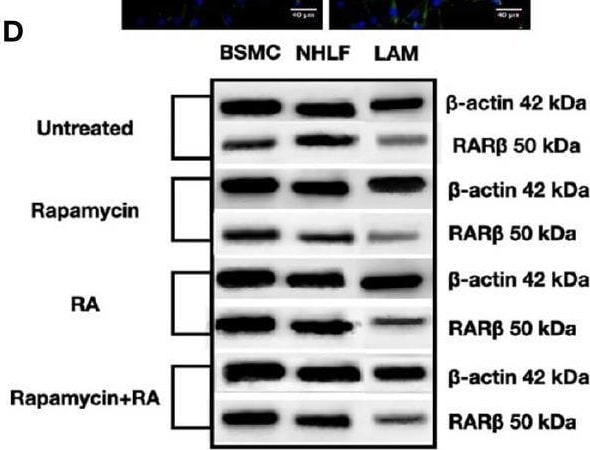
Detection of alpha-Smooth Muscle Actin by Western Blot
Restoration of RAR beta expression by RA. (A) mRNA expression levels of RAR beta are significantly increased in LAM cell lines (n=4) compared to controls BSMC and NHLF after 2 μM RA treatment for 24 h. Significant changes are marked as ★ (P<0.05). (B, C), Protein expression levels of RAR beta using immunofluorescence staining in LAM cell lines compared to controls (BSMC and NHLF) after 2 μM RA treatment for 24 h. Immunofluorescence staining RAR beta green, DAPI blue, magnification 40x, size-bar 40 μm. (D, E) Western blot analysis of RAR beta protein levels in LAM cell lines and control cells (NHLF and BSMC). (F, G) Western blot analysis of RAR beta, S6 and pS6 protein levels in S102 cell line compared to S103. WB protein expression levels were quantified by ImageJ and are presented as percentage compared to controls. Changes are marked as N.S. (Non Significant) or significant ★, ★★, ★★★ and ★★★★ (P<0.05, P<0.001, P<0.0002 and P<0.0001, respectively). Image collected and cropped by CiteAb from the following open publication (https://pubmed.ncbi.nlm.nih.gov/34178631), licensed under a CC-BY license. Not internally tested by R&D Systems.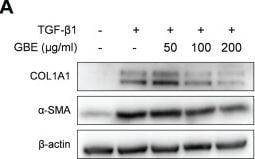
Detection of alpha-Smooth Muscle Actin by Western Blot
GBE downregulated the expression of fibrosis markers induced by TGF-beta. (A and B) Mouse embryonic fibroblasts (NIH3T3) (A) and normal human dermal fibroblasts (B) were treated with TGF-beta 1 (10 ng/ml) and GBE for 24 h. The protein levels of COL1A1 and alpha -SMA were analyzed by western blot. Beta-actin or GAPDH was used as a loading control for western blot. (C–H) NIH3T3 cells (C–E) and normal human dermal fibroblasts (F–H) were treated with TGF-beta 1 (10 ng/ml) and GBE for 24 h and the relative mRNA expression levels of COL1A1, alpha -SMA, and CTGF were analyzed by qPCR. GAPDH was used as a normalization control for qPCR. Data are presented as mean ± SEM. P-values were calculated using one-way ANOVA with Dunnett's post hoc test compared with TGF-beta 1 group. ***P < 0.001. Image collected and cropped by CiteAb from the following open publication (https://pubmed.ncbi.nlm.nih.gov/38645438), licensed under a CC-BY license. Not internally tested by R&D Systems.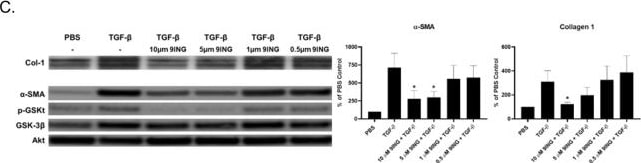
Detection of alpha-Smooth Muscle Actin by Western Blot
9-ING-41 reverses established fibroblast to myofibroblast transition. Serum-starved NF and IPF cells were treated with TGF-beta for 24 hours. Varying doses of 9-ING-41 (10-5 µM) were then added to the TGF-beta –treated cells and allowed to incubate for 48 hours. Conditioned media and lysates from NF (A) and IPF (C) were resolved by SDS-PAGE and immunoblotted for collagen (Col)-1 and alpha -smooth muscle actin ( alpha -SMA). Lysates were also immunoblotted for GSK-3 beta phosphorylation at tyrosine 216. beta -Actin was used as loading control. For quantitative PCR (qPCR) analyses varying doses of 9-ING-41 (10 to 0.5 µM) were added to TGF-beta –treated normal (B) and IPF (D) cells and then allowed to incubate for 24 hours. Total RNA was then isolated and transcribed into cDNA. alpha -SMA expression was determined by qPCR analyses. GAPDH served as the reference gene. Data are expressed as means ± SEM. n = 3 independent experiments. ∗p < 0.05 versus TGF-beta treatment. Image collected and cropped by CiteAb from the following open publication (https://pubmed.ncbi.nlm.nih.gov/31831767), licensed under a CC-BY license. Not internally tested by R&D Systems.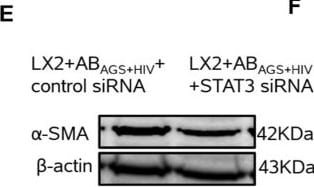
Detection of alpha-Smooth Muscle Actin by Western Blot
STAT3-deficient LX2 cells show downregulation of profibrotic genes and alpha -SMA after exposure to ABAGS+HIV: RT-PCR analysis of: (A) ACTA2 mRNA, (B) COL1A1 mRNA, (C) MMP2 mRNA, and (D) TGF beta 1 mRNA. (E,F) alpha -SMA was measured by immunoblot analysis and the quantification of immunoreactive protein bands. Equal amounts of protein (20 µg) were loaded in each lane. beta -actin was used as an internal control. Data are from 3 independent experiments presented as mean ± SEM. Bars with * are significantly different from each other (p 0.05). Image collected and cropped by CiteAb from the following open publication (https://www.mdpi.com/2079-7737/11/7/1059), licensed under a CC-BY license. Not internally tested by R&D Systems.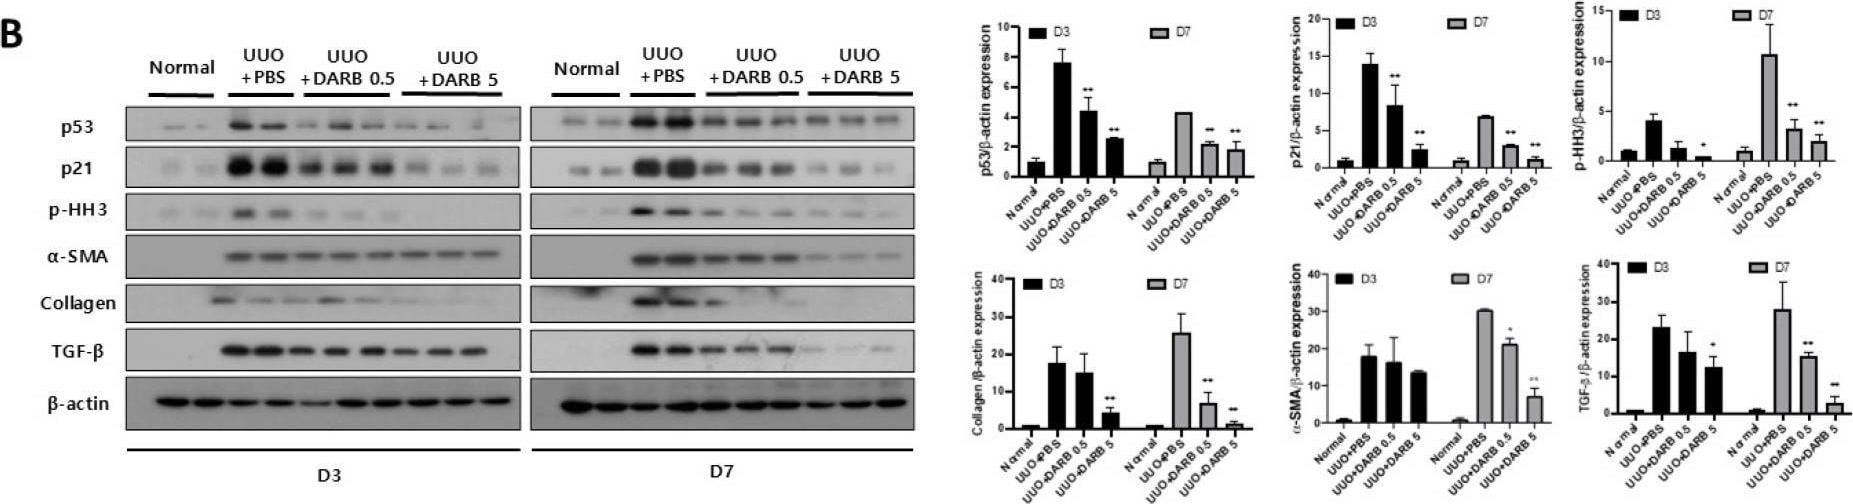
Detection of alpha-Smooth Muscle Actin by Western Blot
Protective effect of ESA against fibrotic changes in the UUO kidney. (A) mRNA expression of p53 and p21, which are associated with G2/M arrest, increased in UUO kidney sections but significantly decreased after DARB treatment. Kidney fibrosis-related markers, including TGFB, showed similar results. The levels of pro-inflammatory markers, such as CTGF and MCP-1, were nearly restored to normal levels following DARB treatment. COL1A1 and FN, the end-products of renal fibrosis, were attenuated by DARB treatment. (B) Protein levels of p53 and p21 were reduced by DARB treatment in UUO mouse model. The expression of p–HH3, collagen, and alpha -SMA were significantly decreased. The expression of TGF-beta decreased dose-dependently via DARB treatment. (C) Immunohistochemical findings of TGF-beta, alpha -SMA, p53, and p-Histone H3 staining. Quantitative analysis of (D) the TGF-beta -positive area (%), (E) alpha -SMA-positive area (%), (F) p-Histone H3-positive area (%), and (G) p53-positive area (%) showed that after UUO, DARB treatment tended to reduce the positive areas of TGF-beta, alpha -SMA, and p53, as well as decreased the percentage of G2/M phase-arrested cells in a dose-dependent manner. Data are expressed at the mean ± SD. N = 5–6 mice in each group; Magnification ×40; * p < 0.05, ** p < 0.001 vs. UUO + PBS. Image collected and cropped by CiteAb from the following open publication (https://pubmed.ncbi.nlm.nih.gov/41227308), licensed under a CC-BY license. Not internally tested by R&D Systems.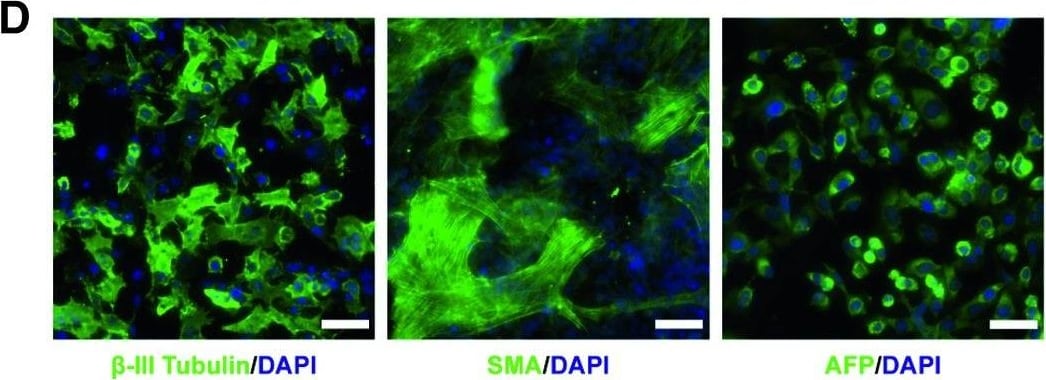
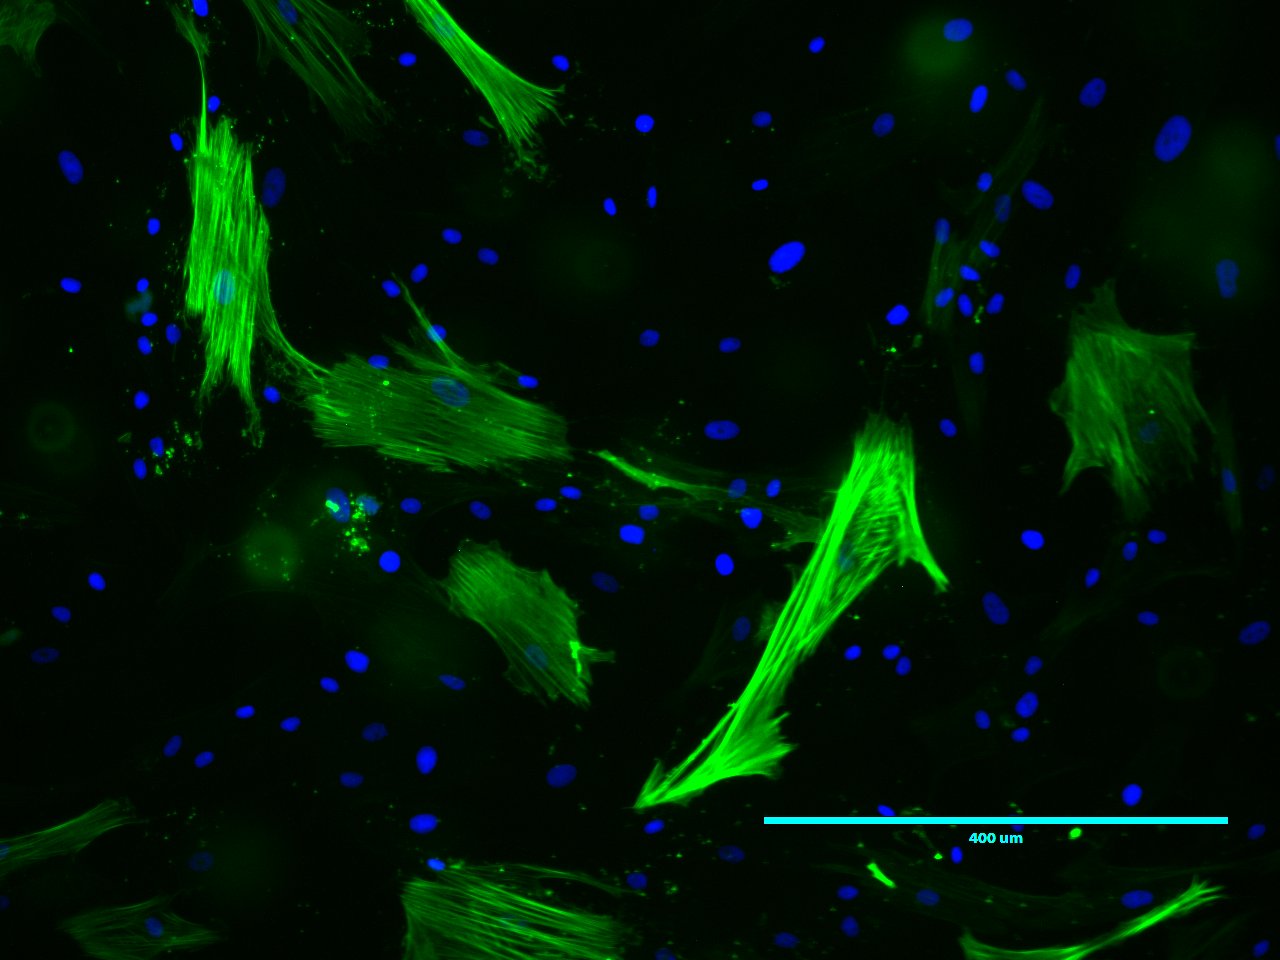
Detection of alpha-Smooth Muscle Actin by Immunocytochemistry/ Immunofluorescence
Functional glycosylation of alpha ‐dystroglycan and characterization of dystroglycanopathy patient‐specific iPSCsCurrent model of the core M3 functional glycan structure on alpha ‐dystroglycan and enzymes involved in its synthesis. ECM ligands, such as laminins, bind to the Xyl‐GlucA disaccharide repeats (IIH6 epitope). Man, mannose; GlcNAc, N‐acetylglucosamine; GalNAc, N‐acetylgalactosamine; Rbo5P, ribitol‐5‐phosphate; Xyl, xylose; GlcA, glucuronic acid.Representative images of immunostaining demonstrate that FKRP‐iPSCs express specific pluripotency‐associated markers, including NANOG, OCT4, Tra‐1‐60, and SSEA4.FKRP‐iPSCs have a normal karyotype.In vitro differentiation of FKRP‐iPSCs to cells representing ectoderm ( beta ‐III Tubulin, Tuj1), mesoderm (SMA, smooth muscle actin), and endoderm (AFP, alpha ‐fetoprotein).Data information: Scale bars, 50 μm. Image collected and cropped by CiteAb from the following open publication (https://pubmed.ncbi.nlm.nih.gov/31566294), licensed under a CC-BY license. Not internally tested by R&D Systems.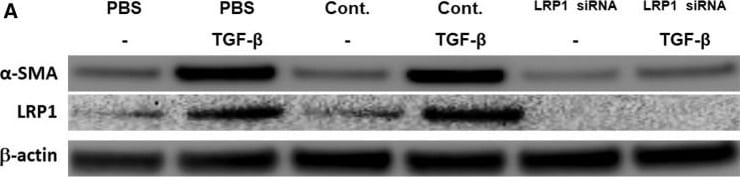
Detection of alpha-Smooth Muscle Actin by Western Blot
LRP1 down-regulation blocks TGF-beta induced MesoMT. Untransfected, control siRNA and LRP1 siRNA transfected cells were serum-starved for 24 h. Serum-starved untransfected, control siRNA and LRP1 siRNA transfected cells were treated with PBS or TGF-beta for 24 h (RNA analyses) and 48 h (protein analyses). (A) Cell lysates were resolved by SDS-PAGE and immunoblotted for alpha -SMA Western blot. Akt was the loading control. Image is representative of three independent experiments. (B) Total RNA was isolated from untransfected, control siRNA and LRP1 siRNA transfected cells treated with TGF-beta for 24 h. Changes in alpha -SMA and LRP1 mRNA levels were determined by qPCR analyses. GUSB was used as the reference gene. Data represents the mean of three independent experiments. *denotes p < 0.05 compared to siRNA control. Image collected and cropped by CiteAb from the following open publication (https://pubmed.ncbi.nlm.nih.gov/34707211), licensed under a CC-BY license. Not internally tested by R&D Systems.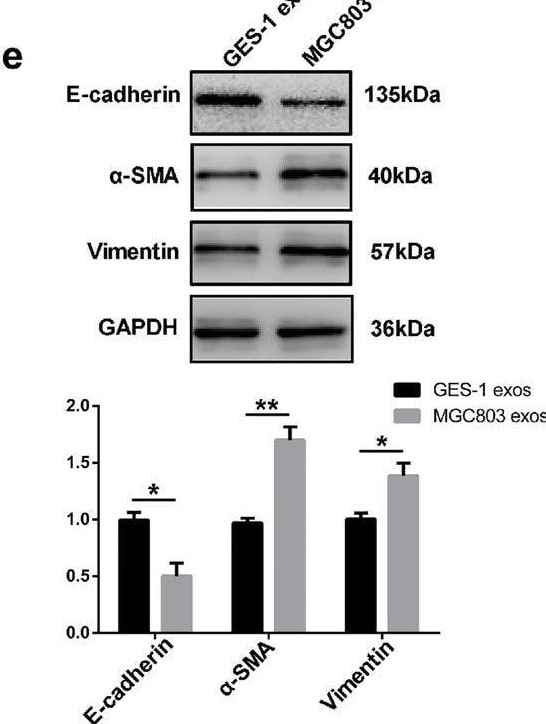
Detection of alpha-Smooth Muscle Actin by Western Blot
GC-derived exosomes induce MMT of HMrSV5 cells in vivo and promote peritoneal metastasis.a Invasion assays of HMrSV5 cells which were pretreated with 200 µg exosomes isolated from culture supernatant of four GC cells and GES-1 cells. Scale bar = 100 µm. b Adhesion assays of HMrSV5 cells which were pretreated with 200 µg exosomes. Scale bar = 100 µm. Calcein AM labeled BGC823 cells were added to investigate the adhesion ablitity of HMrSV5. c Bioluminescence images of tumor peritoneal dissemination. d MMT protein markers (Vimentin and alpha -SMA) were identified by immunofluorescence assays in exosomes-treated group and control group. Scale bar = 50 µm. e Western blot was performed to further confirm the MMT protein markers (including E-cadherin, alpha -SMA, and Vimentin). GES-1 cells-derived exosomes were used as the negative control in vivo and in vitro. GAPDH was used as an internal reference for western blot. Each experiment was repeated at least three times. All the data were expressed as mean ± SEM, and the results of multiple comparisons were corrected with Bonferroni method (Student’s t-test *P < 0.05, **P < 0.01, ***P < 0.001) Image collected and cropped by CiteAb from the following open publication (https://pubmed.ncbi.nlm.nih.gov/30154401), licensed under a CC-BY license. Not internally tested by R&D Systems.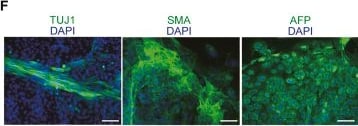
Detection of alpha-Smooth Muscle Actin by Immunohistochemistry
Generation of MYH7-tdTom knocked-in cells after GCV selection(A) Structure of the MYH7 gene near the end of the open reading frame and the sites of the primer binding for genotyping. The chkMYH7 LA-f and tdTom-r primer sets amplify only the left arm of the KI allele, while the chkMYH7 LA-f and MYH71 LA-r sets can amplify the WT allele (KI allele could not be amplified with this primer set).(B) Representative image of electrophoresis using the product of genotyping PCR for MYH7 WT and KI alleles in hiPSC clones obtained from GCV-treated or non-treated MYH7-TEZ cells.(C) The ratio of KI clones and negative clones in GCV-treated or non-treated conditions. 16 clones from each condition were examined with genotyping PCR. ∗p <0.05 calculated from Fisher’s exact test.(D) Expression of self-renewal markers of hiPSCs, OCT3/4 (red) and NANOG (green), in a MYH7-TEZ clone. DAPI was used to stain nuclei (blue). Scale bars, 100 μm.(E) Flow cytometry of TRA-1-60 and SSEA4 in a MYH7-TEZ clone.(F) Pluripotency in a MYH7-TEZ clone was evaluated with EB formation assay. Immunocytochemistry of TUJ1 (ectoderm marker), alpha-SMA (mesoderm marker), and AFP (endoderm marker) in EB samples are shown in green. DAPI was used to stain nuclei (blue). Scale bars, 100 μm.(G) Phase-contrast and tdTom fluorescent images in a MYH7-TEZ clone after being differentiated into cardiomyocytes on differentiation day 12. Scale bars, 200 μm. Image collected and cropped by CiteAb from the following open publication (https://pubmed.ncbi.nlm.nih.gov/38086384), licensed under a CC-BY license. Not internally tested by R&D Systems.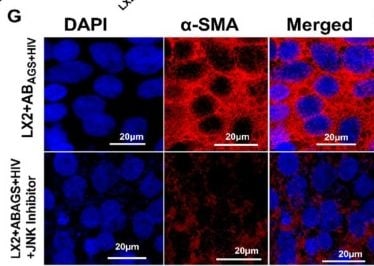
Detection of alpha-Smooth Muscle Actin by Immunocytochemistry/ Immunofluorescence
Attenuation of profibrotic markers in LX2 cells exposed to ABAGS+HIV by pharmacological inhibition of JNK pathway: RT-PCR analysis of (A) TGF beta 1 mRNA, (B) ACTA2 mRNA, and (C) COL1A1 mRNA. (D–F) Phopho-ERK1/2 and alpha -smooth muscle actin were measured by immunoblot analysis and immunoreactive blots were quantified. Equal amounts of protein (20 µg) were loaded in each lane. beta -actin was used as an internal control. (G) Immunofluorescent staining of alpha -smooth muscle actin. Staining was visualized using a Keyence BZ-X810 fluorescence microscope. Pictures are representative data from three independent experiments. (H) Quantification of SMA was measured using NIH ImageJ. Data are from 3 independent experiments presented as mean ± SEM. Bars marked with the same letter are not significantly different. Bars with * are significantly different from each other (p ≤ 0.05). Image collected and cropped by CiteAb from the following open publication (https://www.mdpi.com/2079-7737/11/7/1059), licensed under a CC-BY license. Not internally tested by R&D Systems.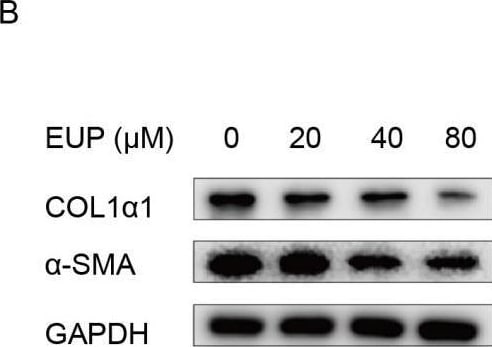
Detection of alpha-Smooth Muscle Actin by Western Blot
Eupatilin represses the activation of LX-2 cells. (A) Chemical structure of eupatilin. (B) Protein expression of COL1 alpha 1, alpha -SMA detected 48 h after eupatilin treatment by Western blotting. (C) Relative protein signal intensity was quantified as mean ± standard deviation (mean ± SD, n = 3). p values are calculated by one-way ANOVA followed by the Tukey’s test. * p < 0.05, ** p < 0.01 and *** p < 0.001 vs. 0 μM EUP group. (D) Heatmap showing expression level of collagens evaluated by transcriptome analysis (n = 3). (E) The top five reactome pathways of the DEGs in transcriptome analysis. EUP: Eupatilin; alpha -SMA: alpha -smooth muscle actin; COL1 alpha 1: Collagen type I alpha 1; COL1 alpha 2: Collagen type I alpha 2; COL8 alpha 1: Collagen type VIII alpha 1; COL9 alpha 2: Collagen type IX alpha 2; COL12 alpha 1: Collagen type XII alpha 1; COL11 alpha 1: Collagen type XI alpha 1; COL17 alpha 1: Collagen type X VII alpha 1; GAPDH: Glyceraldehyde-3-phosphate dehydrogenase. Image collected and cropped by CiteAb from the following open publication (https://www.mdpi.com/1422-0067/24/6/5933), licensed under a CC-BY license. Not internally tested by R&D Systems.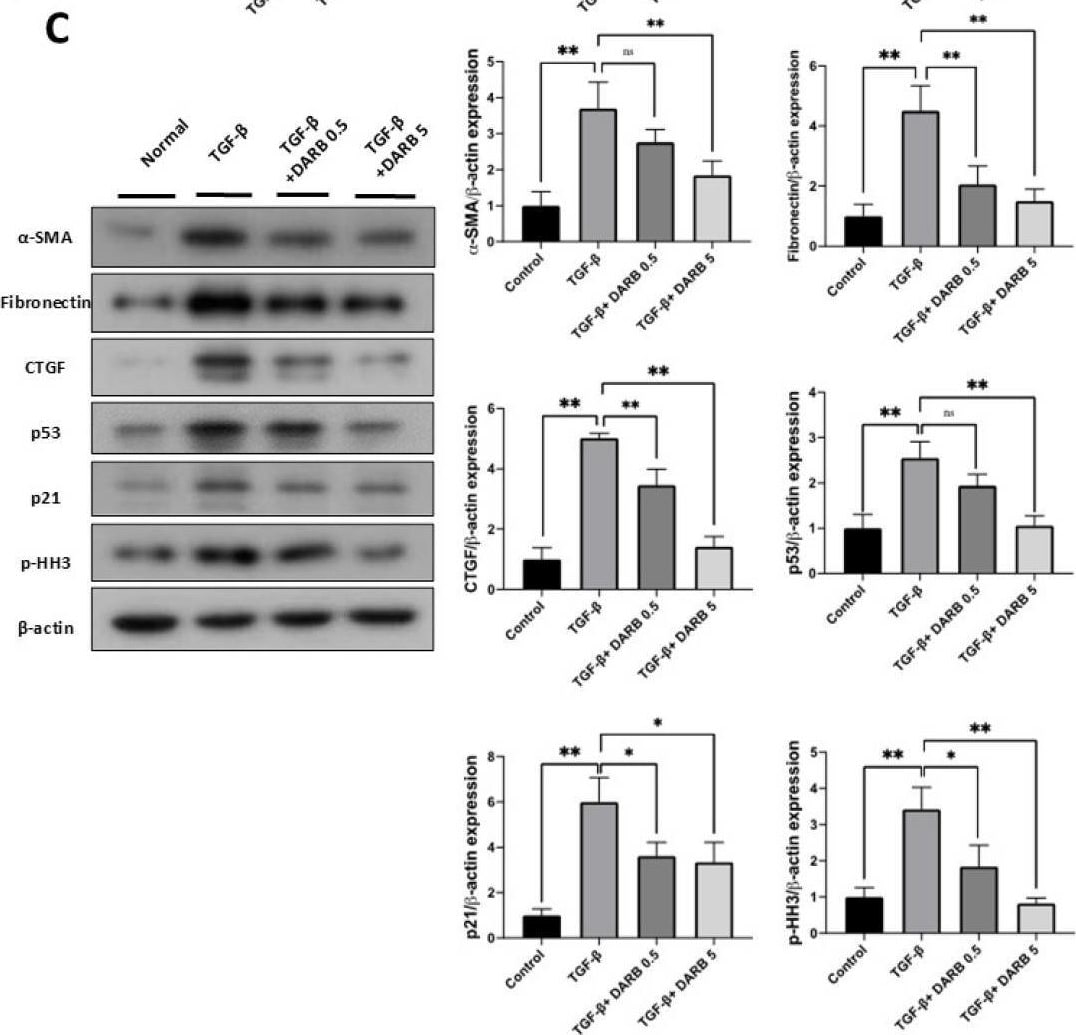
Detection of alpha-Smooth Muscle Actin by Western Blot
Protective effect of ESA against fibrotic changes in HK-2 cells. (A) mRNA expression of p53, p21, Cyclin B1, Cyclin D1, CTGF, and COL1A1 in HK-2 cells. After TGF-beta stimulation, the mRNA expression of profibrotic and G2/M cell cycle-related markers significantly increased; however, DARB dose-dependently reduced these levels. (B) Immunofluorescence staining of alpha -SMA, E-cadherin, and collagen in TGF-beta -treated HK-2 cells with or without DARB. (C) Immunoblot analysis of profibrotic proteins, including alpha -SMA, fibronectin, and CTGF as well as G2/M phase-related markers including p53, p21, and p-HH3 in TGF-beta -treated HK-2 cells with or without DARB. Data are expressed as mean ± SD; Magnification ×40; * p < 0.05, ** p < 0.001, ns, not significant. Image collected and cropped by CiteAb from the following open publication (https://pubmed.ncbi.nlm.nih.gov/41227308), licensed under a CC-BY license. Not internally tested by R&D Systems.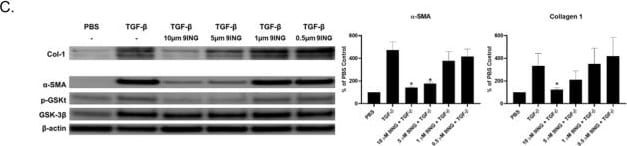
Detection of alpha-Smooth Muscle Actin by Western Blot
9-ING-41 blocks TGF-beta mediated fibroblast to myofibroblast transition. Fibroblasts (normal, A,B and IPF, C,D) were treated with various doses of 9-ING-41 (10-0.5 µM) in serum free media. Cells were then treated with TGF-beta for 48 h. Conditioned medias and cell lysates were then resolved by SDS-PAGE and immunoblotted for collagen (Col-1), alpha -SMA, GSK-3 beta, and tyrosine-216 phosphorylated GSK-3 beta. Under control conditions, TGF-beta induced Col-1 and alpha -SMA protein in NF and IPF fibroblasts (A and C). 9-ING-41 (10 and 5 µM) significantly blocked TGF-beta mediated induction of alpha -SMA and Col-1 in NF and IPF cells. Tyr-216 phosphorylation of GSK-3 beta (pGSKt) was likewise reduced by pretreatment with 9-ING-41 in both NF and IPF fibroblasts. Graphed data are the means of n = 3 independent experiments. Images are representative of 3–4 independent experiments. Total RNA was isolated from TGF-beta treated cells in the presence or absence varying doses 9-ING-41 (10–0.5 µM). Changes in alpha -SMA and collagen 1 expression were then determined by qPCR analyses (B and D). GAPDH was used as the reference gene. Data are expressed as mean ± SEM. n = 3 independent experiments. *Denotes p < 0.05 compared to TGF-beta control. Normal (E) and IPF (F) fibroblasts were treated with varying doses of TDZD-8 (40-5 µM) prior to the addition of TGF-beta. Cell lysates and conditioned media were then resolved via SDS-PAGE and probed for changes alpha -SMA and collagen. beta -actin was the loading control. TDZD-8 modestly reduced alpha -SMA and collagen induction by TGF-beta at the highest dose (40 µM). Images are representative of two independent experiments. Image collected and cropped by CiteAb from the following open publication (https://pubmed.ncbi.nlm.nih.gov/31831767), licensed under a CC-BY license. Not internally tested by R&D Systems.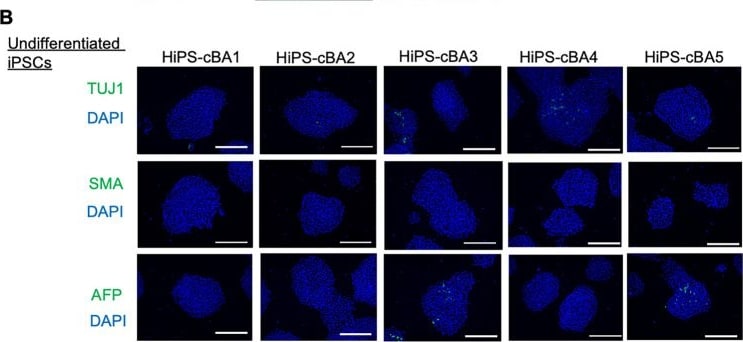
Detection of alpha-Smooth Muscle Actin by Immunocytochemistry/ Immunofluorescence
Pluripotency of hiPSC lines derived from cystic BA patients. A Immunocytochemistry of TUJ1, SMA, and AFP on embryoid bodies (EBs) differentiated from BA-specific hiPSCs. Scale bars, 200 µm. B Immunocytochemistry of TUJ1, SMA, and AFP on undifferentiated cBA-hiPSCs. Scale bars, 200 µm. C Sections with hematoxylin and eosin (HE) staining on teratomas derived from cBA-hiPSCs. Neural rosettes, cartilages, or intestine-like secretion tissues are indicated as derivatives of ectoderm, mesoderm, or endoderm, respectively. Red rectangles are magnified regions. Scale bars, 200 µm Image collected and cropped by CiteAb from the following open publication (https://pubmed.ncbi.nlm.nih.gov/39532815), licensed under a CC-BY license. Not internally tested by R&D Systems.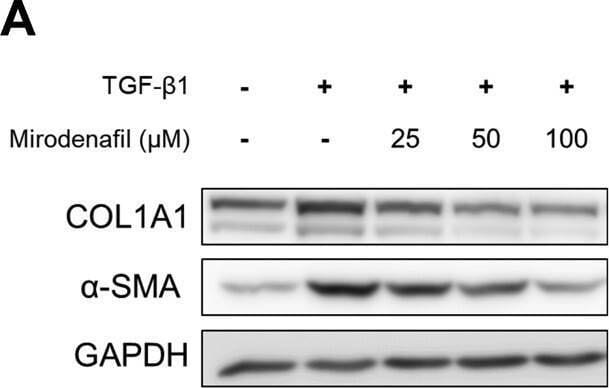
Detection of alpha-Smooth Muscle Actin by Western Blot
The anti-fibrotic effect of mirodenafil in human lung fibroblasts. (A) MRC-5 human fetal lung fibroblasts were treated with the indicated concentration of mirodenafil and human TGF-beta 1 (10 ng/ml) for 24 hr. The protein levels of COL1A1 and alpha -SMA were analyzed by western blot. (B) Data from western blots were quantified by densitometry. Data are presented as mean ± SD. *P < 0.05, **P < 0.01. Image collected and cropped by CiteAb from the following open publication (https://pubmed.ncbi.nlm.nih.gov/35059138), licensed under a CC-BY license. Not internally tested by R&D Systems.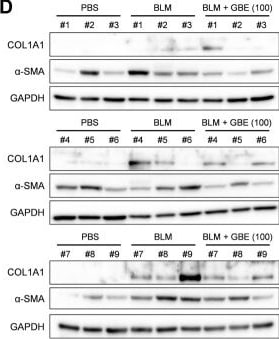
Detection of alpha-Smooth Muscle Actin by Western Blot
Ginkgo biloba extract (GBE) ameliorated skin fibrosis in bleomycin (BLM)-induced systemic sclerosis (SSc) mouse model. Mouse skin tissues were stained with hematoxylin and eosin (H&E) (A) and Masson’s trichrome (B) to visualize tissue morphology and collagen deposition, respectively. Original magnification: 40× or 100×. (C) The dermal thickness of each group (n = 9) was quantified. (D) The lesioned skins were analyzed by western blot to detect COL1A1 and alpha -SMA. GAPDH was used as loading control. BLM + GBE (100 mg/kg) group was used for the western blot analysis. (E and F) Band intensities from the western blot images were quantified by densitometry and the relative protein expression levels were compared with the PBS group. Data are presented as mean ± standard error of the mean (SEM). P-values were calculated using one-way ANOVA with Dunnett's post hoc test compared with the BLM group. *P < 0.05, ***P < 0.001. PBS, 1× DPBS injection group; BLM, Bleomycin injection group; BLM + GBE (100), Bleomycin injection and GBE (100 mg/kg) treatment group; BLM + GBE (200), Bleomycin injection and GBE (200 mg/kg) treatment group. Image collected and cropped by CiteAb from the following open publication (https://pubmed.ncbi.nlm.nih.gov/38645438), licensed under a CC-BY license. Not internally tested by R&D Systems.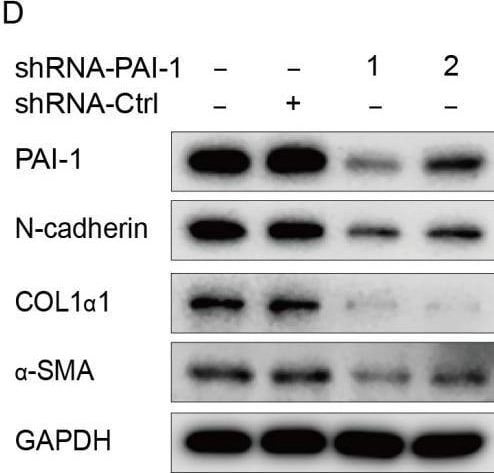
Detection of alpha-Smooth Muscle Actin by Western Blot
PAI-1 regulates the activation of LX-2 cells involving EMT pathway. (A) Relative mRNA expression of PAI-1 in LX-2 cells when treated with eupatilin (mean ± SD, n = 3). (B) Western blot analysis of PAI-1 in LX-2 cells. (C) Relative protein signal intensity of Figure 4B was quantified as mean ± standard deviation (mean ± SD, n = 3). (D) Protein levels of PAI-1, N-cadherin, COL1 alpha 1 and alpha -SMA detected by Western blotting. LX-2 cells were transfected with control (shRNA-Ctrl) or shRNA targeting PAI-1 (shRNA-PAI-1 1 and shRNA-PAI-1 2) for 48 h. (E) Relative protein signal intensity of Figure 4D was quantified as mean ± standard deviation (mean ± SD, n = 3). (F) Cell viability of LX-2 cells transfected with shRNA-Ctrl or shRNA-PAI-1 detected by CCK8 assay (mean ± SD, n = 4). p values are calculated by one-way ANOVA followed by the Tukey’s test. ** p < 0.01 and *** p < 0.001 vs. 0 μM EUP group. #p < 0.05, ##p < 0.01 and ###p < 0.001 vs. shRNA-Ctrl group. EUP: Eupatilin; alpha -SMA: alpha -smooth muscle actin; COL1 alpha 1: Collagen type I alpha 1; PAI-1: Plasminogen activator inhibitor-1; GAPDH: Glyceraldehyde-3-phosphate dehydrogenase. Image collected and cropped by CiteAb from the following open publication (https://www.mdpi.com/1422-0067/24/6/5933), licensed under a CC-BY license. Not internally tested by R&D Systems.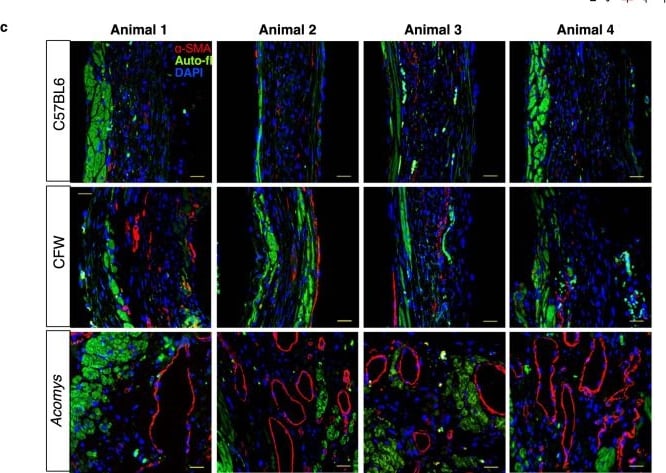
Detection of alpha-Smooth Muscle Actin by Immunohistochemistry
Enhanced angiogenesis and vessel maturation in the infarct region following MI in Acomys compared to Mus strains.a Representative images of CD31 staining (red) defining endothelial cells in the peri-infarct region and the center of the scar at the left ventricular cavity level of Mus (C57BL6 and CFW) and Acomys 50 days post-MI (scale bar = 25 μm). Quantification of capillary density showing significantly higher capillary density in Acomys compared to Mus-C57BL6 in the peri-infarct region and to both Mus strains in the center of the scar (N = 4 Mus-C57BL6, 4 Mus-CFW, and 5 Acomys, values are means ± S.E.M, ***P < 0.001 and ****P < 0.0001 by one-way ANOVA and Tukey’s multiple comparison test). b Representative images of CD31 (green, pseudocolored) and EdU staining (magenta) marking proliferating endothelial cells in the peri-infarct region and the center of the scar in Mus (C57BL6, left, and CFW, center) and Acomys (right) 17 days post-MI (scale bar = 25 μm). Insets show higher magnification of vascular structures. Quantification of percentage of CD31+ cells expressing EdU, showing significantly higher endothelial cell proliferation in Acomys compared to the two Mus strains in both peri-infarct and scar center areas (N = 4 Mus-C57BL6, 4 Mus-CFW, and 5 Acomys, values are means ± S.E.M, ****P < 0.0001 by one-way ANOVA and Tukey’s multiple comparison test). c Representative images of smooth muscle actin staining (red) in the scar center region showing higher prevalence of medium-sized blood vessels in Acomys compared to Mus strains. Autofluorescence (green) was used to identify the infarct boundary (images shown from 4 animals/group, scale bar = 25 μm). Image collected and cropped by CiteAb from the following open publication (https://pubmed.ncbi.nlm.nih.gov/34789749), licensed under a CC-BY license. Not internally tested by R&D Systems.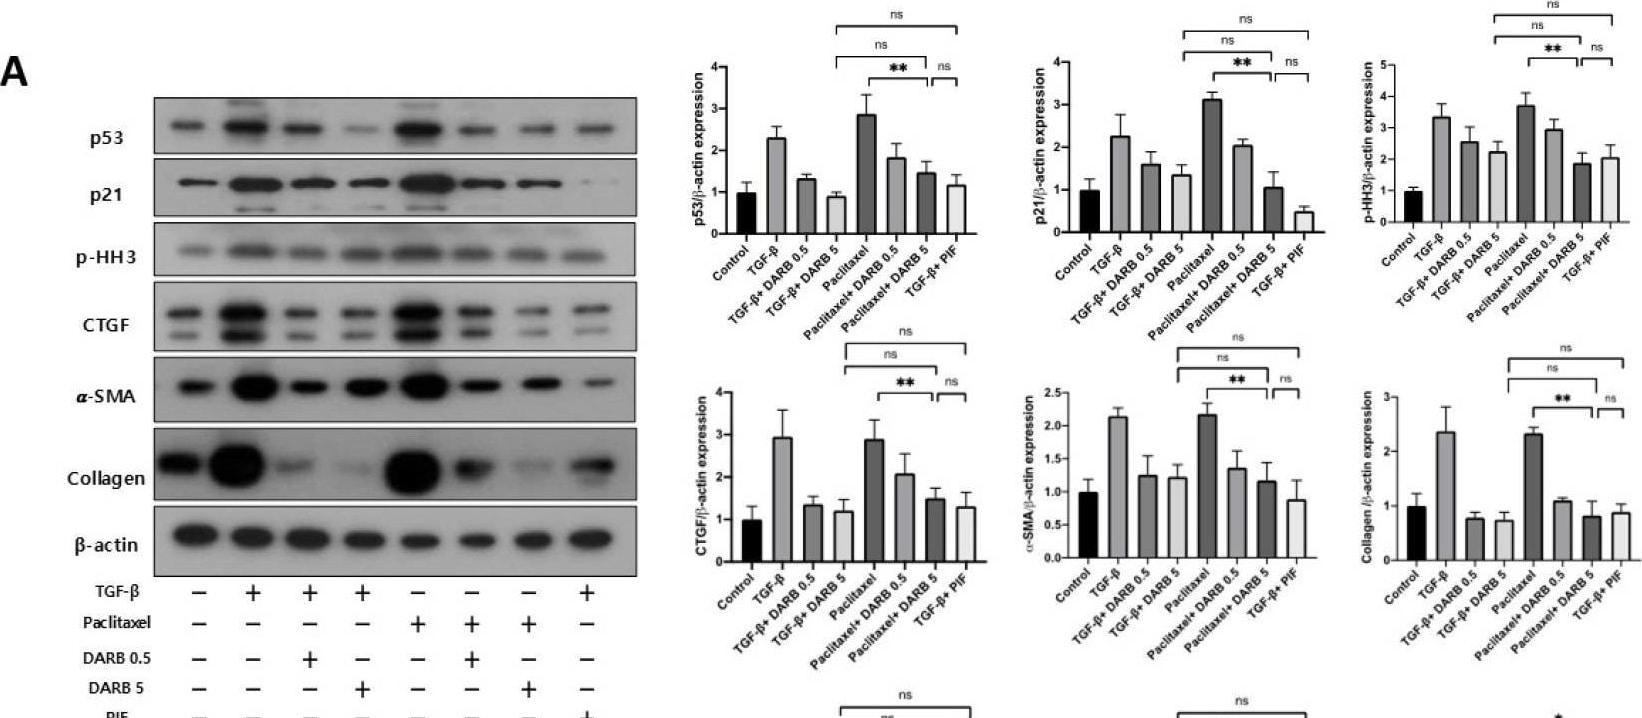
Detection of alpha-Smooth Muscle Actin by Western Blot
Comparison of anti-fibrotic effects of ESA and the p53 inhibitor. (A) In HK-2 cells stimulated with paclitaxel, DARB significantly attenuated the protein expression of p53 and p21. It may be inferred that the number of G2/M-arrested cells was decreased through the p53-p21 pathway. This finding was supported by the protein expression of p-HH3. Similar trends were observed in the expression of CTGF, alpha -SMA, and collagen. (B) In HK-2 cells treated with paclitaxel, protein expressions of p-CDK1, Cyclin B1, Cyclin D1, TIMP2, and IGFBP7 showed results similar to those of HK-2 cells treated with TGF-beta. DARB administration significantly decreased the expression of these proteins. (C) Immunoblot analysis of p-JNK, p-p38/p38, and p-ERK1/2/ERK1/2. After DARB administration, JNK and p38-MAPK signaling pathways, which contribute to kidney fibrosis, were significantly decreased in HK-2 cells stimulated with TGF-beta or paclitaxel. Considering these results, the effects of DARB on anti-fibrotic activity, cell regulatory proteins, and the p38-MAPK pathway were comparable to those of a p53 inhibitor (PIF-alpha ). Data are expressed as mean ± SD. * p < 0.05; ** p < 0.001; ns, not significant. Image collected and cropped by CiteAb from the following open publication (https://pubmed.ncbi.nlm.nih.gov/41227308), licensed under a CC-BY license. Not internally tested by R&D Systems.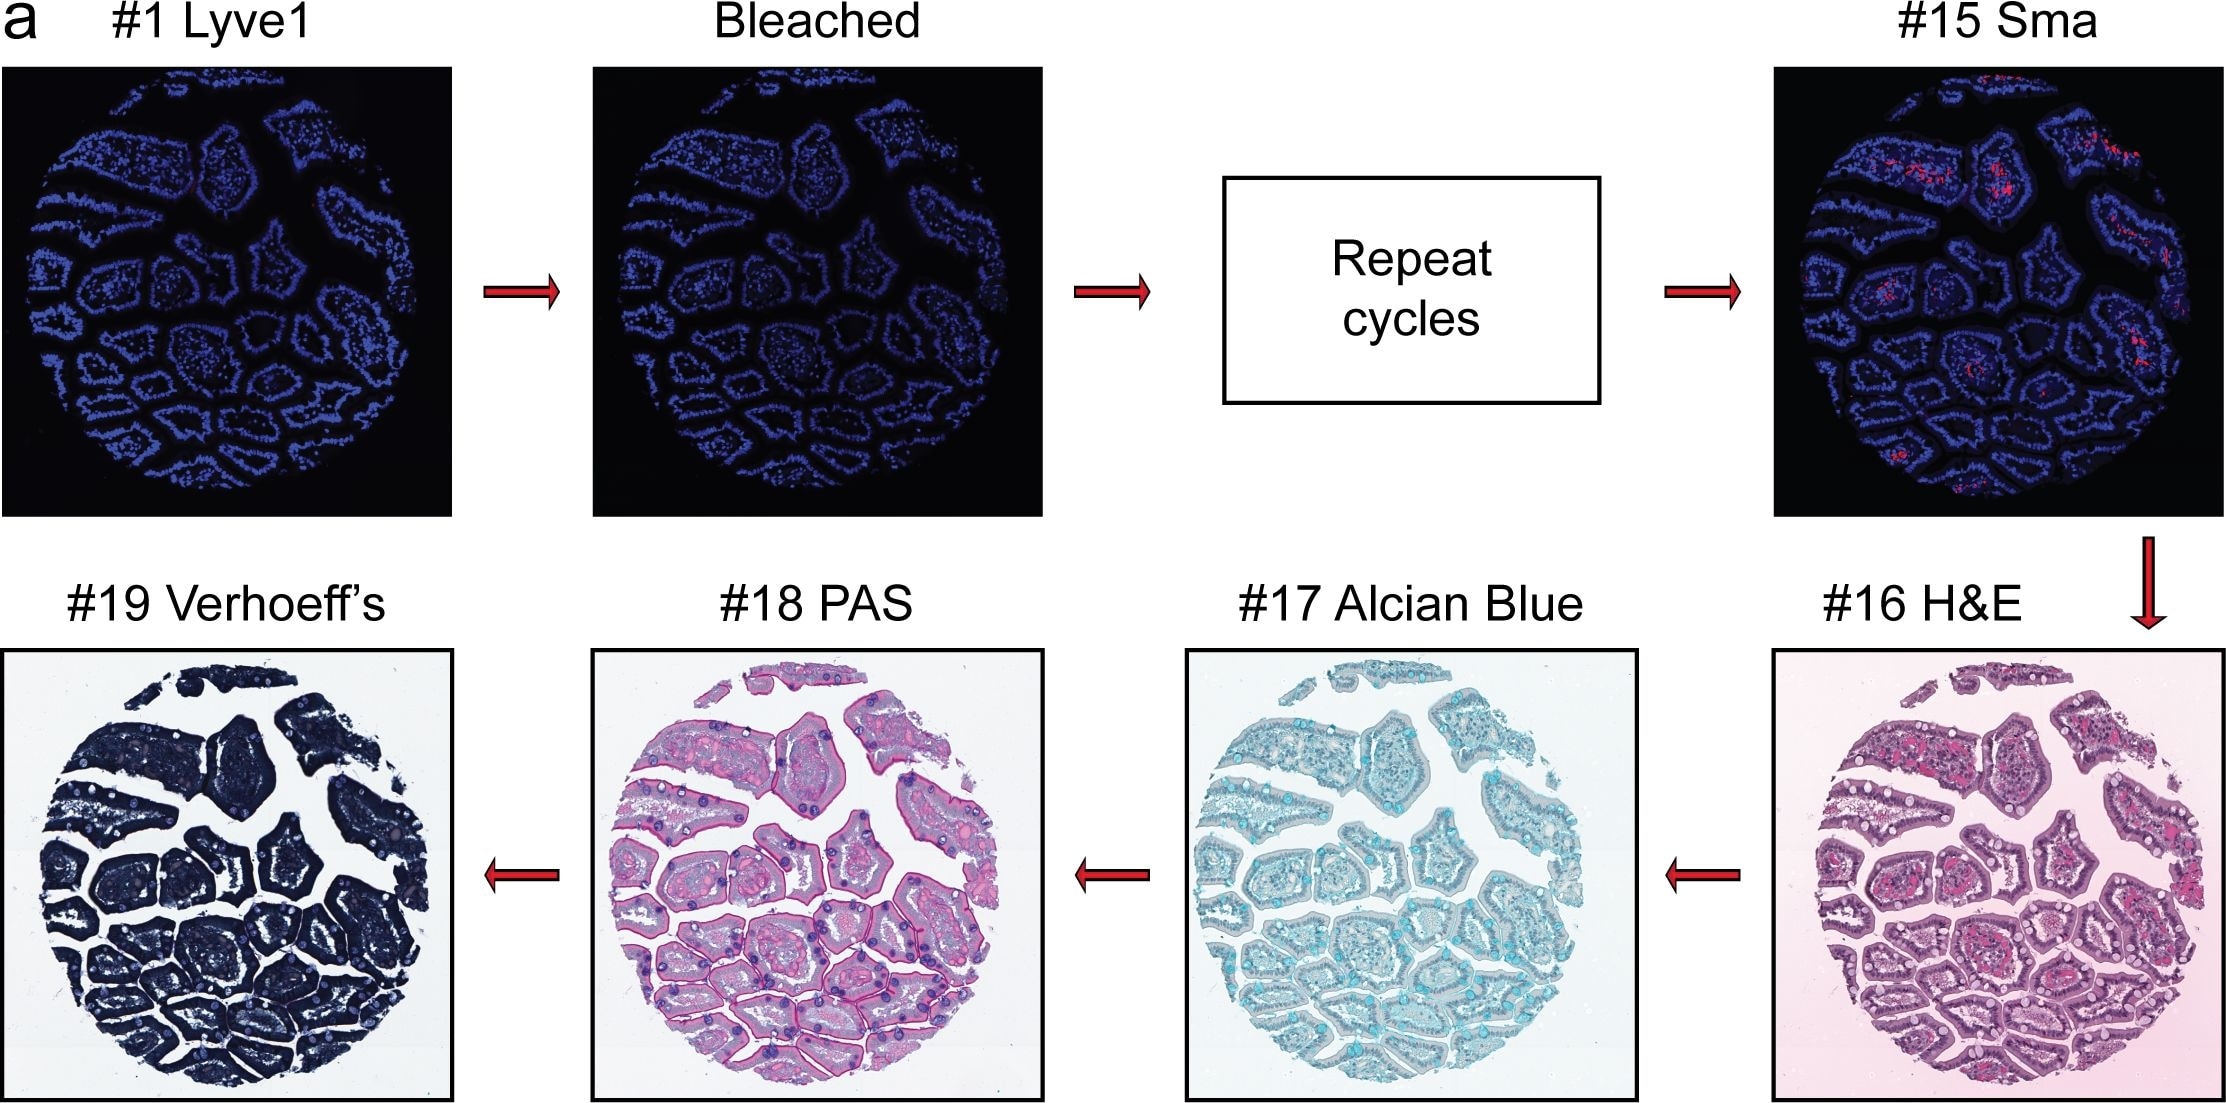
Detection of alpha-Smooth Muscle Actin by Immunohistochemistry
Overview of Multi-dimensional Microscopic Molecular Profiling (MMMP).The overall MMMP approach is depicted using an example tissue section from normal human duodenum (sample #1.9.7). (a) Slides were subjected to repeated cycles of staining and imaging with fluorescent primary antibodies and DAPI. At the end of each cycle, fluorescent signal was removed by a chemical bleaching process, and slides were again imaged, before proceeding to the next round of this iterative procedure. After the final antibody stain (#15 Sma), slides were analyzed with a series of histochemical stains. (b) A set of tiling images spanning each tissue section was initially generated by the microscope system. The tiling images were then computationally ‘stitched’ together to produce a single image per staining cycle for each sample. (c) Image registration was performed to align images from the same tissue section across cycles. Mean intensities of the DAPI signal from all immuno-fluorescence images are shown from before (Unregistered) and after (Registered) the image registration procedure was completed. (d) Following registration, signal intensities from the relevant channels for each image (columns) in the MMMP series were extracted for each pixel (rows) within the tissue section and compiled into a large data matrix of in situ molecular profiles. Image collected and cropped by CiteAb from the following open publication (https://pubmed.ncbi.nlm.nih.gov/26176839), licensed under a CC-BY license. Not internally tested by R&D Systems.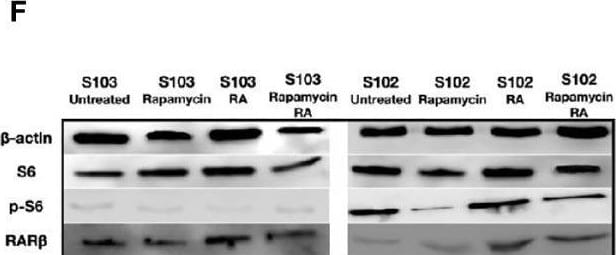
Detection of alpha-Smooth Muscle Actin by Western Blot
Restoration of RAR beta expression by RA. (A) mRNA expression levels of RAR beta are significantly increased in LAM cell lines (n=4) compared to controls BSMC and NHLF after 2 μM RA treatment for 24 h. Significant changes are marked as ★ (P<0.05). (B, C), Protein expression levels of RAR beta using immunofluorescence staining in LAM cell lines compared to controls (BSMC and NHLF) after 2 μM RA treatment for 24 h. Immunofluorescence staining RAR beta green, DAPI blue, magnification 40x, size-bar 40 μm. (D, E) Western blot analysis of RAR beta protein levels in LAM cell lines and control cells (NHLF and BSMC). (F, G) Western blot analysis of RAR beta, S6 and pS6 protein levels in S102 cell line compared to S103. WB protein expression levels were quantified by ImageJ and are presented as percentage compared to controls. Changes are marked as N.S. (Non Significant) or significant ★, ★★, ★★★ and ★★★★ (P<0.05, P<0.001, P<0.0002 and P<0.0001, respectively). Image collected and cropped by CiteAb from the following open publication (https://pubmed.ncbi.nlm.nih.gov/34178631), licensed under a CC-BY license. Not internally tested by R&D Systems.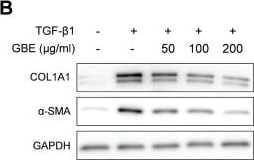
Detection of alpha-Smooth Muscle Actin by Western Blot
GBE downregulated the expression of fibrosis markers induced by TGF-beta. (A and B) Mouse embryonic fibroblasts (NIH3T3) (A) and normal human dermal fibroblasts (B) were treated with TGF-beta 1 (10 ng/ml) and GBE for 24 h. The protein levels of COL1A1 and alpha -SMA were analyzed by western blot. Beta-actin or GAPDH was used as a loading control for western blot. (C–H) NIH3T3 cells (C–E) and normal human dermal fibroblasts (F–H) were treated with TGF-beta 1 (10 ng/ml) and GBE for 24 h and the relative mRNA expression levels of COL1A1, alpha -SMA, and CTGF were analyzed by qPCR. GAPDH was used as a normalization control for qPCR. Data are presented as mean ± SEM. P-values were calculated using one-way ANOVA with Dunnett's post hoc test compared with TGF-beta 1 group. ***P < 0.001. Image collected and cropped by CiteAb from the following open publication (https://pubmed.ncbi.nlm.nih.gov/38645438), licensed under a CC-BY license. Not internally tested by R&D Systems.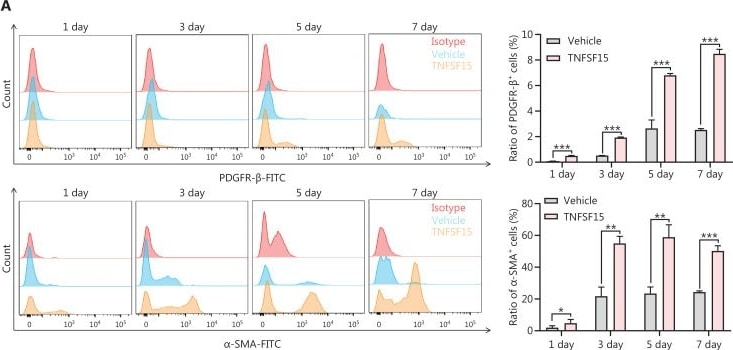
Detection of alpha-Smooth Muscle Actin by Flow Cytometry
TNFSF15 facilitates bone marrow-derived CD11b+ cell differentiation into pericytes. (A) Flow cytometric analysis (left) and statistical analysis (right) of PDGFR-beta + cells and alpha -SMA+ cells differentiated from vehicle- or TNFSF15-treated myeloid CD11b+ cells for 1, 3, 5, or 7 days. (B) Western blot analysis of the levels of PDGFR-beta, alpha -SMA, and Desmin in CD11b+ cells treated with vehicle or TNFSF15 for 3 days. (C–F) Typical images of immunofluorescence staining of CD11b+ cells treated with vehicle or TNFSF15 for 3 days. DAPI reagent was used to stain cell nuclei. Scale bar: 25 μm. Three visual fields of each tissue and 9 visual fields of each group were taken, and the number of cells was statistically analyzed according to the co-localization of nuclear DAPI and immunofluorescence. Data were analyzed with unpaired Student’s t-test and are presented as means ± SD (n = 3, *P < 0.05, **P < 0.01, ***P < 0.001). Flow cytometric analysis (G, I) and quantification (H, J) of alpha -SMA+ cells and NG2+ cells in CD11b+ cells treated with vehicle or TNFSF15 for 3 days. Data were analyzed with unpaired Student’s t-test and are presented as means ± SD (n = 3, *P < 0.05, **P < 0.01, ***P < 0.001). Image collected and cropped by CiteAb from the following open publication (https://pubmed.ncbi.nlm.nih.gov/37921408), licensed under a CC-BY license. Not internally tested by R&D Systems.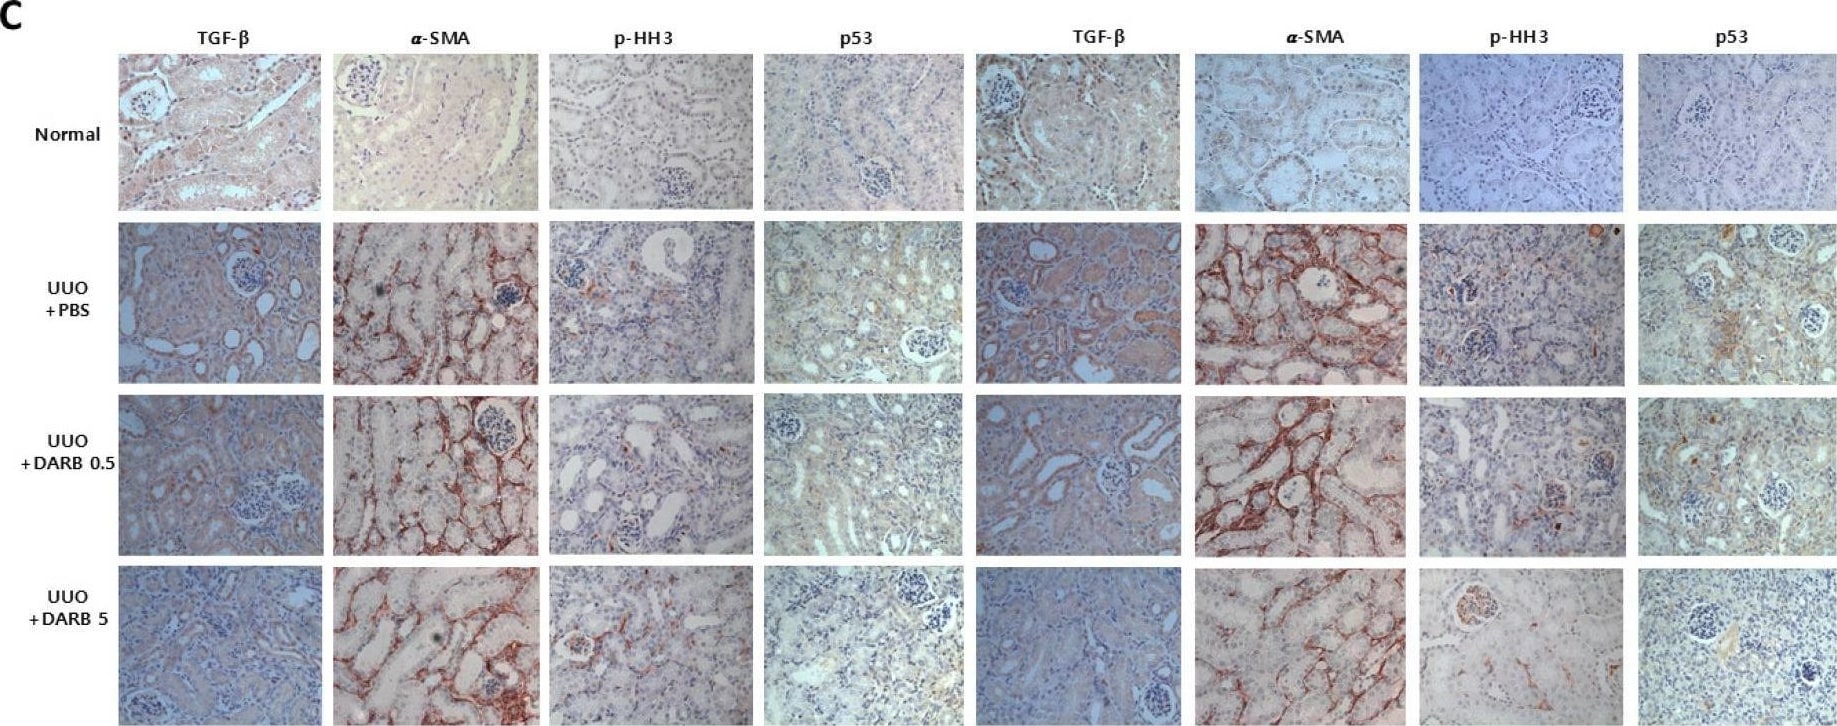
Detection of alpha-Smooth Muscle Actin by Immunohistochemistry
Protective effect of ESA against fibrotic changes in the UUO kidney. (A) mRNA expression of p53 and p21, which are associated with G2/M arrest, increased in UUO kidney sections but significantly decreased after DARB treatment. Kidney fibrosis-related markers, including TGFB, showed similar results. The levels of pro-inflammatory markers, such as CTGF and MCP-1, were nearly restored to normal levels following DARB treatment. COL1A1 and FN, the end-products of renal fibrosis, were attenuated by DARB treatment. (B) Protein levels of p53 and p21 were reduced by DARB treatment in UUO mouse model. The expression of p–HH3, collagen, and alpha -SMA were significantly decreased. The expression of TGF-beta decreased dose-dependently via DARB treatment. (C) Immunohistochemical findings of TGF-beta, alpha -SMA, p53, and p-Histone H3 staining. Quantitative analysis of (D) the TGF-beta -positive area (%), (E) alpha -SMA-positive area (%), (F) p-Histone H3-positive area (%), and (G) p53-positive area (%) showed that after UUO, DARB treatment tended to reduce the positive areas of TGF-beta, alpha -SMA, and p53, as well as decreased the percentage of G2/M phase-arrested cells in a dose-dependent manner. Data are expressed at the mean ± SD. N = 5–6 mice in each group; Magnification ×40; * p < 0.05, ** p < 0.001 vs. UUO + PBS. Image collected and cropped by CiteAb from the following open publication (https://pubmed.ncbi.nlm.nih.gov/41227308), licensed under a CC-BY license. Not internally tested by R&D Systems.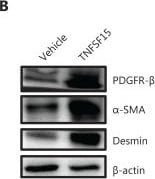
Detection of alpha-Smooth Muscle Actin by Western Blot
TNFSF15 facilitates bone marrow-derived CD11b+ cell differentiation into pericytes. (A) Flow cytometric analysis (left) and statistical analysis (right) of PDGFR-beta + cells and alpha -SMA+ cells differentiated from vehicle- or TNFSF15-treated myeloid CD11b+ cells for 1, 3, 5, or 7 days. (B) Western blot analysis of the levels of PDGFR-beta, alpha -SMA, and Desmin in CD11b+ cells treated with vehicle or TNFSF15 for 3 days. (C–F) Typical images of immunofluorescence staining of CD11b+ cells treated with vehicle or TNFSF15 for 3 days. DAPI reagent was used to stain cell nuclei. Scale bar: 25 μm. Three visual fields of each tissue and 9 visual fields of each group were taken, and the number of cells was statistically analyzed according to the co-localization of nuclear DAPI and immunofluorescence. Data were analyzed with unpaired Student’s t-test and are presented as means ± SD (n = 3, *P < 0.05, **P < 0.01, ***P < 0.001). Flow cytometric analysis (G, I) and quantification (H, J) of alpha -SMA+ cells and NG2+ cells in CD11b+ cells treated with vehicle or TNFSF15 for 3 days. Data were analyzed with unpaired Student’s t-test and are presented as means ± SD (n = 3, *P < 0.05, **P < 0.01, ***P < 0.001). Image collected and cropped by CiteAb from the following open publication (https://pubmed.ncbi.nlm.nih.gov/37921408), licensed under a CC-BY license. Not internally tested by R&D Systems.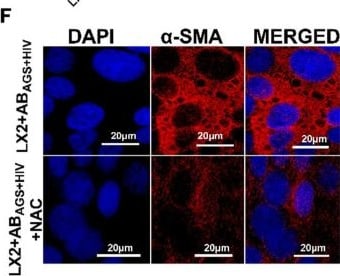
Detection of alpha-Smooth Muscle Actin by Immunocytochemistry/ Immunofluorescence
NAC treatment reverses or prevents profibrotic activation of LX2 cells by inhibition of ERK1/2 pathway: RT-PCR analysis of (A) TGF beta 2 mRNA and (B) TIMP1 mRNA. (C–E) Phopho-ERK1/2 and alpha -SMA were measured by immunoblot analysis and the quantification of immunoreactive blots. Equal amounts of protein (20 µg) were loaded in each lane. beta -actin was used as an internal control. (F) Immunofluorescent staining of alpha -SMA. Staining was visualized using a Keyence BZ-X810 fluorescence microscope. Pictures are representative data from three independent experiments. (G) Quantification of alpha -SMA by NIH ImageJ. Data are from 3 independent experiments presented as mean ± SEM. Bars with * are significantly different from each other (p ≤ 0.05). Image collected and cropped by CiteAb from the following open publication (https://www.mdpi.com/2079-7737/11/7/1059), licensed under a CC-BY license. Not internally tested by R&D Systems.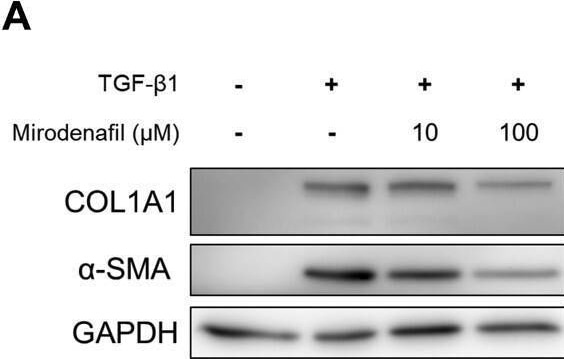
Detection of alpha-Smooth Muscle Actin by Western Blot
The anti-fibrotic effect of mirodenafil in mouse embryonic fibroblasts. NIH3T3 mouse embryonic fibroblasts were treated with the indicated concentration of mirodenafil and mouse transforming growth factor (TGF)-beta 1 (10 ng/ml) for 24 hr. The protein levels of COL1A1 and alpha -SMA were analyzed by western blot (A), and mRNA levels of Col1a1, alpha -SMA, and Ctgf were assessed by quantitative real-time polymerase chain reaction (qPCR) (B). GAPDH was used as loading control for western blot and normalization control for qPCR. Data are presented as mean ± SD. **P < 0.01, ***P < 0.001. Image collected and cropped by CiteAb from the following open publication (https://pubmed.ncbi.nlm.nih.gov/35059138), licensed under a CC-BY license. Not internally tested by R&D Systems.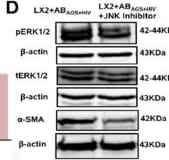
Detection of alpha-Smooth Muscle Actin by Western Blot
Attenuation of profibrotic markers in LX2 cells exposed to ABAGS+HIV by pharmacological inhibition of JNK pathway: RT-PCR analysis of (A) TGF beta 1 mRNA, (B) ACTA2 mRNA, and (C) COL1A1 mRNA. (D–F) Phopho-ERK1/2 and alpha -smooth muscle actin were measured by immunoblot analysis and immunoreactive blots were quantified. Equal amounts of protein (20 µg) were loaded in each lane. beta -actin was used as an internal control. (G) Immunofluorescent staining of alpha -smooth muscle actin. Staining was visualized using a Keyence BZ-X810 fluorescence microscope. Pictures are representative data from three independent experiments. (H) Quantification of SMA was measured using NIH ImageJ. Data are from 3 independent experiments presented as mean ± SEM. Bars marked with the same letter are not significantly different. Bars with * are significantly different from each other (p ≤ 0.05). Image collected and cropped by CiteAb from the following open publication (https://www.mdpi.com/2079-7737/11/7/1059), licensed under a CC-BY license. Not internally tested by R&D Systems.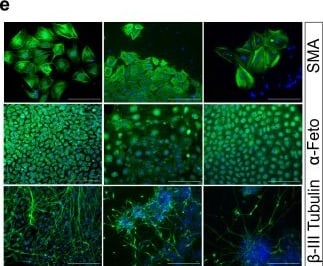
Detection of alpha-Smooth Muscle Actin by Immunocytochemistry/ Immunofluorescence
Generation and characterization of primate iPSCs. (a) Workflow for reprogramming of primate urinary cells. Urine collection and cell seeding is carried out in primary medium, then after 5 days changed to REMC medium, and only passaged for the first time after 10–14 days. When the cells reach confluency reprogramming is induced and after 5 days the medium is changed to mTeSR1. Once the reprogrammed cells are ready to be picked, the cells are seeded in StemFit medium. REMC renal epithelial mesenchymal cell medium. (b) Cell morphology of the three species is comparable before (p0), during (p1–3) and after reprogramming (~ p5). Scale bar represents 400 µm. (c) Immunofluorescence analysis of pluripotency associated proteins at passage 10–15: TRA-1-60, SSEA4, OCT4 and SOX2. Nuclei were counterstained with DAPI. Scale bars represent 200 µm. (d) Differentiation potency into the three germ layers. iPSC colony before differentiation, after 8 days of floating culture and after 8 days of attached culture. Scale bar represents 400 µm. (e) Immunofluorescence analyses of ectoderm ( beta -III Tubulin), mesoderm ( alpha -SMA) and endoderm markers ( alpha -Feto) after EB outgrowth. Nuclei were counterstained with DAPI. Scale bars represent 400 μm. See also Supplementary Figure S7a. Image collected and cropped by CiteAb from the following open publication (https://pubmed.ncbi.nlm.nih.gov/33568724), licensed under a CC-BY license. Not internally tested by R&D Systems.Applications for alpha-Smooth Muscle Actin Antibody (1A4)
Application
Recommended Usage
COMET
0.5 µg/mL
Sample: Immersion fixed paraffin-embedded sections of human breast cancer, prostate tumor, colon tumor and normal kidney tissue
Sample: Immersion fixed paraffin-embedded sections of human breast cancer, prostate tumor, colon tumor and normal kidney tissue
CyTOF-ready
Ready to be labeled using established conjugation methods. No BSA or other carrier proteins that could interfere with conjugation.
Dual RNAscope ISH-IHC Compatible
0.5-25 µg/mL
Sample: Immersion fixed paraffin-embedded sections of human breast cancer tissue
Sample: Immersion fixed paraffin-embedded sections of human breast cancer tissue
Immunocytochemistry
8-25 µg/mL
Sample: Immersion fixed BG01V human embryonic stem cells differentiated to cardiomyocytes
Sample: Immersion fixed BG01V human embryonic stem cells differentiated to cardiomyocytes
Immunohistochemistry
3-25 µg/mL
Sample: Immersion fixed paraffin-embedded sections of human breast cancer tissue
Sample: Immersion fixed paraffin-embedded sections of human breast cancer tissue
Intracellular Staining by Flow Cytometry
0.25 µg/106 cells
Sample: Human peripheral blood monocytes fixed with Flow Cytometry Fixation Buffer (Catalog # FC004) and permeabilized with Flow Cytometry Permeabilization/Wash Buffer I (Catalog # FC005)
Sample: Human peripheral blood monocytes fixed with Flow Cytometry Fixation Buffer (Catalog # FC004) and permeabilized with Flow Cytometry Permeabilization/Wash Buffer I (Catalog # FC005)
Simple Western
10 µg/mL
Sample: iBJ6 human induced pluripotent stem cell line differentiated to cardiomyocytes
Sample: iBJ6 human induced pluripotent stem cell line differentiated to cardiomyocytes
Western Blot
0.1-0.25 µg/mL
Sample: Human heart tissue, cardiac differentiated iBJ6 human induced pluripotent stem cell line, mouse colon tissue, C2C12 mouse myoblast cell line, NIH‑3T3 mouse embryonic fibroblast cell line, and rat colon tissue
Sample: Human heart tissue, cardiac differentiated iBJ6 human induced pluripotent stem cell line, mouse colon tissue, C2C12 mouse myoblast cell line, NIH‑3T3 mouse embryonic fibroblast cell line, and rat colon tissue
Reviewed Applications
Read 15 reviews rated 4.9 using MAB1420 in the following applications:
Flow Cytometry Panel Builder
Bio-Techne Knows Flow Cytometry
Save time and reduce costly mistakes by quickly finding compatible reagents using the Panel Builder Tool.
Advanced Features
- Spectra Viewer - Custom analysis of spectra from multiple fluorochromes
- Spillover Popups - Visualize the spectra of individual fluorochromes
- Antigen Density Selector - Match fluorochrome brightness with antigen density

Formulation, Preparation, and Storage
Purification
Protein A or G purified from hybridoma culture supernatant
Reconstitution
Reconstitute at 0.5 mg/mL in sterile PBS. For liquid material, refer to CoA for concentration.
Loading...
Formulation
Lyophilized from a 0.2 μm filtered solution in PBS with Trehalose. See Certificate of Analysis for details.<br/>*Small pack size (-SP) is supplied either lyophilized or as a 0.2 µm filtered solution in PBS.
Shipping
Lyophilized product is shipped at ambient temperature. Liquid small pack size (-SP) is shipped with polar packs. Upon receipt, store immediately at the temperature recommended below.
Stability & Storage
Use a manual defrost freezer and avoid repeated freeze-thaw cycles.
- 12 months from date of receipt, -20 to -70 °C as supplied.
- 1 month, 2 to 8 °C under sterile conditions after reconstitution.
- 6 months, -20 to -70 °C under sterile conditions after reconstitution.
Calculators
Background: alpha-Smooth Muscle Actin
References
- Skalli, O. et al. (1986) J. Cell Biol. 103:2787.
- Oishi, K. et al. (2002) J. Physiol. 540:139.
Long Name
Actin, Alpha 2, Smooth Muscle, Aorta
Alternate Names
AAT6, ACTA2, Actin alpha 2, ACTSA, ACTVS, alphaSmooth Muscle Actin, MYMY5, SMA
Gene Symbol
ACTA2
Additional alpha-Smooth Muscle Actin Products
Product Documents for alpha-Smooth Muscle Actin Antibody (1A4)
Certificate of Analysis
To download a Certificate of Analysis, please enter a lot or batch number in the search box below.
Note: Certificate of Analysis not available for kit components.
Product Specific Notices for alpha-Smooth Muscle Actin Antibody (1A4)
For research use only
Related Research Areas
Citations for alpha-Smooth Muscle Actin Antibody (1A4)
 Powered by Bioz
Customer Reviews for alpha-Smooth Muscle Actin Antibody (1A4) (15)
4.9 out of 5
15 Customer Ratings
Have you used alpha-Smooth Muscle Actin Antibody (1A4)?
Submit a review and receive an Amazon gift card!
$25/€18/£15/$25CAN/¥2500 for a review with an image
$10/€7/£6/$10CAN/¥1110 for a review without an image
Submit a review
Customer Images



Showing
1
-
5 的
15 reviews
Showing All
Filter By:
-
Application: ImmunofluorescenceSample Tested: Lung tissueSpecies: MouseVerified Customer | Posted 09/08/2025IF staining with a-sma in mouse lung tissue to visualize vessels, 10xI stained mouse lung tissue with a-sma to detect vessels and bronchi

-
Application: Simple WesternSample Tested: mouse smooth muscle cells (mSMC)Species: MouseVerified Customer | Posted 08/07/2024Alpha SMA in mouse ACTA2+ cells after FACSMilk antibody diluent, 1:10
-
Application: Immunocytochemistry/ImmunofluorescenceSample Tested: Mesenchymal stem cellsSpecies: HumanVerified Customer | Posted 08/24/2023Works well at a dilution of 1:500 for IF experiments
-
Application: Western BlotSample Tested: Endothelial cellsSpecies: MouseVerified Customer | Posted 10/19/2021
-
Application: ImmunohistochemistrySample Tested: Testicular tissueSpecies: MouseVerified Customer | Posted 08/10/2021
-
Application: ImmunohistochemistrySample Tested: Muscle tissueSpecies: MouseVerified Customer | Posted 08/04/2021
-
Application: ImmunohistochemistrySample Tested: Breast cancer tissueSpecies: HumanVerified Customer | Posted 02/19/2019
-
Application: Western BlotSample Tested: HEK293 human embryonic kidney cell lineSpecies: HumanVerified Customer | Posted 07/21/2018
-
Application: Immunocytochemistry/ImmunofluorescenceSample Tested: HMVEC human microvascular endothelial cellsSpecies: HumanVerified Customer | Posted 12/28/2017
-
Application: Western BlotSample Tested: Skin tissueSpecies: MouseVerified Customer | Posted 10/20/2017
-
Application: Western BlotSample Tested: Lung tissueSpecies: MouseVerified Customer | Posted 10/20/2017The antibody works well for lung tissue of mouse.
-
Sample Tested: IHC on paraffin sectionsSpecies: RatVerified Customer | Posted 03/03/2017Control rat colon labeled with anti-SMA antibodies (1/1000) overnight, then anti-mouse Alexa 488 (1/1000) 2hrs. Used antigen retrieval (DAKO).
-
Application: ImmunofluorescenceSample Tested: See PMID 20682625Species: HumanVerified Customer | Posted 02/10/2015
-
Application: Flow CytometrySample Tested: See PMID 20682625Species: HumanVerified Customer | Posted 02/10/2015
-
Application: Flow CytometrySample Tested: See PMID 20682625Species: OtherVerified Customer | Posted 02/10/2015
There are no reviews that match your criteria.
Protocols
Find general support by application which include: protocols, troubleshooting, illustrated assays, videos and webinars.
- 7-Amino Actinomycin D (7-AAD) Cell Viability Flow Cytometry Protocol
- Antigen Retrieval Protocol (PIER)
- Antigen Retrieval for Frozen Sections Protocol
- Appropriate Fixation of IHC/ICC Samples
- Cellular Response to Hypoxia Protocols
- Chromogenic IHC Staining of Formalin-Fixed Paraffin-Embedded (FFPE) Tissue Protocol
- Chromogenic Immunohistochemistry Staining of Frozen Tissue
- ClariTSA™ Fluorophore Kits
- Detection & Visualization of Antibody Binding
- Extracellular Membrane Flow Cytometry Protocol
- Flow Cytometry Protocol for Cell Surface Markers
- Flow Cytometry Protocol for Staining Membrane Associated Proteins
- Flow Cytometry Staining Protocols
- Flow Cytometry Troubleshooting Guide
- Fluorescent IHC Staining of Frozen Tissue Protocol
- Graphic Protocol for Heat-induced Epitope Retrieval
- Graphic Protocol for the Preparation and Fluorescent IHC Staining of Frozen Tissue Sections
- Graphic Protocol for the Preparation and Fluorescent IHC Staining of Paraffin-embedded Tissue Sections
- Graphic Protocol for the Preparation of Gelatin-coated Slides for Histological Tissue Sections
- ICC Cell Smear Protocol for Suspension Cells
- ICC Immunocytochemistry Protocol Videos
- ICC for Adherent Cells
- IHC Sample Preparation (Frozen sections vs Paraffin)
- ISH-IHC Protocol for Chromogenic Detection on Formalin Fixed Paraffin Embedded (FFPE) Tissue
- Immunocytochemistry (ICC) Protocol
- Immunocytochemistry Troubleshooting
- Immunofluorescence of Organoids Embedded in Cultrex Basement Membrane Extract
- Immunofluorescent IHC Staining of Formalin-Fixed Paraffin-Embedded (FFPE) Tissue Protocol
- Immunohistochemistry (IHC) and Immunocytochemistry (ICC) Protocols
- Immunohistochemistry Frozen Troubleshooting
- Immunohistochemistry Paraffin Troubleshooting
- Intracellular Flow Cytometry Protocol Using Alcohol (Methanol)
- Intracellular Flow Cytometry Protocol Using Detergents
- Intracellular Nuclear Staining Flow Cytometry Protocol Using Detergents
- Intracellular Staining Flow Cytometry Protocol Using Alcohol Permeabilization
- Intracellular Staining Flow Cytometry Protocol Using Detergents to Permeabilize Cells
- Preparing Samples for IHC/ICC Experiments
- Preventing Non-Specific Staining (Non-Specific Binding)
- Primary Antibody Selection & Optimization
- Propidium Iodide Cell Viability Flow Cytometry Protocol
- Protocol for Heat-Induced Epitope Retrieval (HIER)
- Protocol for Liperfluo
- Protocol for Making a 4% Formaldehyde Solution in PBS
- Protocol for VisUCyte™ HRP Polymer Detection Reagent
- Protocol for the Characterization of Human Th22 Cells
- Protocol for the Characterization of Human Th9 Cells
- Protocol for the Fluorescent ICC Staining of Cell Smears - Graphic
- Protocol for the Fluorescent ICC Staining of Cultured Cells on Coverslips - Graphic
- Protocol for the Preparation & Fixation of Cells on Coverslips
- Protocol for the Preparation and Chromogenic IHC Staining of Frozen Tissue Sections
- Protocol for the Preparation and Chromogenic IHC Staining of Frozen Tissue Sections - Graphic
- Protocol for the Preparation and Chromogenic IHC Staining of Paraffin-embedded Tissue Sections
- Protocol for the Preparation and Chromogenic IHC Staining of Paraffin-embedded Tissue Sections - Graphic
- Protocol for the Preparation and Fluorescent ICC Staining of Cells on Coverslips
- Protocol for the Preparation and Fluorescent ICC Staining of Non-adherent Cells
- Protocol for the Preparation and Fluorescent ICC Staining of Stem Cells on Coverslips
- Protocol for the Preparation and Fluorescent IHC Staining of Frozen Tissue Sections
- Protocol for the Preparation and Fluorescent IHC Staining of Paraffin-embedded Tissue Sections
- Protocol for the Preparation of Gelatin-coated Slides for Histological Tissue Sections
- Protocol for the Preparation of a Cell Smear for Non-adherent Cell ICC - Graphic
- Protocol: Annexin V and PI Staining by Flow Cytometry
- Protocol: Annexin V and PI Staining for Apoptosis by Flow Cytometry
- R&D Systems Quality Control Western Blot Protocol
- TUNEL and Active Caspase-3 Detection by IHC/ICC Protocol
- The Importance of IHC/ICC Controls
- Troubleshooting Guide: Fluorokine Flow Cytometry Kits
- Troubleshooting Guide: Immunohistochemistry
- Troubleshooting Guide: Western Blot Figures
- Western Blot Conditions
- Western Blot Protocol
- Western Blot Protocol for Cell Lysates
- Western Blot Troubleshooting
- Western Blot Troubleshooting Guide
- View all Protocols, Troubleshooting, Illustrated assays and Webinars
FAQs for alpha-Smooth Muscle Actin Antibody (1A4)
Showing
1
-
1 的
1 FAQ
Showing All
-
Q: Human/Mouse/Rat alpha-Smooth Muscle Actin Antibody, Catalog # MAB1420, is validated for Human/Mouse/Rat IHC, but the datasheet only has Human IHC examples. Was there testing on Mouse and Rat IHC samples?
A: Mouse and Rat samples were tested in Western Blot. We did not perform testing with Mouse or Rat IHC samples, however there are several citations for IHC using Mouse and Rat tissue on our webpage.
Loading...
Associated Pathways
