LC3A Antibody - BSA Free
Novus Biologicals | Catalog # NB100-2331
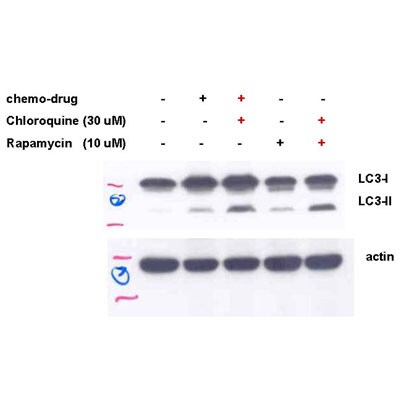
![Western Blot: LC3A AntibodyBSA Free [NB100-2331]](https://resources.rndsystems.com/images/products/LC3A-Antibody---BSA-Free-Western-Blot-NB100-2331-img0041.jpg "Western Blot: LC3A AntibodyBSA Free [NB100-2331]")
Key Product Details
Validated by
Biological Validation
Species Reactivity
Validated:
Human, Mouse, Rat, Amphibian, Canine, Fish, Plant, Zebrafish
Cited:
Human, Mouse, Rat, Amphibian, Bovine, Canine, Fish, Fish - Danio rerio (Zebrafish), Plant, SARS-CoV
Predicted:
Bovine (100%). Backed by our 100% Guarantee.
Applications
Validated:
Immunohistochemistry, Immunohistochemistry-Paraffin, Immunohistochemistry-Frozen, Immunohistochemistry Whole-Mount, Western Blot, Immunoblotting, ELISA, Flow Cytometry, Immunocytochemistry/ Immunofluorescence, Simple Western, Immunoprecipitation, Chromatin Immunoprecipitation, Chromatin Immunoprecipitation (ChIP), Southern Blot
Cited:
Immunohistochemistry-Paraffin, Immunohistochemistry-Frozen, Immunohistochemistry Whole-Mount, Western Blot, Immunoblotting, ELISA, Flow Cytometry, Immunocytochemistry/ Immunofluorescence, Immunoprecipitation, Chemotaxis, IF/IHC
Label
Unconjugated
Antibody Source
Polyclonal Rabbit IgG
Format
BSA Free
Loading...
Product Specifications
Immunogen
This LC3A Antibody was prepared from a synthetic peptide made to an internal portion of the human LC3 protein sequence (between residues 25-121). [Uniprot: Q9H492].
Reactivity Notes
Use in Rat reported in scientific literature (PMID:33678798). Use in Amphibian reported in scientific literature (PMID:29777142).
Localization
LC3-I is cytoplasmic. LC3-II binds to the autophagic membranes.
Marker
Autophagosome Marker
Specificity
This LC3A Antibody detects both LC3A and LC3B.
Clonality
Polyclonal
Host
Rabbit
Isotype
IgG
Scientific Data Images for LC3A Antibody - BSA Free
Western Blot: LC3A AntibodyBSA Free [NB100-2331]
LC3A-Antibody---BSA-Free-Western-Blot-NB100-2331-img0041.jpg![Immunocytochemistry/ Immunofluorescence: LC3A Antibody - BSA Free [NB100-2331]](https://resources.rndsystems.com/images/products/LC3A-Antibody---BSA-Free-Immunocytochemistry-Immunofluorescence-NB100-2331-img0046.jpg "Immunocytochemistry/ Immunofluorescence: LC3A Antibody - BSA Free [NB100-2331]")
Immunocytochemistry/ Immunofluorescence: LC3A Antibody - BSA Free [NB100-2331]
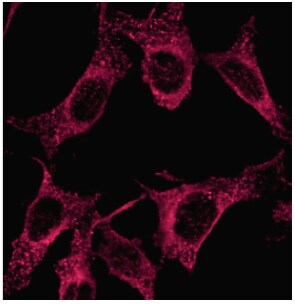
Immunocytochemistry/Immunofluorescence: LC3A Antibody - BSA Free [NB100-2331] - LC3A Antibody [NB100-2331] - Analysis in PFA fixed NIH/3T3 cells using anti-LC3A antibody. Image from verified customer review.![Immunohistochemistry: LC3A Antibody - BSA Free [NB100-2331]](https://resources.rndsystems.com/images/products/LC3A-Antibody---BSA-Free-Immunohistochemistry-NB100-2331-img0045.jpg "Immunohistochemistry: LC3A Antibody - BSA Free [NB100-2331]")
Immunohistochemistry: LC3A Antibody - BSA Free [NB100-2331]
Immunohistochemistry: LC3A Antibody - BSA Free [NB100-2331] - LC3A Antibody [NB100-2331] - Staining in mouse meniscus and cartilage. Image from verified customer review.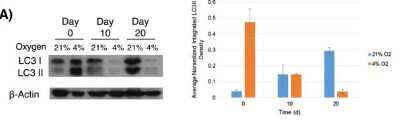
LC3A Antibody - BSA Free-Western Blot-NB100-2331-img0047.jpg
![Western Blot: LC3A AntibodyBSA Free [NB100-2331]](https://resources.rndsystems.com/images/products/LC3A-Antibody---BSA-Free-Western-Blot-NB100-2331-img0036.jpg "Western Blot: LC3A AntibodyBSA Free [NB100-2331]")
Western Blot: LC3A AntibodyBSA Free [NB100-2331]
LC3A-Antibody---BSA-Free-Western-Blot-NB100-2331-img0036.jpg![Western Blot: LC3A AntibodyBSA Free [NB100-2331]](https://resources.rndsystems.com/images/products/LC3A-Antibody---BSA-Free-Western-Blot-NB100-2331-img0037.jpg "Western Blot: LC3A AntibodyBSA Free [NB100-2331]")
Western Blot: LC3A AntibodyBSA Free [NB100-2331]
Western Blot: LC3A Antibody - BSA Free [NB100-2331] - LC3A Antibody [NB100-2331] - This LC3A antibody Image shows Analysis in human cell lysates.![Western Blot: LC3A AntibodyBSA Free [NB100-2331]](https://resources.rndsystems.com/images/products/LC3A-Antibody---BSA-Free-Western-Blot-NB100-2331-img0039.jpg "Western Blot: LC3A AntibodyBSA Free [NB100-2331]")
Western Blot: LC3A AntibodyBSA Free [NB100-2331]
Western Blot: LC3A Antibody - BSA Free [NB100-2331] - LC3A Antibody [NB100-2331] - This LC3A antibody Image shows analysis of heart tissue lysates from mice which were subjected or not to 48 hours of starvation. The signal was developed using ECL method and this LC3 antibody was found to detect both forms of LC3, i.e. LC3A and LC3B. As expected, the levels of LC3B form were higher in the heart tissue lysates from starved mice.![Western Blot: LC3A AntibodyBSA Free [NB100-2331]](https://resources.rndsystems.com/images/products/LC3A-Antibody---BSA-Free-Western-Blot-NB100-2331-img0040.jpg "Western Blot: LC3A AntibodyBSA Free [NB100-2331]")
Western Blot: LC3A AntibodyBSA Free [NB100-2331]
Western Blot: LC3A Antibody - BSA Free [NB100-2331] - LC3A Antibody [NB100-2331] - Detection of HRP conjugated autophagic LC3 in mouse ES cell lysate. The atg5-/- lane (ES cells, cultured to form embryonic bodies, that are deficient in conversion of LC3-1 to LC3-11) demonstrates the specificity of NB 100-2331, as there is no detection of LC3-11. Photo courtesy of Dr. Beth Levine, UT Southwestern Medical Center.![Immunocytochemistry/ Immunofluorescence: LC3A Antibody - BSA Free [NB100-2331]](https://resources.rndsystems.com/images/products/LC3A-Antibody---BSA-Free-Immunocytochemistry-Immunofluorescence-NB100-2331-img0038.jpg "Immunocytochemistry/ Immunofluorescence: LC3A Antibody - BSA Free [NB100-2331]")
Immunocytochemistry/ Immunofluorescence: LC3A Antibody - BSA Free [NB100-2331]
Immunocytochemistry/Immunofluorescence: LC3A Antibody - BSA Free [NB100-2331] - LC3A Antibody [NB100-2331] - This LC3A antibody Image shows an analysis in HeLa cells using anti-LC3 antibody (red). Nuclei were counterstained with DAPI (blue).![Immunocytochemistry/ Immunofluorescence: LC3A Antibody - BSA Free [NB100-2331]](https://resources.rndsystems.com/images/products/LC3A-Antibody---BSA-Free-Immunocytochemistry-Immunofluorescence-NB100-2331-img0042.jpg "Immunocytochemistry/ Immunofluorescence: LC3A Antibody - BSA Free [NB100-2331]")
Immunocytochemistry/ Immunofluorescence: LC3A Antibody - BSA Free [NB100-2331]
Immunocytochemistry/Immunofluorescence: LC3A Antibody - BSA Free [NB100-2331] - LC3A Antibody [NB100-2331] - Left panel shows untreated HeLa cells. Right panel shows HeLa cells that were treated with 50 uM CQ overnight. Cells were fixed for 10 minutes using 10% formalin and then permeabilized for 5 minutes using 1X PBS + 0.05% Triton X-100. The cells were incubated with anti-LC3A antibody at 5 ug/mL overnight at 4C and detected with an anti-mouse DyLight 488 (Green) at a 1:500. Nuclei were counterstained with DAPI (Blue). Cells were imaged using a 40X objective.![Immunohistochemistry: LC3A Antibody - BSA Free [NB100-2331]](https://resources.rndsystems.com/images/products/LC3A-Antibody---BSA-Free-Immunohistochemistry-NB100-2331-img0043.jpg "Immunohistochemistry: LC3A Antibody - BSA Free [NB100-2331]")
Immunohistochemistry: LC3A Antibody - BSA Free [NB100-2331]
LC3A-Antibody---BSA-Free-Immunohistochemistry-NB100-2331-img0043.jpg![Immunohistochemistry: LC3A Antibody - BSA Free [NB100-2331]](https://resources.rndsystems.com/images/products/LC3A-Antibody---BSA-Free-Immunohistochemistry-NB100-2331-img0044.jpg "Immunohistochemistry: LC3A Antibody - BSA Free [NB100-2331]")
Immunohistochemistry: LC3A Antibody - BSA Free [NB100-2331]
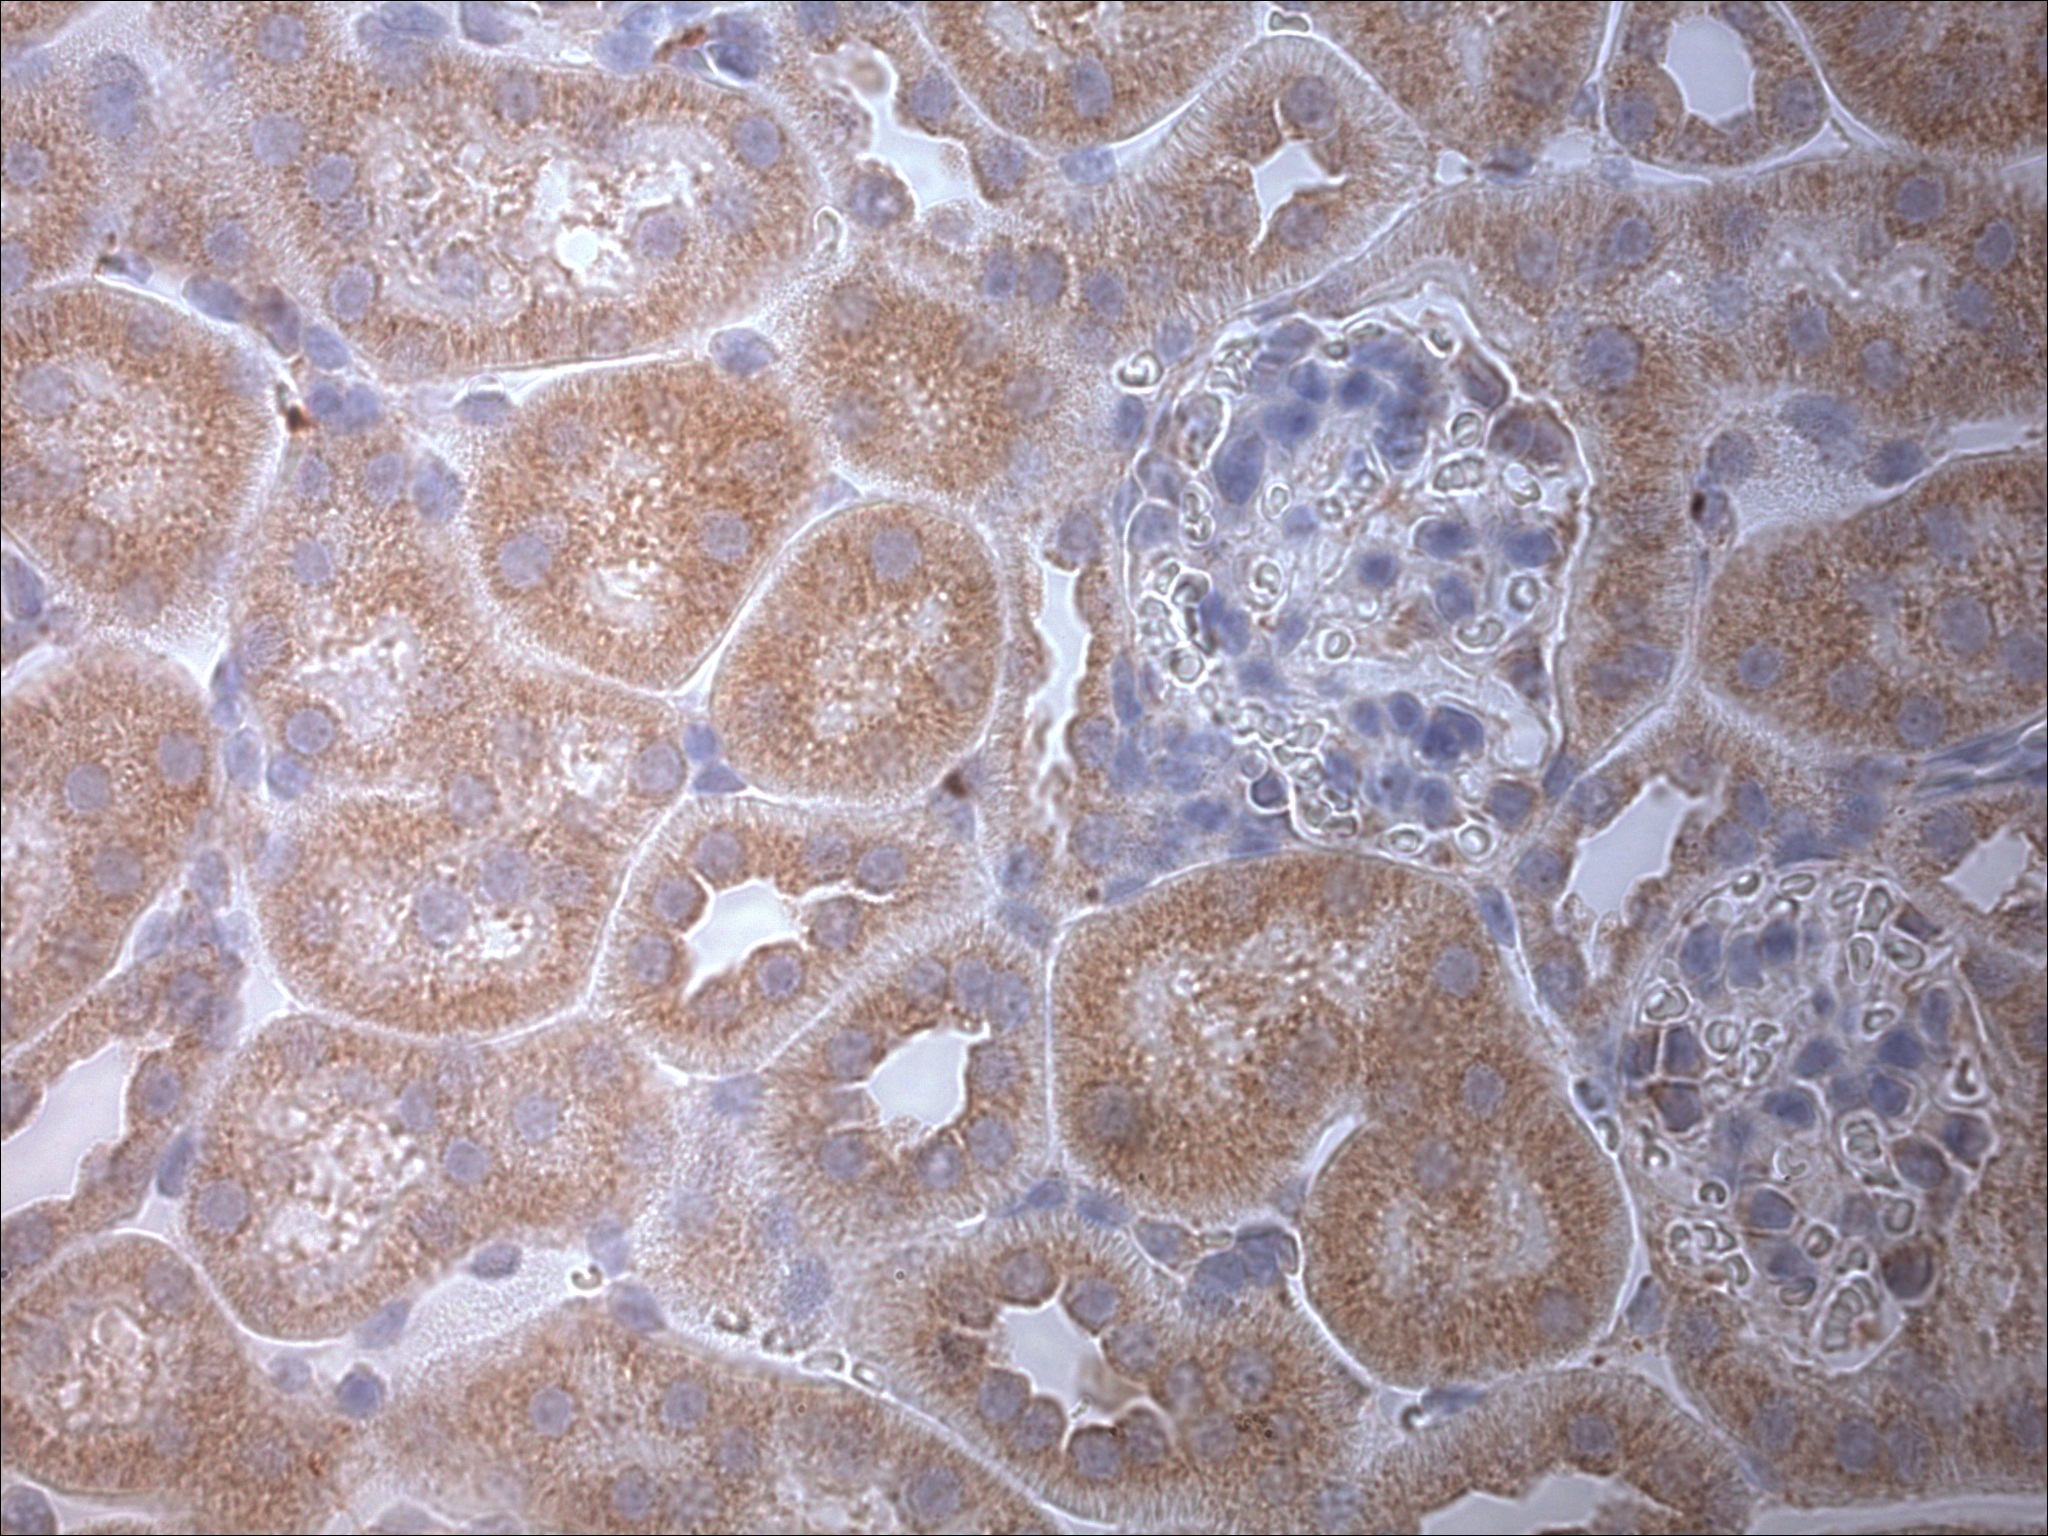
Immunohistochemistry: LC3A Antibody - BSA Free [NB100-2331] - LC3A Antibody [NB100-2331] - Analysis in mouse renal tissue. Image from verifed customer review.![Simple Western: LC3A AntibodyBSA Free [NB100-2331]](https://resources.rndsystems.com/images/products/LC3A-Antibody---BSA-Free-Simple-Western-NB100-2331-img0025.jpg "Simple Western: LC3A AntibodyBSA Free [NB100-2331]")
Simple Western: LC3A AntibodyBSA Free [NB100-2331]
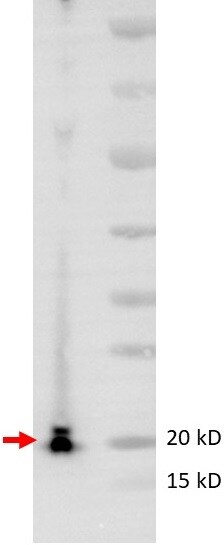
Simple Western: LC3A Antibody - BSA Free [NB100-2331] - LC3A Antibody [NB100-2331] - Image shows a specific band for LC3 in 0.5 mg/mL of Neuro2A lysate. This experiment was performed under reducing conditions using the 12-230 kDa separation system.
Western Blot: LC3A Antibody - BSA Free [NB100-2331] -
Western Blot: LC3A Antibody - BSA Free [NB100-2331] - Chronic, third window RIC increases the expression of autophagosome proteins, LC3I/II & Atg5.(A) Western blots for autophagy related signaling proteins. (B) Quantification of the protein fold change in 3W RIC compared to 3W controls. Values are means ± S.E.M. n = 6–8 per group. An (*) denotes a statistically significant difference (P<0.05) compared to control. (P-: phospho-). Image collected & cropped by CiteAb from the following publication (https://pubmed.ncbi.nlm.nih.gov/25347774), licensed under a CC-BY license. Not internally tested by Novus Biologicals.
Western Blot: LC3A Antibody - BSA Free [NB100-2331] -
Western Blot: LC3A Antibody - BSA Free [NB100-2331] - PRDX3 expression & its association with autophagy flux in cultured prostate cells(A) Representative immunoblot showing the levels of PRDX3, TOM20 & LC3-II in in lysates prepared from three different cultures of BPH-1 & RWPE-1 cells in the absence (Ctrl) or presence of bafilomycin A1 (BAF). (B–D) The quantification of the relative levels of PRDX3 (B), TOM20 (C) & LC3-II (D) to beta -Actin as shown in (A). Data are mean & standard deviation of three repeats & differences are tested with Student's T-test. *P ≤ 0.05; **P ≤ 0.01. Image collected & cropped by CiteAb from the following publication (https://www.oncotarget.com/lookup/doi/10.18632/oncotarget.17927), licensed under a CC-BY license. Not internally tested by Novus Biologicals.
Western Blot: LC3A Antibody - BSA Free [NB100-2331] -
Western Blot: LC3A Antibody - BSA Free [NB100-2331] - Acute, first window RIC activates autophagy signaling via p-AMPK upregulation & concomitant downregulation of mTOR.(A) Western blots for autophagy related signaling proteins. (B) Quantification of the protein fold change in 1W RIC compared to 1W controls. Values are means ± S.E.M. n = 6–8 per group. An (*) denotes a statistically significant difference (P<0.05) compared to control. (P-: phospho-). Image collected & cropped by CiteAb from the following publication (https://pubmed.ncbi.nlm.nih.gov/25347774), licensed under a CC-BY license. Not internally tested by Novus Biologicals.
Western Blot: LC3A Antibody - BSA Free [NB100-2331] -
Western Blot: LC3A Antibody - BSA Free [NB100-2331] - LiCl administered via 0.5% LiCl food pellets for 4 wks does not increase markers for autophagy in Gfap-R236H/+ mice.Each lane of the immunoblots is tissue from one mouse. Immunoblots for LC3-I & LC3-II in (A) did not detect a change in parietal cortex (and underlying white matter) with LiCl treatment. LC3-II bands normalized to LC3-I are quantified in B (N = 3–4 mice from 3–4 cages per genotype, & is representative of 3 blots). LC3-II normalized to GAPDH gave similar results & is not shown. P62 was increased in control diet R236H/+ mouse olfactory bulb compared with control diet +/+, but LiCl did not change P62 levels in GFAP+/+ or R236H/+ mice (C-D). P62 was normalized to total protein loaded. Error bars are SEM. ****P < 0.0001. Image collected & cropped by CiteAb from the following publication (https://pubmed.ncbi.nlm.nih.gov/26378915), licensed under a CC-BY license. Not internally tested by Novus Biologicals.
Western Blot: LC3A Antibody - BSA Free [NB100-2331] -
Western Blot: LC3A Antibody - BSA Free [NB100-2331] - MIR376A overexpression blocked autophagy in Huh-7 cells.(A) MIR376A blocked GFP-LC3 dot formation under starvation condition. (B) Quantitative analysis of experiments in A (mean ± S.D. of independent experiments, n = 3, ***p<0,01). (C) Overexpression of MIR376A resulted in decreased autophagic flux in Huh-7 cells. Starvation-induced conversion of LC3-I to LC3-II was analyzed. Tests were performed in the presence or absence of E64d (10 µg/ml) & Pepstatin A (10 µg/ml) (E+P). LC3-II/LC3-I densitometric ratios were marked. ACTB was used as a loading control. Image collected & cropped by CiteAb from the following publication (https://pubmed.ncbi.nlm.nih.gov/24358205), licensed under a CC-BY license. Not internally tested by Novus Biologicals.
Immunohistochemistry: LC3A Antibody - BSA Free [NB100-2331] -
Immunohistochemistry: LC3A Antibody - BSA Free [NB100-2331] - Elevated levels of additional proteins & GM3 ganglioside in the MEC of MPS IIIB brain.Staining performed with antibodies to the indicated substances was observed in the MEC region of 3 month-old MPS IIIB mice (for total ubiquitin & polyubiquitin) & 6 months for all others. Staining was not seen in the MEC region of age-matched control mice (Naglu +/−) nor in the LEC region of MPS IIIB mice (the latter not shown). Image collected & cropped by CiteAb from the following publication (https://dx.plos.org/10.1371/journal.pone.0027461), licensed under a CC-BY license. Not internally tested by Novus Biologicals.
Western Blot: LC3A Antibody - BSA Free [NB100-2331] -
Western Blot: LC3A Antibody - BSA Free [NB100-2331] - Autophagy responds rapidly to changing glucose conditions. Immortalized MSCs were cultured in physiologic (also called low in culture parlance; 1 g/L; 5.5 mM) or high (4.5 g/L; 25 mM) glucose media for 2 days & then changed to the corresponding opposite glucose concentration for up to 96 h. Myosin light chain 3 (LC3) levels were probed via immunoblot to assess autophagic response (a). The role of oxygen in the glucose response was also assessed by culturing the MSCs in a Biospherix hypoxic chamber at 4% & 1% oxygen in high & low glucose media for 4 days, followed by comparable LC3 blots (b). Shown are representative blots of three repeated studies. alpha -Actinin was used as a housekeeping control for all blots Image collected & cropped by CiteAb from the following publication (https://stemcellres.biomedcentral.com/articles/10.1186/s13287-016-0436-7), licensed under a CC-BY license. Not internally tested by Novus Biologicals.
Immunohistochemistry: LC3A Antibody - BSA Free [NB100-2331] -
Immunohistochemistry: LC3A Antibody - BSA Free [NB100-2331] - Elevated levels of various proteins in MEC & in dentate gyrus of MPS IIIA brain.Staining was performed with antibodies against the proteins shown in a 7 months-old MPS IIIA mouse brain. The first 3 rows are for the MEC region & the bottom row for dentate gyrus. Age-matched C57BL6 mice, used as controls, showed no staining in the MEC region (not shown). The dentate gyrus showed AT270 inclusions in MPS IIIA (−/−) mouse brain (arrows) but not in the C57BL/6 (control) brain (bottom row). Image collected & cropped by CiteAb from the following publication (https://dx.plos.org/10.1371/journal.pone.0027461), licensed under a CC-BY license. Not internally tested by Novus Biologicals.
Western Blot: LC3A Antibody - BSA Free [NB100-2331] -
Western Blot: LC3A Antibody - BSA Free [NB100-2331] - Autophagy responds rapidly to changing glucose conditions. Immortalized MSCs were cultured in physiologic (also called low in culture parlance; 1 g/L; 5.5 mM) or high (4.5 g/L; 25 mM) glucose media for 2 days & then changed to the corresponding opposite glucose concentration for up to 96 h. Myosin light chain 3 (LC3) levels were probed via immunoblot to assess autophagic response (a). The role of oxygen in the glucose response was also assessed by culturing the MSCs in a Biospherix hypoxic chamber at 4% & 1% oxygen in high & low glucose media for 4 days, followed by comparable LC3 blots (b). Shown are representative blots of three repeated studies. alpha -Actinin was used as a housekeeping control for all blots Image collected & cropped by CiteAb from the following publication (https://stemcellres.biomedcentral.com/articles/10.1186/s13287-016-0436-7), licensed under a CC-BY license. Not internally tested by Novus Biologicals.
Western Blot: LC3A Antibody - BSA Free [NB100-2331] -
Western Blot: LC3A Antibody - BSA Free [NB100-2331] - Delayed, second window RIC maintains mTOR inhibition without activating autophagosome machinery.(A) Western blots for autophagy related signaling proteins. (B) Quantification of the protein fold change in 2W RIC compared to 2W controls. Values are means ± S.E.M. n = 6–8 per group. An (*) denotes a statistically significant difference (P<0.05) compared to control. (P-: phospho-). Image collected & cropped by CiteAb from the following publication (https://pubmed.ncbi.nlm.nih.gov/25347774), licensed under a CC-BY license. Not internally tested by Novus Biologicals.
Immunohistochemistry: LC3A Antibody - BSA Free [NB100-2331] -
Immunohistochemistry: LC3A Antibody - BSA Free [NB100-2331] - Elevated levels of various proteins in MEC & in dentate gyrus of MPS IIIA brain.Staining was performed with antibodies against the proteins shown in a 7 months-old MPS IIIA mouse brain. The first 3 rows are for the MEC region & the bottom row for dentate gyrus. Age-matched C57BL6 mice, used as controls, showed no staining in the MEC region (not shown). The dentate gyrus showed AT270 inclusions in MPS IIIA (−/−) mouse brain (arrows) but not in the C57BL/6 (control) brain (bottom row). Image collected & cropped by CiteAb from the following publication (https://dx.plos.org/10.1371/journal.pone.0027461), licensed under a CC-BY license. Not internally tested by Novus Biologicals.
Western Blot: LC3A Antibody - BSA Free [NB100-2331] -
Western Blot: LC3A Antibody - BSA Free [NB100-2331] - Modulation of A152T-tau clearance & pathology by upregulation of autophagy. (J–N) Injection of an expression vector encoding zebrafish atg5 into A152T-tau fish embryos resulted in over-expression of Atg5 protein at 2 dpf (J & K) (high & low exposure of same blot presented; mean ± SD, n = 6 independent clutches; two-tailed t-test, *P < 0.05 versus control). (J & L) The increase in Atg5 protein correlated with increase in LC3II, a well-characterized reporter for autophagosome number, demonstrating that autophagy was upregulated in Atg5-injected fish (mean ± SEM, n = 8 independent clutches; two-tailed t-test, ***P < 0.001 versus control). Image collected & cropped by CiteAb from the following publication (https://academic.oup.com/brain/article/140/4/1128/2980948), licensed under a CC-BY license. Not internally tested by Novus Biologicals.
Immunohistochemistry: LC3A Antibody - BSA Free [NB100-2331] -
Immunohistochemistry: LC3A Antibody - BSA Free [NB100-2331] - Elevated levels of additional proteins & GM3 ganglioside in the MEC of MPS IIIB brain.Staining performed with antibodies to the indicated substances was observed in the MEC region of 3 month-old MPS IIIB mice (for total ubiquitin & polyubiquitin) & 6 months for all others. Staining was not seen in the MEC region of age-matched control mice (Naglu +/−) nor in the LEC region of MPS IIIB mice (the latter not shown). Image collected & cropped by CiteAb from the following publication (https://dx.plos.org/10.1371/journal.pone.0027461), licensed under a CC-BY license. Not internally tested by Novus Biologicals.
Western Blot: LC3A Antibody - BSA Free [NB100-2331] -
Western Blot: LC3A Antibody - BSA Free [NB100-2331] - Impacts of PRDX3 protein on autophagy flux(A–D) Representative immunoblot (A, C) & quantification (B, D) showing the levels of LC3-II in BPH-1 cells treated with random (MOCK) or PRDX3-specific siRNA (PRDX3) (A, B) or RWPE-1 cells transiently expressing different amount of PRDX3 (C, D) in the absence (Ctrl) or presence of bafilomycin A1 (BAF). Data are mean & standard deviation of three repeats & differences are tested with Student's T-test. *P ≤ 0.05; **P ≤ 0.01; ***P ≤ 0.001. (E–G) Representative immunoblot (E) & quantification (F, G) showing the levels of Beclin 1 (F) & PI3KCIII (G) in BPH-1 cells treated with random (MOCK) or PRDX3-specific siRNA (PRDX3). Ns, not significant; *P ≤ 0.05. Image collected & cropped by CiteAb from the following publication (https://www.oncotarget.com/lookup/doi/10.18632/oncotarget.17927), licensed under a CC-BY license. Not internally tested by Novus Biologicals.
Western Blot: LC3A Antibody - BSA Free [NB100-2331] -
Western Blot: LC3A Antibody - BSA Free [NB100-2331] - Endogenous MIR376A limits starvation-induced autophagy.(A) Blockage of endogenous MIR376A by Ant-376a, but not CNT-Ant further stimulated starvation (STV)-activated LC3-I to LC3-II conversion in MCF-7 cells. ACTB was used as a loading control. LC3-II/LC3-I densitometric ratios were marked. (B) Ant-376a, but not CNT-Ant resulted in further activation of SQSTM1 protein degradation following starvation in MCF-7 cells. SQSTM1/ACTB ratios were marked. Image collected & cropped by CiteAb from the following publication (https://pubmed.ncbi.nlm.nih.gov/24358205), licensed under a CC-BY license. Not internally tested by Novus Biologicals.
Western Blot: LC3A Antibody - BSA Free [NB100-2331] -
Western Blot: LC3A Antibody - BSA Free [NB100-2331] - Dram1 is required for GFP-Lc3 targeting to Mm clusters.a, b Representative confocal micrographs & quantification of GFP-Lc3 puncta in dram1∆19n/∆19n & dram1+/+ larvae in an unstimulated situation (basal autophagy, a) & following BafA1 treatment b. Each larva was imaged at a pre-defined region of the tail fin (≥11 larvae/group). Results are accumulated from two independent experiments & represented by scatter & boxplots as detailed in the “Methods” section. ns non-significant, *p < 0.05,**p < 0.01,***p < 0.001. Scale bars, 10 μm. The intensity calibration bar for the Lookup table (LUT) is displayed in panel a. c–e Western blot analysis of autophagy. Protein samples were obtained from 4 dpf dram1∆19n/∆19n & dram1+/+ larvae (>10 larvae/sample). Lc3 c & e, or p62 & Optineurin d protein levels were detected in absence or presence of BafA1, c & d, or in the presence or absence of Mm e. Actin was used as a loading control. Western Blots were repeated three, c & d, or two e times with protein extracts derived from independent experiments. The Lc3II/Actin or p62/Actin & Optineurin/Actin ratio, normalized to the control sample, is indicated below the blots. f–g Representative confocal micrographs & quantification of GFP-Lc3 co-localization with Mm clusters in infected dram1∆19n/∆19n & dram1+/+ larvae. The top images f show the entire region of imaging, while the bottom images f′ & f″ show details of GFP-Lc3 colocalization of Mm clusters in dram1∆19n/∆19n & dram1+/+ larvae. The arrowheads indicate GFP-Lc3-positive Mm clusters. The data is accumulated from two independent experiments (≥15 larvae/group) & represented by scatter & boxplots as detailed in the “Methods” section. Scale bars, 10 μm. Image collected & cropped by CiteAb from the following publication (https://pubmed.ncbi.nlm.nih.gov/32332700), licensed under a CC-BY license. Not internally tested by Novus Biologicals.
Western Blot: LC3A Antibody - BSA Free [NB100-2331] -
Western Blot: LC3A Antibody - BSA Free [NB100-2331] - Optn or p62 deficiency affects autophagosome formation.(A) Workflow of the experiments shown in (B-G). Larvae were treated with 100 nM of Baf A1 for 12 h from 3.5 dpf. The GPF-Lc3 negative larvae were selected to assay autophagy activity by Western blot, the GFP-Lc3 positive larvae were collected to monitor autophagic activity using confocal imaging. The red square indicates the region for confocal imaging. (B) Level of basal autophagy in WT & mutant embryos in absence or presence of Baf A1. Protein samples were extracted from 4 dpf WT & mutant larvae (>10 embryos/sample). The blots were probed with antibodies against Lc3 & Actin as a loading control. Western blots were repeated at least three times with independent extracts. (C) Quantification of Lc3-II fold changes in WT & mutant embryos in absence or presence of Baf A1. Western blot band intensities were quantified by Lab Image. Data is combined from three independent experiments. (D) Representative confocal micrographs of GFP-Lc3 puncta present in the tail fin of optn+/+, optn delta 5n/ delta 5n, p62+/+ & p62 delta 37n/ delta 37n at 4 dpf. Scale bars, 10 μm. (E). Quantification of the number of GFP-Lc3 puncta in optn+/+, optn delta 5n/ delta 5n, p62+/+ & p62 delta 37n/ delta 37n larvae with & without Baf A1 treatment. Each larva was imaged at a pre-defined region of the tail fin (as indicated by the red boxed area in Fig3 A) (≥11 larvae/group). Results are accumulated from two independent experiments. ns, non-significant, *p<0.05, **p<0.01, ***p<0.001. Image collected & cropped by CiteAb from the following publication (https://pubmed.ncbi.nlm.nih.gov/30818338), licensed under a CC-BY license. Not internally tested by Novus Biologicals.
Immunohistochemistry: LC3A Antibody - BSA Free [NB100-2331] -
Immunohistochemistry: LC3A Antibody - BSA Free [NB100-2331] - Rapamycin increases autophagy in brains of PDAPP mice.a, f & h, representative immunoblots of hippocampal lysates from control- & rapamycin-treated transgenic PDAPP mice & non-transgenic littermate controls. b, g & i, quantitative analyses. a & b, LC3-II levels are decreased in hippocampi of rapamycin-treated transgenic PDAPP mice (*, P = 0.0009), but not in hippocampi of rapamycin-treated non-transgenic littermates. c & d, representative epifluorescent (c, 200×) & higher-magnification confocal (d, 600×) images of hippocampal CA1 (e, green box, region of epifluorescent images; blue box, region of confocal images) in control- & rapamycin-fed transgenic PDAPP mice stained with an anti-LC3 antibody. An increase in LC3-immunoreactive puncta was observed in CA1 projections of transgenic PDAPP mice following rapamycin administration. f & g, levels of the autophagic substrate p62SQSTM are decreased (*, P = 0.0015) in hippocampi of rapamycin-treated PDAPP transgenic mice. f, representative Western blots; g, quantitative analyses of p62SQSTM levels. h & i, Levels of phosphorylated (activated) p70 were decreased in brains of rapamycin-treated PDAPP & non-transgenic mice (*, P = 0.001 & P = 0.04 respectively). Significance of differences between group means were determined using two-tailed unpaired Student's t test. Data are means ± SEM. Image collected & cropped by CiteAb from the following publication (https://dx.plos.org/10.1371/journal.pone.0009979), licensed under a CC-BY license. Not internally tested by Novus Biologicals.
Immunocytochemistry/ Immunofluorescence: LC3A Antibody - BSA Free [NB100-2331] -
Immunocytochemistry/ Immunofluorescence: LC3A Antibody - BSA Free [NB100-2331] - Macroautophagy is a major mechanism in the rapid disposal of insulin precursor in beta -cells.The Ins2+/+ beta -cells were cultured under the 5.5 mM glucose concentration for a 24-hour pre-experimental period until treatment. (A) The Ins2+/+ beta -cells were treated with cycloheximide (Chx; 100 µg/mL), Chx (100 µg/mL) & 3-MA (5 mM), Baf A1 (5 µM), or chloroquine (Chl; 100 µg/mL) for 30 minutes with an untreated control. Cellular proteins (30 µg) were separated by 16.5% non-reduced (upper panels) or reduced (lower panels) tricine SDS-PAGE & then examined by immunoblotting. (B) The upper panel, the immunoreactive LC3-I/II (%) in individual treatments in (A); the lower panel, the percentages of proinsulin levels on reduced gels (that were normalized by tubulin) in individual treatments compared to the untreated controls. (C) The Ins2+/+ beta -cells subjected to the same treatments described in (A) were immunostained with antibodies against LC3, C-peptide, & insulin as described in the Materials & Methods. Fluorescent Cy2 (for LC3), Cy3 (for C-peptide & insulin), & their merged images were shown. The scale of bar in (C), 10 µm. (D) The relative levels (%) of the LC3 & (pro)insulin and/or C-peptide positive dots per cell of individual treatments in (C). The data in (B) or (D) were reported as mean ± SD. *P<0.05; **P<0.01, n = 4. Image collected & cropped by CiteAb from the following publication (https://dx.plos.org/10.1371/journal.pone.0027647), licensed under a CC-BY license. Not internally tested by Novus Biologicals.
Western Blot: LC3A Antibody - BSA Free [NB100-2331] -
Western Blot: LC3A Antibody - BSA Free [NB100-2331] - DBA mutations induce autophagy.(A) Immunofluorescence with LC3 antibodies in LCLs derived from a normal control or DBA patients. Higher magnifications are represented in the lower panel. Arrows denote puncta indicative of LC3 recruitment to autophagosomes, or accumulation in autolysosomes. Size bars = 10 µM. (B) Quantification of the percent of cells revealing LC3 puncta compared to the total number of cells in the 60x shots. (C) Western blot analysis of LC3 in DBA LCLs compared to normal controls. The LC3II/actin ratio is determined by densitometer analysis. (D) Representative western blot analysis of p62 levels in normal control & DBA patient LCLs. (E) Densitometer analysis of p62 protein expression from western blots (N = 3) represented in (D). (F) Immunofluorescence with p62 antibodies of LCLs derived from a normal control or DBA patients. Size bars = 10 µM. (G) ImageJ measurements of p62 expression in (F) per total cell area. (H) Representative electron micrographs of LCLs derived from a normal control & RPS17 cells. Control cells have small typically dense lysosomes (*). The much larger autolysosomes (A) are only detected in RPS17 LCLs. The boxed area in the upper right panel is shown at higher magnification in the lower right panel. N = nucleus, ECS = extracellular space. Bars in top panels = 1 µM, bottom panels = 200 nM. Image collected & cropped by CiteAb from the following publication (https://dx.plos.org/10.1371/journal.pgen.1004371), licensed under a CC-BY license. Not internally tested by Novus Biologicals.
Western Blot: LC3A Antibody - BSA Free [NB100-2331] -
Western Blot: LC3A Antibody - BSA Free [NB100-2331] - UBC9 is degraded by autophagy in epithelial cells.(A) Immunolocalization of UBC9 in ultrathin sections of HKs transduced with empty or HPV16 E6/E7 vectors. Original view (left) & higher magnification (right) of boxed regions. Gold particles are selectively enriched in autophagic structures highlighted by arrows. Scale bar = 1 μm. (B) Top: Representative WB of HaCaT cells treated with the indicated autophagic activators (left) & inhibitors (right). Activation of autophagy was monitored by the conversion of LC3 (LC3-I) to the lipidated LC3 (LC3-II) form, a marker of autophagosome production induced by autophagic stimuli [41]. LC3-II accumulation was used to verify autophagic impairment [41]. Bottom: normalized UBC9 expression. Data are expressed as fold over untreated cells. Bars represent means ± SEM of n = 4 different biological replicates. ns: not significant (Kruskal–Wallis one-way ANOVA with Dunn’s post hoc test) compared to vehicle control groups. (C) Representative WB analysis of U-2 OS or MCF7 cells treated with chloroquine. n = 3 different biological replicates. (D) Representative WB analysis of MCF7 cells transduced with scramble or ATG5 shRNA. The observed ATG5 band represents the ATG5-ATG12 conjugated form. LC3-I accumulation is reported to evidence autophagic deficiencies promoted by shATG5. n = 3 replicates of a single transduction. Image collected & cropped by CiteAb from the following publication (https://dx.plos.org/10.1371/journal.ppat.1006262), licensed under a CC-BY license. Not internally tested by Novus Biologicals.
Western Blot: LC3A Antibody - BSA Free [NB100-2331] -
Western Blot: LC3A Antibody - BSA Free [NB100-2331] - Macroautophagy is a major mechanism in the rapid disposal of insulin precursor in beta -cells.The Ins2+/+ beta -cells were cultured under the 5.5 mM glucose concentration for a 24-hour pre-experimental period until treatment. (A) The Ins2+/+ beta -cells were treated with cycloheximide (Chx; 100 µg/mL), Chx (100 µg/mL) & 3-MA (5 mM), Baf A1 (5 µM), or chloroquine (Chl; 100 µg/mL) for 30 minutes with an untreated control. Cellular proteins (30 µg) were separated by 16.5% non-reduced (upper panels) or reduced (lower panels) tricine SDS-PAGE & then examined by immunoblotting. (B) The upper panel, the immunoreactive LC3-I/II (%) in individual treatments in (A); the lower panel, the percentages of proinsulin levels on reduced gels (that were normalized by tubulin) in individual treatments compared to the untreated controls. (C) The Ins2+/+ beta -cells subjected to the same treatments described in (A) were immunostained with antibodies against LC3, C-peptide, & insulin as described in the Materials & Methods. Fluorescent Cy2 (for LC3), Cy3 (for C-peptide & insulin), & their merged images were shown. The scale of bar in (C), 10 µm. (D) The relative levels (%) of the LC3 & (pro)insulin and/or C-peptide positive dots per cell of individual treatments in (C). The data in (B) or (D) were reported as mean ± SD. *P<0.05; **P<0.01, n = 4. Image collected & cropped by CiteAb from the following publication (https://dx.plos.org/10.1371/journal.pone.0027647), licensed under a CC-BY license. Not internally tested by Novus Biologicals.
Western Blot: LC3A Antibody - BSA Free [NB100-2331] -
Western Blot: LC3A Antibody - BSA Free [NB100-2331] - Optn or p62 deficiency inhibits targeting of Mm by GFP-Lc3.(A) Workflow of the experiment shown in B. 2 dpi fixed larvae were used for confocal imaging. The entire CHT region was imaged, as indicated by the black box. (B) Representative confocal micrographs of GFP-Lc3 co-localization with Mm clusters in infected larvae. The top image shows an overview of the CHT region in optn+/+ infected larvae. The area indicated by the white box is detailed below. The bottom images show GFP-Lc3 co-localization of Mm clusters in optn+/+, optn delta 5n/ delta 5n, p62+/+ & p62 delta 37n/ delta 37n infected larvae. The arrowheads indicate the overlap between GFP-Lc3 & Mm clusters. Scale bars, 10 μm. (C) Quantification of the percentage of Mm clusters positive for GFP-Lc3 vesicles. The data is accumulated from two independent experiments; each dot represents an individual larva (≥12 larvae/group). ns, non-significant, *p<0.05, **p<0.01, ***p<0.001. (D) Western blot analysis of Lc3 protein levels in infected & uninfected larvae. Protein samples were extracted from 4 dpf larvae (>10 larvae/sample). The blots were probed with antibodies against Lc3 & Actin as a loading control & Lc3-II/Lc3-I ratios are indicated below. Western blots were repeated twice with independent extracts. Image collected & cropped by CiteAb from the following publication (https://pubmed.ncbi.nlm.nih.gov/30818338), licensed under a CC-BY license. Not internally tested by Novus Biologicals.
Western Blot: LC3A Antibody - BSA Free [NB100-2331] -
Western Blot: LC3A Antibody - BSA Free [NB100-2331] - UBC9 is degraded by autophagy in epithelial cells.(A) Immunolocalization of UBC9 in ultrathin sections of HKs transduced with empty or HPV16 E6/E7 vectors. Original view (left) & higher magnification (right) of boxed regions. Gold particles are selectively enriched in autophagic structures highlighted by arrows. Scale bar = 1 μm. (B) Top: Representative WB of HaCaT cells treated with the indicated autophagic activators (left) & inhibitors (right). Activation of autophagy was monitored by the conversion of LC3 (LC3-I) to the lipidated LC3 (LC3-II) form, a marker of autophagosome production induced by autophagic stimuli [41]. LC3-II accumulation was used to verify autophagic impairment [41]. Bottom: normalized UBC9 expression. Data are expressed as fold over untreated cells. Bars represent means ± SEM of n = 4 different biological replicates. ns: not significant (Kruskal–Wallis one-way ANOVA with Dunn’s post hoc test) compared to vehicle control groups. (C) Representative WB analysis of U-2 OS or MCF7 cells treated with chloroquine. n = 3 different biological replicates. (D) Representative WB analysis of MCF7 cells transduced with scramble or ATG5 shRNA. The observed ATG5 band represents the ATG5-ATG12 conjugated form. LC3-I accumulation is reported to evidence autophagic deficiencies promoted by shATG5. n = 3 replicates of a single transduction. Image collected & cropped by CiteAb from the following publication (https://dx.plos.org/10.1371/journal.ppat.1006262), licensed under a CC-BY license. Not internally tested by Novus Biologicals.
Western Blot: LC3A Antibody - BSA Free [NB100-2331] -
Western Blot: LC3A Antibody - BSA Free [NB100-2331] - Dram1 is required for GFP-Lc3 targeting to Mm clusters.a, b Representative confocal micrographs & quantification of GFP-Lc3 puncta in dram1∆19n/∆19n & dram1+/+ larvae in an unstimulated situation (basal autophagy, a) & following BafA1 treatment b. Each larva was imaged at a pre-defined region of the tail fin (≥11 larvae/group). Results are accumulated from two independent experiments & represented by scatter & boxplots as detailed in the “Methods” section. ns non-significant, *p < 0.05,**p < 0.01,***p < 0.001. Scale bars, 10 μm. The intensity calibration bar for the Lookup table (LUT) is displayed in panel a. c–e Western blot analysis of autophagy. Protein samples were obtained from 4 dpf dram1∆19n/∆19n & dram1+/+ larvae (>10 larvae/sample). Lc3 c & e, or p62 & Optineurin d protein levels were detected in absence or presence of BafA1, c & d, or in the presence or absence of Mm e. Actin was used as a loading control. Western Blots were repeated three, c & d, or two e times with protein extracts derived from independent experiments. The Lc3II/Actin or p62/Actin & Optineurin/Actin ratio, normalized to the control sample, is indicated below the blots. f–g Representative confocal micrographs & quantification of GFP-Lc3 co-localization with Mm clusters in infected dram1∆19n/∆19n & dram1+/+ larvae. The top images f show the entire region of imaging, while the bottom images f′ & f″ show details of GFP-Lc3 colocalization of Mm clusters in dram1∆19n/∆19n & dram1+/+ larvae. The arrowheads indicate GFP-Lc3-positive Mm clusters. The data is accumulated from two independent experiments (≥15 larvae/group) & represented by scatter & boxplots as detailed in the “Methods” section. Scale bars, 10 μm. Image collected & cropped by CiteAb from the following publication (https://pubmed.ncbi.nlm.nih.gov/32332700), licensed under a CC-BY license. Not internally tested by Novus Biologicals.
Western Blot: LC3A Antibody - BSA Free [NB100-2331] -
Western Blot: LC3A Antibody - BSA Free [NB100-2331] - Knockdown of FUT1 is associated with an increase in autophagic flux. (a) Immunoblot analysis of LC3-II & p62 levels in control & FUT1 knockdown cells. Total cell lysates from MCF-7 & T47D cells transfected with control or FUT1 siRNAs were collected at 120 & 96 h post-transfection, respectively. Equal amounts of cell lysates were then loaded in each lane & separated by SDS-PAGE. Immunoblot analysis was performed with LC3 & p62 antibodies. Actin was used as a loading control. The intensity of LC3-II & p62 protein bands on immunoblot were quantified & normalized to actin, & the relative levels of protein expression were expressed as fold change by setting the control group value to 1. Values shown are mean±S.E.M. of three independent experiments (***P<0.001; **P<0.01; *P<0.05). (b) Downregulation of FUT1 enhanced the fusion of autophagosome & lysosomes in MCF-7 cells. Cells were co-stained with anti-LAMP-1 (green) & anti-LC3 (red) & nuclei stained with Hoechst (blue). Representative colocalization signals (referred to as autolysosomes) were shown in yellow in the merged. Magnification × 63, zoom: × 3. Scale bars, 10 μm. Histogram shows the percentages of autolysosomes (LC3+/LAMP-1+) to autophagosomes (LC3+/LAMP-1−). Data are mean±S.E.M. of three independent experiments of >100 cells per group (*P<0.05) Image collected & cropped by CiteAb from the following publication (https://pubmed.ncbi.nlm.nih.gov/27560716), licensed under a CC-BY license. Not internally tested by Novus Biologicals.
Western Blot: LC3A Antibody - BSA Free [NB100-2331] -
Western Blot: LC3A Antibody - BSA Free [NB100-2331] - Effect of MIR376A overexpression on autophagy.(A) MCF-7 cells were co-transfected with either MIR-CNT (control plasmid) or MIR376A & GFP-LC3 plasmid, & GFP-LC3 dot formation was analyzed. White arrows indicate clusters of the GFP-LC3 dots in cells. (B) Quantification of the experiments in A. MIR376A overexpression, but not MIR-CNT expression, blocked starvation (STV)-induced autophagy (mean ± S.D. of independent experiments, n = 4, ***p<0,01). NON STV, non-starved (C) Overexpression of MIR376A resulted in a decrease in the autophagic activity of MCF-7 cells. Starvation-induced conversion of LC3-I to LC3-II in MCF-7 cells was analyzed. Tests were performed in the presence or absence of E64d (10 µg/ml) & Pepstatin A (10 µg/ml) (E+P). LC3-II/LC3-I densitometric ratios were marked. ACTB was used as a loading control. (D) MIR376A blocked starvation induced SQSTM1 degradation in MCF-7 cells. ACTB was used as a loading control. SQSTM1/ACTIN densitometric ratios were marked. Image collected & cropped by CiteAb from the following publication (https://pubmed.ncbi.nlm.nih.gov/24358205), licensed under a CC-BY license. Not internally tested by Novus Biologicals.
Western Blot: LC3A Antibody - BSA Free [NB100-2331] -
Western Blot: LC3A Antibody - BSA Free [NB100-2331] - Tau clearance in vivo & autophagy function. Clearance kinetics of photoconverted Dendra-tau measured in neurons of WT-tau & AT152T-tau fish. Measurement of intensity of red Dendra-tau signal over time reflects the clearance or degradation of tau protein. (C–F) WBs for LC3-II, a well-characterized marker of autophagosome number, demonstrate that there no differences in levels of this protein between WT-tau & A152T-tau fish either at 24 hpf (pre-phenotype; C & D) or 72 hpf (post-phenotype; E & F). (E & F) Measurements of LC3-II levels in presence or absence of ammonium chloride provides a method for measuring autophagic flux. No differences observed between the two transgenic lines at 3 dpf, suggesting that autophagy functions normally in both WT-tau & A152T-tau fish (graph represents mean ± SD of four independent clutches per group for E & F & 3for C & D; two-tailed t-test). Image collected & cropped by CiteAb from the following publication (https://academic.oup.com/brain/article/140/4/1128/2980948), licensed under a CC-BY license. Not internally tested by Novus Biologicals.Applications for LC3A Antibody - BSA Free
Application
Recommended Usage
Chromatin Immunoprecipitation
reported in scientific literature (PMID 33035707)
ELISA
reported in scientific literature (PMID 20930550)
Flow Cytometry
reported in scientific literature (PMID 24419333)
Immunoblotting
reported in scientific literature (PMID 28253371)
Immunocytochemistry/ Immunofluorescence
1:100-1:300. Use reported in scientific literature (PMID 21545732)
Immunohistochemistry
1:200-1:400
Immunohistochemistry Whole-Mount
reported in scientific literature (PMID 31783118)
Immunohistochemistry-Paraffin
1:200-1:400. Use reported in scientific literature (PMID 26571030)
Immunoprecipitation
20 ug / 500 ug of lysate
Simple Western
1:50
Western Blot
2.0 ug/ml
Application Notes
Western blot bands are seen at ~19 kDa, representing LC3-I, and ~17 kDa, representing LC3-II. The observed molecular weight of the protein may vary from the listed predicted molecular weight due to post translational modifications, post translation cleavages, relative charges, and other experimental factors. Use in Southern blot reported in scientific literature (PMID: 21262964). In ICC, cytoplasmic staining was observed in HeLa cells. In Simple Western only 10 - 15 uL of the recommended dilution is used per data point.
See Simple Western Antibody Database for Simple Western validation: Tested in Neuro2A lysate 0.5 mg/mL, separated by Size, antibody dilution of 1:50, apparent MW was 16 kDa
See Simple Western Antibody Database for Simple Western validation: Tested in Neuro2A lysate 0.5 mg/mL, separated by Size, antibody dilution of 1:50, apparent MW was 16 kDa
Reviewed Applications
Read 22 reviews rated 4.3 using NB100-2331 in the following applications:
Flow Cytometry Panel Builder
Bio-Techne Knows Flow Cytometry
Save time and reduce costly mistakes by quickly finding compatible reagents using the Panel Builder Tool.
Advanced Features
- Spectra Viewer - Custom analysis of spectra from multiple fluorochromes
- Spillover Popups - Visualize the spectra of individual fluorochromes
- Antigen Density Selector - Match fluorochrome brightness with antigen density

Formulation, Preparation, and Storage
Purification
Immunogen affinity purified
Formulation
PBS
Format
BSA Free
Preservative
0.02% Sodium Azide
Concentration
1.0 mg/ml
Shipping
The product is shipped with polar packs. Upon receipt, store it immediately at the temperature recommended below.
Stability & Storage
Aliquot and store at -20C or -80C. Avoid freeze-thaw cycles.
Background: LC3A
The process of autophagy is associated with a variety of diseases including neurodegenerative diseases, neuromuscular, tumorigenesis, and viral and bacterial infections (4). LC3 is a useful marker of autophagy in both healthy and diseased cells (4). Interestingly, LC3A has two variants (v1 and v2) which differ in N-terminal sequence due to the varying transcriptional start sites (5). One particular study found that LC3Av1, but not v2 or LC3B, was silenced in various cancer cell lines due to aberrant DNA methylation and re-expression of LC3Av1 in LC3Av1-silenced cells inhibited tumor growth, where overall findings suggest a possible tumor-suppressive role (5).
Alternative names for LC3A include Apg8, APG8a, ATG8E, Autophagy-related protein LC3 A, Autophagy-related ubiquitin-like modifier LC3 A, MAP1A/1B light chain 3 A, microtubule-associated proteins 1A/1B light chain 3, and MLP3A.
References
1. Shpilka, T., Weidberg, H., Pietrokovski, S., & Elazar, Z. (2011). Atg8: an autophagy-related ubiquitin-like protein family. Genome biology. https://doi.org/10.1186/gb-2011-12-7-226
2. Koukourakis, M. I., Kalamida, D., Giatromanolaki, A., Zois, C. E., Sivridis, E., Pouliliou, S., Mitrakas, A., Gatter, K. C., & Harris, A. L. (2015). Autophagosome Proteins LC3A, LC3B and LC3C Have Distinct Subcellular Distribution Kinetics and Expression in Cancer Cell Lines. PloS one. https://doi.org/10.1371/journal.pone.0137675
3. Weidberg, H., Shvets, E., & Elazar, Z. (2011). Biogenesis and cargo selectivity of autophagosomes. Annual review of biochemistry. https://doi.org/10.1146/annurev-biochem-052709-094552
4. Tanida, I., Ueno, T., & Kominami, E. (2004). LC3 conjugation system in mammalian autophagy. The international journal of biochemistry & cell biology. https://doi.org/10.1016/j.biocel.2004.05.009
5. Schaaf, M. B., Keulers, T. G., Vooijs, M. A., & Rouschop, K. M. (2016). LC3/GABARAP family proteins: autophagy-(un)related functions. FASEB journal : official publication of the Federation of American Societies for Experimental Biology. https://doi.org/10.1096/fj.201600698R
Long Name
Microtubule-associated Protein 1 Light Chain 3 alpha
Alternate Names
Apg8, APG8a, Apg8p3, ATG8E, LC3, MAP1ALC3, MAP1LC3A, MLP3A
Gene Symbol
MAP1LC3A
Additional LC3A Products
Product Documents for LC3A Antibody - BSA Free
Certificate of Analysis
To download a Certificate of Analysis, please enter a lot or batch number in the search box below.
Product Specific Notices for LC3A Antibody - BSA Free
This product is for research use only and is not approved for use in humans or in clinical diagnosis. Primary Antibodies are guaranteed for 1 year from date of receipt.
Related Research Areas
Citations for LC3A Antibody - BSA Free
 Powered by Bioz
Customer Reviews for LC3A Antibody - BSA Free (22)
4.3 out of 5
22 Customer Ratings
Have you used LC3A Antibody - BSA Free?
Submit a review and receive an Amazon gift card!
$25/€18/£15/$25CAN/¥2500 Yen for a review with an image
$10/€7/£6/$10CAN/¥1110 Yen for a review without an image
Submit a review
Customer Images


-(01-ml)_NB100-2331_10836.jpg)
-(01-ml)_NB100-2331_8521.jpg)
-(01-ml)_NB100-2331_6741.jpg)
Showing
1
-
5 of
22 reviews
Showing All
Filter By:
-
Application: ImmunocytochemistrySample Tested: Human microglia cell lysate and Human microgliaSpecies: HumanVerified Customer | Posted 05/21/2021Microglia cell line treated with an inhibitor of autophagy

-
Application: Western BlotSample Tested: MICROGLIASpecies: RatVerified Customer | Posted 05/21/2021LYSATES OF RAT MICROGLIA (10 MICROG)
-
Application: Western BlotSample Tested: THP-1 cell lysateSpecies: HumanVerified Customer | Posted 06/09/2020Detection of LC3 from THP-1 cell lysates. A specific band ~20 kD was detected by LC3 antibody (NB100-2331)The antibody works great to detect the LC3 from THP-1 cell lysates
-
Application: Western BlotSample Tested: lysed cell lines, Sample Amount: 20 ugSpecies: MouseVerified Customer | Posted 01/29/2019
-
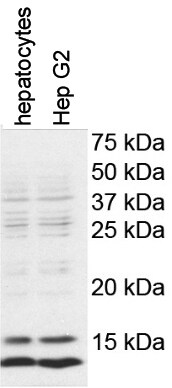
Application: Western BlotSample Tested: mouse hepatocytes and HepG2 cellsSpecies: Mouse and HumanVerified Customer | Posted 11/25/2017The expression of LC-3B was detected in mouse primary culture hepatocytes and Hep G2 cells
-
Application: Western BlotSample Tested: Mouse macrophage cell line RAW 264.7Species: MouseVerified Customer | Posted 08/07/2017Western blotting assay of RAW 264.7 cells
-
Application: Western BlotSample Tested: Mouse Neuro2A, Mouse Cortical Neurons whole cell lysateSpecies: MouseVerified Customer | Posted 10/06/2015
-
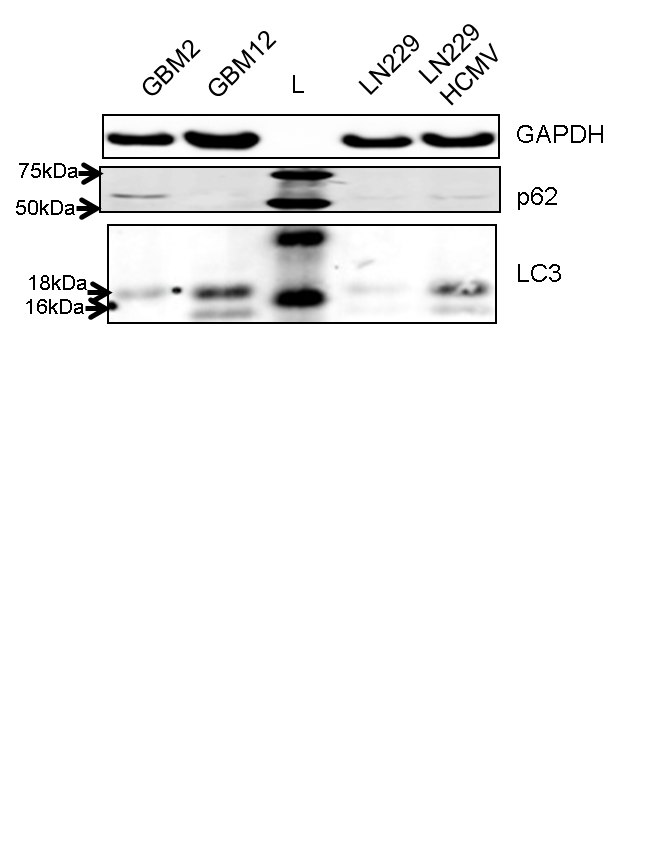
Application: Western BlotSample Tested: human glioblastomaSpecies: HumanVerified Customer | Posted 01/12/2015human glioblastoma
-
Application: Western BlotSample Tested: See PMID 22892563Species: MouseVerified Customer | Posted 12/12/2014
-
Application: ImmunofluorescenceSample Tested: NIH3T3, HeLa, HEK293T, N2a neuroblastoma, Q7 striatal, Sy5Y neuroblastomaSpecies: MouseVerified Customer | Posted 11/25/2014anti-LC3 (NB100-2331) in PFA fixed NIH3T3 fibroblasts
-
Application: Immunohistochemistry-ParaffinVerified Customer | Posted 10/04/2014Mouse meniscus and cartilage
-
Application: Western BlotSample Tested: human tumor cellsSpecies: HumanVerified Customer | Posted 06/30/2014LC3 expression at primary glioma samples
-
Application: Western BlotSample Tested:Species: HumanVerified Customer | Posted 06/20/2014
-
Application: Western BlotSample Tested:Species: HumanVerified Customer | Posted 04/02/2014Autophagic activation in MCF-7 cells under cisplatin treatment
-
Application: ImmunohistochemistrySample Tested: Renal tissue (paraffin block)Species: MouseVerified Customer | Posted 08/13/2012
-
Application: Western BlotSample Tested: HumanSpecies: HumanVerified Customer | Posted 12/28/2011
-
Application: Western BlotSample Tested: HumanSpecies: HumanVerified Customer | Posted 11/21/2011
-
Application: Western BlotSample Tested: HumanSpecies: HumanVerified Customer | Posted 11/21/2011
-
Application: Western BlotSample Tested: MouseSpecies: MouseVerified Customer | Posted 10/24/2011
-
Application: Western BlotSample Tested: 3T3-L1 adipocyte, Sample Amount: 30ugSpecies: MouseVerified Customer | Posted 07/08/2010
-
Application: Western BlotSample Tested: lysed cell lines, Sample Amount: 20 ugSpecies: OtherVerified Customer | Posted 11/05/2009
-
Application: Western BlotSample Tested: Human cancer cells, Sample Amount: 80ugSpecies: HumanVerified Customer | Posted 02/18/2009
There are no reviews that match your criteria.
Protocols
View specific protocols for LC3A Antibody - BSA Free (NB100-2331):
LC3A Antibody:
I. Deparaffinization:
A. Treat slides with Xylene: 3 changes for 5 minutes each. Drain slides for 10 seconds between changes.
B. Treat slides with 100% Reagent Alcohol: 3 changes for 5 minutes each. Drain slides for 10 seconds between changes.
II. Quench Endogenous Peroxidase:
To Prepare 200 ml of Quenching Solution: Add 3 ml of 30% Hydrogen Peroxide to 200 ml of Methanol.
**Use within 4 hours of preparation
A.Place slides in peroxidase quenching solution: 15-30 minutes.
III. Retrieve Epitopes:
A. Preheat Citrate Buffer. Place 200 ml of Citrate Buffer Working Solution into container, cover and place into steamer. Heat to 90-96C.
B. Place rack of slides into hot Citrate Buffer for 20 minutes. Cover.
C. Carefully remove container with slides from steamer and cool on bench, uncovered, for 20 minutes.
D. Slowly add distilled water to further cool for 5 minutes.
E. Rinse slides with distilled water. 2 changes for 2 minutes each.
IV. Immunostaining Procedure:
A. Remove each slide from rack and circle tissue section with a hydrophobic barrier pen (e.g. Liquid Blocker-Super Pap Pen).
B. Flood slide with Wash Solution.
**Do not allow tissue sections to dry for the rest of the procedure.
C. Drain wash solution and apply 4 drops of Blocking Reagent to each slide and incubate for 15 minutes.
D. Drain Blocking Reagent (do not wash off the Blocking Reagent), apply 200 ul of Primary Antibody solution to each slide, and incubate for 1 hour.
E. Wash slides with Wash Solution: 3 changes for 5 minutes each.
F. Drain wash solution, apply 4 drops of Secondary antibody to each slide and incubate for 1 hour.
G. Wash slides with Wash Solution: 3 changes for 5 minutes each.
H. Drain wash solution, apply 4 drops of DAB Substrate to each slide and develop for 5-10 minutes.
Check development with microscope.
I. Wash slides with Wash Solution: 3 changes for 5 minutes each.
J. Drain wash solution, apply 4 drops of Hematoxylin to each slide and stain for 1-3 minutes.
Increase time if darker counterstaining is desired.
K. Wash slides with Wash Solution: 2-3 changes for 2 minutes each.
L. Drain wash solution and apply 4 drops of Bluing Solution to each slide for 1-2 minutes.
M. Rinse slides in distilled water.
N. Soak slides in 70% reagent alcohol: 3 minutes with intermittent agitation.
O. Soak slides in 95% reagent alcohol: 2 changes for 3 minutes each with intermittent agitation.
P. Soak slides in 100% reagent alcohol: 3 changes for 3 minutes each with intermittent agitation. Drain slides for 10 seconds between each change.
Q. Soak slides in Xylene: 3 changes for 3 minutes each with intermittent agitation. Drain slides for 10 seconds between each change.
R. Apply 2-3 drops of non-aqueous mounting media to each slide and mount coverslip.
S. Lay slides on a flat surface to dry prior to viewing under microscope.
NOTES:
- Use treated slides (e.g. HistoBond) to assure adherence of FFPE sections to slide.
- Prior to deparaffinization, heat slides overnight in a 60C oven.
- All steps in which Xylene is used should be performed in a fume hood.
- For Epitope Retrieval, a microwave or pressure cooker may be substituted for the steamer method. Adjust times as necessary depending on conditions.
- For the initial IHC run with a new primary antibody, test tissues with and without Epitope Retrieval. In some instances, Epitope Retrieval may not be necessary.
- 200 ul is the recommended maximum volume to apply to a slide for full coverage. Using more than 200 ul may allow solutions to wick off the slide and create drying artifacts.
- For small tissue sections less than 200 ul may be used.
- 5 minutes of development with DAB Substrate should be sufficient. Do not develop for more than 10 minutes. If 5 minutes of development causes background staining,
further dilution of the primary antibody may be necessary.
-Hematoxylin should produce a light nuclear counterstain so as not to obscure the DAB staining. Counterstain for 1-1.5 minutes for nuclear antigens. Counterstain for 2-3 minutes for cytoplasmic and membranous antigens. If darker counterstaining is desired increase time (up to 10 minutes).
Protocol: Inhibition of Autophagy and LC3 Antibody (NB100-2331) Western Blot
Materials
Chloroquine diphosphate (CQ) (10 mM) in dH2O
1X PBS
Sample buffer, 2X Laemmli buffer: 4% SDS, 5% 2-mercaptoethanol (BME), 20% glycerol, 0.004% bromophenol blue, 0.125 M Tris HCl, pH 6.8
RIPA buffer: 150 mM NaCl, 1% NP-40 or Triton X-100, 0.5% sodium deoxycholate, 0.1% SDS, 50 mM Tris-HCl, pH 8.0, 20 mM Tris-HCl, pH 7.5
1X Running Buffer: 25 mM Tris-base, 192 mM glycine, 0.1% SDS. Adjust to pH 8.3
1X Transfer buffer (wet): 25 mM Tris-base, 192 mM glycine, 20% methanol, Adjust to pH 8.3
TBS
TBST, TBS and 0.1% Tween
Blocking solution: TBST, 5% non-fat dry milk
rabbit anti-LC3 primary antibody (NB100-2331) in blocking buffer (~2 ug/mL)
Methods
Tip: For more information on Western Blotting, see our Western Blot handbook.
1. Grow cells (e.g. HeLa or Neuro2A) in vitro to semi-confluency (70-75%).
2. Add CQ to culture dishes to a final concentration of 50 uM and incubate overnight (16 hours). Remember to include an untreated sample as a negative control.
Note: Validated autophagy inducers should be included as positive controls.
3. Rinse cells with ice-cold 1X PBS and lyse cells with sample buffer.
Note: LC3-I and LC3-II are sensitive to degradation, although LC3-I is more labile. These proteins are sensitive to freeze-thaw cycles and SDS sample buffers. Fresh samples should be analyzed quickly to prevent protein degradation.
4. Sonicate and incubate cells for 5 minutes at 95oC.
Tip: Cells are lysed directly in sample buffer or may be lysed in RIPA buffer.
5. Load samples of Chloroquine-treated and -untreated cell lysates 40 ug/lane on a 4-20% polyacrylamide gradient gel (SDS-PAGE).
Tip: For detection of LC3 it is particularly important to monitor the progress of the gel as this protein is relatively small (~14kDa).
Tip: Alternatively, for non-gradient gels, use a 20% polyacrylamide gel.
6. Transfer proteins to a 0.2 um PVDF membrane for 30 minutes at 100V.
7. After transfer, rinse the membrane with dH2O and stain with Ponceau S for 1-2 minutes to confirm efficiency of protein transfer.
8. Rinse the membrane in dH2O to remove excess stain and mark the loaded lanes and molecular weight markers using a pencil.
9. Block the membrane using blocking buffer solution (5% non-fat dry milk in TBST) for 1 hour at room temperature.
10.Rinse the membrane with TBST for 5 minutes.
11.Dilute the rabbit anti-LC3 primary antibody (NB100-2331) (~2 ug/mL) in blocking buffer and incubate the membrane for 1 hour at room temperature.
12.Rinse the membrane with dH2O.
13.Rinse the membrane with TBST, 3 times for 10 minutes each.
14.Incubate the membrane with diluted secondary antibody, according with product's specifications, (e.g. anti-rabbit-IgG HRP-conjugated) in blocking buffer for 1 hour at room temperature.
Note: Tween-20 may be added to the blocking or antibody dilution buffer at a final concentration of 0.05-0.2%, provided it does not interfere with antibody-antigen binding.
15.Rinse the membrane with TBST, 3 times for 10 minutes each.
16.Apply the detection reagent of choice (e.g. BioFX Super Plus ECL) in accordance with the manufacturer's instructions.
17.Image the blot.
Tip: LC3-I and it's lipidated form LC3-II have different electrophoretic mobility properties, with the lipidated form moving faster in an SDS-PAGE gel, albeit its larger molecular weight. LC3-II runs at 14-16 kDa while LC3-I runs at 16-18kDa.
Note: This assay measures the difference in the LC3-II signal in the presence and absence of inhibitors (e.g., lysosomotropic agents). When autophagic flux is present or induced in a system an increase in the LC3-II signal should be observed with the inhibitor.
Find general support by application which include: protocols, troubleshooting, illustrated assays, videos and webinars.
- 7-Amino Actinomycin D (7-AAD) Cell Viability Flow Cytometry Protocol
- Antigen Retrieval Protocol (PIER)
- Antigen Retrieval for Frozen Sections Protocol
- Appropriate Fixation of IHC/ICC Samples
- Cellular Response to Hypoxia Protocols
- ChIP Protocol Video
- Chromatin Immunoprecipitation (ChIP) Protocol
- Chromatin Immunoprecipitation Protocol
- Chromogenic IHC Staining of Formalin-Fixed Paraffin-Embedded (FFPE) Tissue Protocol
- Chromogenic Immunohistochemistry Staining of Frozen Tissue
- ClariTSA™ Fluorophore Kits
- Detection & Visualization of Antibody Binding
- ELISA Sample Preparation & Collection Guide
- ELISA Troubleshooting Guide
- Extracellular Membrane Flow Cytometry Protocol
- Flow Cytometry Protocol for Cell Surface Markers
- Flow Cytometry Protocol for Staining Membrane Associated Proteins
- Flow Cytometry Staining Protocols
- Flow Cytometry Troubleshooting Guide
- Fluorescent IHC Staining of Frozen Tissue Protocol
- Graphic Protocol for Heat-induced Epitope Retrieval
- Graphic Protocol for the Preparation and Fluorescent IHC Staining of Frozen Tissue Sections
- Graphic Protocol for the Preparation and Fluorescent IHC Staining of Paraffin-embedded Tissue Sections
- Graphic Protocol for the Preparation of Gelatin-coated Slides for Histological Tissue Sections
- How to Run an R&D Systems DuoSet ELISA
- How to Run an R&D Systems Quantikine ELISA
- How to Run an R&D Systems Quantikine™ QuicKit™ ELISA
- ICC Cell Smear Protocol for Suspension Cells
- ICC Immunocytochemistry Protocol Videos
- ICC for Adherent Cells
- IHC Sample Preparation (Frozen sections vs Paraffin)
- Immunocytochemistry (ICC) Protocol
- Immunocytochemistry Troubleshooting
- Immunofluorescence of Organoids Embedded in Cultrex Basement Membrane Extract
- Immunofluorescent IHC Staining of Formalin-Fixed Paraffin-Embedded (FFPE) Tissue Protocol
- Immunohistochemistry (IHC) and Immunocytochemistry (ICC) Protocols
- Immunohistochemistry Frozen Troubleshooting
- Immunohistochemistry Paraffin Troubleshooting
- Immunoprecipitation Protocol
- Intracellular Flow Cytometry Protocol Using Alcohol (Methanol)
- Intracellular Flow Cytometry Protocol Using Detergents
- Intracellular Nuclear Staining Flow Cytometry Protocol Using Detergents
- Intracellular Staining Flow Cytometry Protocol Using Alcohol Permeabilization
- Intracellular Staining Flow Cytometry Protocol Using Detergents to Permeabilize Cells
- Preparing Samples for IHC/ICC Experiments
- Preventing Non-Specific Staining (Non-Specific Binding)
- Primary Antibody Selection & Optimization
- Propidium Iodide Cell Viability Flow Cytometry Protocol
- Protocol for Heat-Induced Epitope Retrieval (HIER)
- Protocol for Liperfluo
- Protocol for Making a 4% Formaldehyde Solution in PBS
- Protocol for VisUCyte™ HRP Polymer Detection Reagent
- Protocol for the Characterization of Human Th22 Cells
- Protocol for the Characterization of Human Th9 Cells
- Protocol for the Fluorescent ICC Staining of Cell Smears - Graphic
- Protocol for the Fluorescent ICC Staining of Cultured Cells on Coverslips - Graphic
- Protocol for the Preparation & Fixation of Cells on Coverslips
- Protocol for the Preparation and Chromogenic IHC Staining of Frozen Tissue Sections
- Protocol for the Preparation and Chromogenic IHC Staining of Frozen Tissue Sections - Graphic
- Protocol for the Preparation and Chromogenic IHC Staining of Paraffin-embedded Tissue Sections
- Protocol for the Preparation and Chromogenic IHC Staining of Paraffin-embedded Tissue Sections - Graphic
- Protocol for the Preparation and Fluorescent ICC Staining of Cells on Coverslips
- Protocol for the Preparation and Fluorescent ICC Staining of Non-adherent Cells
- Protocol for the Preparation and Fluorescent ICC Staining of Stem Cells on Coverslips
- Protocol for the Preparation and Fluorescent IHC Staining of Frozen Tissue Sections
- Protocol for the Preparation and Fluorescent IHC Staining of Paraffin-embedded Tissue Sections
- Protocol for the Preparation of Gelatin-coated Slides for Histological Tissue Sections
- Protocol for the Preparation of a Cell Smear for Non-adherent Cell ICC - Graphic
- Protocol: Annexin V and PI Staining by Flow Cytometry
- Protocol: Annexin V and PI Staining for Apoptosis by Flow Cytometry
- Quantikine HS ELISA Kit Assay Principle, Alkaline Phosphatase
- Quantikine HS ELISA Kit Principle, Streptavidin-HRP Polymer
- R&D Systems Quality Control Western Blot Protocol
- Sandwich ELISA (Colorimetric) – Biotin/Streptavidin Detection Protocol
- Sandwich ELISA (Colorimetric) – Direct Detection Protocol
- TUNEL and Active Caspase-3 Detection by IHC/ICC Protocol
- The Importance of IHC/ICC Controls
- Troubleshooting Guide: ELISA
- Troubleshooting Guide: Fluorokine Flow Cytometry Kits
- Troubleshooting Guide: Immunohistochemistry
- Troubleshooting Guide: Western Blot Figures
- Western Blot Conditions
- Western Blot Protocol
- Western Blot Protocol for Cell Lysates
- Western Blot Troubleshooting
- Western Blot Troubleshooting Guide
- View all Protocols, Troubleshooting, Illustrated assays and Webinars
FAQs for LC3A Antibody - BSA Free
Showing
1
-
2 of
2 FAQs
Showing All
-
Q: Do you have any data or reason to believe the your LC3 antibody (NB100-2331) has a higher affinity to LC3-II than to LC3-I?
A: No, we do not have any data or reason to believe that NB100-2331 has a higher affinity to LC3-II than to LC3-I. This antibody was raised using a synthetic peptide made to an internal portion of the human LC3 protein sequence (between residues 25-121) as an immunogen and is expected to detect both LC3-I as well as LC3-II, and their signal will depend upon their respective amounts being present in your samples at the time of detection.
-
Q: I am interested in detecting the LC3 protein in the sea anemone Aiptasia. I have used your LC3 antibody (NB100-2331) and got a band in my Western blot at around 15 kD, which seems reasonable. However I would like to know how likely it is that your antibody binds to the LC3 protein of Aiptasia? Unfortunately I could not find the protein sequence against which the LC3 antibody was raised to and am hoping you could help me. The protein sequence for the Aiptasia LC3 is: MGDNNVLSYKPFKQRKSFVSRRDEVAGIRAKFPSKVPVIVERYHKERDLPLLDKTKFLVPQELTMSQFVTIIRNRMSLSS TQAFYLIVNNKSLASMSMTMAELYREEKDEDGFLYMVYASQEMFGCNS
A: In comparing the sequences of the human LC3 and Aiptasia proteins, and it seems as though there is very low homology. There is only 62% sequence similarity, and we generally don't recommend antibodies for novel species unless they have at least 85%. There is a chance that it will work, but we cannot guarantee it.
-
Q: Do you have any data or reason to believe the your LC3 antibody (NB100-2331) has a higher affinity to LC3-II than to LC3-I?
A: No, we do not have any data or reason to believe that NB100-2331 has a higher affinity to LC3-II than to LC3-I. This antibody was raised using a synthetic peptide made to an internal portion of the human LC3 protein sequence (between residues 25-121) as an immunogen and is expected to detect both LC3-I as well as LC3-II, and their signal will depend upon their respective amounts being present in your samples at the time of detection.
-
Q: I am interested in detecting the LC3 protein in the sea anemone Aiptasia. I have used your LC3 antibody (NB100-2331) and got a band in my Western blot at around 15 kD, which seems reasonable. However I would like to know how likely it is that your antibody binds to the LC3 protein of Aiptasia? Unfortunately I could not find the protein sequence against which the LC3 antibody was raised to and am hoping you could help me. The protein sequence for the Aiptasia LC3 is: MGDNNVLSYKPFKQRKSFVSRRDEVAGIRAKFPSKVPVIVERYHKERDLPLLDKTKFLVPQELTMSQFVTIIRNRMSLSS TQAFYLIVNNKSLASMSMTMAELYREEKDEDGFLYMVYASQEMFGCNS
A: In comparing the sequences of the human LC3 and Aiptasia proteins, and it seems as though there is very low homology. There is only 62% sequence similarity, and we generally don't recommend antibodies for novel species unless they have at least 85%. There is a chance that it will work, but we cannot guarantee it.
Loading...