LC3B Antibody - BSA Free
Novus Biologicals | Catalog # NB100-2220

Key Product Details
Validated by
Knockout/Knockdown, Biological Validation
Species Reactivity
Validated:
Human, Mouse, Rat, Porcine, Alligator, Avian, Bacteria, Bovine, Canine, Chicken, Chinese Hamster, Golden Syrian Hamster, Guinea Pig, Hamster, Invertebrate, Monkey, Primate, Rabbit, Zebrafish
Cited:
Human, Mouse, Rat, Porcine, Alligator, Avian, Avian - Chicken, Bacteria, Bovine, Canine, Fish - Danio rerio (Zebrafish), Golden Syrian Hamster, Guinea Pig, Hamster, Insect - Drosophila melanogaster, Invertebrate, Nematode - Caenorhabditis elegans, Primate, Primate - Macaca mulatta (Rhesus Macaque), Rabbit
Applications
Validated:
Knockout Validated, Immunohistochemistry, Immunohistochemistry-Paraffin, Immunohistochemistry-Frozen, Western Blot, Immunoblotting, ELISA, Flow Cytometry, Immunocytochemistry/ Immunofluorescence, Simple Western, Immunoprecipitation, Chromatin Immunoprecipitation (ChIP), Proximity Ligation Assay, Knockdown Validated, SDS-Page
Cited:
Knockout Validated, Immunohistochemistry, Immunohistochemistry-Paraffin, Immunohistochemistry-Frozen, Western Blot, Immunoblotting, ELISA, Block/Neutralize, Flow Cytometry, Immunocytochemistry, Immunocytochemistry/ Immunofluorescence, Simple Western, Immunoprecipitation, Chemotaxis, Proximity Ligation Assay, IF/IHC, Electron Microscopy, Knockdown Validated, SDS-Page
Label
Unconjugated
Antibody Source
Polyclonal Rabbit IgG
Format
BSA Free
Loading...
Product Specifications
Immunogen
Polyclonal LC3B Antibody was made to a synthetic peptide made to an N-terminal portion of the human LC3B protein sequence (between residues 1-100). [UniProt# Q9GZQ8]
Reactivity Notes
Use in Rat reported in scientific literature (PMID:34622072). Use in Chinese Hamster reported in scientific literature (PMID:34332287). Mouse reactivity reported in scientific literature (PMID:32814898). Bovine reactivity reported in scientific literature (PMID: 24895572). Primate reactivity reported in scientific literature (PMID: 25142602). Canine reactivity reported in scientific literature (PMID: 25839646). Avian reactivity reported in scientific literature (PMID: 29546310). Hamster reactivity reported in scientific literature (PMID: 26423766). Rabbit reactivity reported in scientific literature (PMID: 26497211). The mouse detection has been reported to be weaker than the human. Immunogen displays the following percentage of sequence identity for non-tested species: Xenopus 84%. Invertebrate reactivity reported in scientific literature (PMID: 26716072 ). Monkey reactivity reported in scientific literature (PMID: 30324853). Guinea pig reactivity reported from a verified customer review. Rat reactivity reported in scientific literature (PMID: 30744518). Bacteria reactivity reported in scientific literature (PMID: 28783414). Chicken reactivity reported in scientific literature (PMID: 30649814). Porcine reactivity reported in scientific literature (PMID: 30789643). Golden Syrian hamster reactivity reported in scientific literature (PMID: 23180219). Zebrafish reactivity reported in scientific literature (PMID: 29185873). Human reactivity reported in scientific literature (PMID:33086573). Use in Alligator reported in scientific literature (PMID:32061056).
Localization
Type I form of LC3B is cytoplasmic, whereas the type II form of LC3B binds to the autophagic membranes.
Marker
Autophagosome Marker
Clonality
Polyclonal
Host
Rabbit
Isotype
IgG
Theoretical MW
14.688 kDa.
Disclaimer note: The observed molecular weight of the protein may vary from the listed predicted molecular weight due to post translational modifications, post translation cleavages, relative charges, and other experimental factors.
Disclaimer note: The observed molecular weight of the protein may vary from the listed predicted molecular weight due to post translational modifications, post translation cleavages, relative charges, and other experimental factors.
Scientific Data Images for LC3B Antibody - BSA Free
Knockout Validation of LC3B Antibody in HeLa and LC3B Knockout HeLa Cells in Western Blot
Lysates of HeLa parental cell line and LC3B knockout HeLa cell line (KO) untreated (-) or treated (+) with 50 uM CQ for 18 hours. PVDF (Polyvinylidene difluoride) membrane was probed with 0.5 ug/mL of Rabbit Anti-LC3B Polyclonal Antibody (Catalog # NB100-2220) followed by HRP-conjugated Anti-Rabbit IgG Secondary Antibody (Catalog# HAF008). A specific band was detected for LC3B at a molecular weight of approximately 15 kDa (as indicated) in the parental HeLa cell line, but is not detectable in the knockout HeLa cell line. GAPDH is shown as a loading control. This experiment was conducted under reducing conditions.
Knockout Validation of LC3B Antibody in HeLa and LC3B Knockout HeLa Cells in Immunocytochemistry/Immunofluorescence
LC3B was detected in immersion fixed CQ treated HeLa cells (left) but was not detected in LC3B knockout HeLa cells (right) using rabbit anti-human LC3B polyclonal antibody (Catalog #NB100-2220) at 0.3 ug/mL for 3 hours at room temperature. Cells were stained using the NorthernLights(TM) 557-conjugated anti-Rabbit IgG Secondary Antibody (red; Catalog # NL004) and counterstained with DAPI (blue). Specific staining was localized to cytoplasm.

Immunofluorescent Staining of LC3B in Mouse Aortas
LC3B-Antibody-Immunohistochemistry-NB100-2220-img0074.jpg
Detection of LC3 in Human Muscle Fibers
LC3 accumulation in muscle fibers from patients with PAD (row B - E). Normal fibers from a Non-PAD sample (row A). Scale bar = 100 uM. Image from verified customer review.
LC3 Localization in Villous and Extravillous Trophoblasts
LC3B-Antibody-Immunohistochemistry-NB100-2220-img0066.jpg
Western Blotting of LC3B in Mouse ES Cell Lysates
Detection of LC3B in mouse ES cell lysates using Rabbit anti- [Catalog # NB100-2220]. LC3 detected at a molecular weight of approximately 17 kDa. Atg5-/- ES cells from Dr. Noboru Mizushima [Mizushima, N. et al. J. Cell Biol. 152 (2001)] Photo courtesy of Dr. Beth Levine, UT SW Medical Center.
Staining of LC3 in MelJuSo Cells
LC3B-Antibody-Immunocytochemistry-Immunofluorescence-NB100-2220-img0072.jpg
Western Blot Detection of LC3 in Mouse and Rat Cell Lysates
Lysates of mouse NIH3T3 and rat PC-12 cell lines untreated (-) or treated (+) with CQ. PVDF (Polyvinylidene difluoride) membrane was probed with 0.5 ug/mL rabbit anti-LC3B polyclonal Antibody (Catalog # NB100-2220, Novus Biologicals), followed by 1:2000 dilution of goat anti-rabbit IgG secondary antibody. LC3 detected at a molecular weight of approximately 15 kDa in treated NIH3T3 and PC-12 cells.

Western Blotting of LC3B-I and LC3B-II in Human Dopaminergic Neurons
Autophagy Investigation. (A) Representative WBs (Western Blots) of LC3B-I, LC3B-II and GAPDH loading control in DANs derived from 4 iPD patients and 4 healthy controls. (B) WBs from three independent experiments were quantified by densitometry and LC3B-II normalized to a loading control. Grouping of data by healthy vs iPD as well as iPD stratified for T/T and C/C genotype. (C) Ratio of LC3B-II (normalized to loading control) following bafilomycin treatment/untreated. Citation: Marrone L, Bus C, Schondorf D, Fitzgerald JC, Kubler M, Schmid B, et al. (2018) Generation of iPSCs carrying a common LRRK2 risk allele for in vitro modeling of idiopathic Parkinson's disease. PLoS ONE 13(3): e0192497. https://doi.org/10.1371/journal.pone.0192497


Staining of LC3 in Rat Neurons
LC3B-Antibody-Immunocytochemistry-Immunofluorescence-NB100-2220-img0064.jpg
Staining of LC3 in Rat Spinal Cord
LC3B-Antibody-Immunocytochemistry-Immunofluorescence-NB100-2220-img0065.jpg
Immunohistochemical Staining of LC3B in Rat Brain
Staining of rat brain tissue section. Analysis using Rabbit anti-LC3B Antibody [Catalog # NB100-2220]. Image from verified customer review.
Immunohistochemical Staining of LC3B in Paraffin Embedded Ovarian Cancer Tissue
Human ovarian Cancer tissue stained using heat mediated antigen retrieval in pH 6.0 citrate buffer at 1:200 dilution. Image provided by verified customer review.
Immunohistochemical Staining of LC3 in Mouse Brain
FFPE (Formalin-Fixed Paraffin-Embedded) tissue section of mouse brain using 1:200 dilution of Rabbit anti-LC3B antibody [Catalog # NB100-2220]. The specific signal of LC3 was detected using HRP-conjugated secondary antibody with DAB (3, 3 -diaminobenzidine) reagent, and nuclei of cells were counterstained using hematoxylin. This LC3B antibody generated a low to moderate levels of cytoplasmic staining in the glial cells. The neurons depicted a moderate to strong staining for LC3 in their cytoplasm.
Immunohistochemistry in Brain Tissue Using Biotinylated LC3B Antibody
Analysis using the Biotin conjugate of Rabbit anti-LC3B Antibody [Catalog # NB100-2220]. Staining of brain, cerebral cortex, neurons with cell processes.
Detection of LC3B in Neuro2A Cell Lysate Using Simple Western
Image shows a specific band for LC3B at a molecular weight of approximately 15 kDa in 0.5 mg/mL of Neuro2A lysate. This experiment was performed under reducing conditions using the 12-230 kDa separation system.
Western Blot: LC3B Antibody - BSA Free [NB100-2220] -
TP53 knockout triggers a pro-mitophagic response.PINK1 (a,b, N = 8), LC3-2/LC3-1 (a,c, N = 8), p62 (a,d, N = 12), TIM23 (a,e, N = 10), TOM20 (a,f, N = 9), HSP60 (a,g, N = 16), optineurin (a,h, N = 9) & NDP52 (a,i, N = 8) protein levels were analyzed in control (p53+/+) or TP53-deficient (p53−/−) HAP1 cells as described in the Methods. Bars represent the means ± SEM of 3-4 independent experiments performed in triplicate & are expressed as percent of control (p53+/+) cells. Actin expression is provided as a representative gel loading control in a. Statistical analyses were performed with GraphPad Prism software by using unpaired Student’s t-test. Significant differences are: ** p < 0.01, ***p < 0.001 & ****p < 0.0001. Image collected & cropped by CiteAb from the following publication (https://pubmed.ncbi.nlm.nih.gov/29352272), licensed under a CC-BY license. Not internally tested by Novus Biologicals.
Western Blot: LC3B Antibody - BSA Free [NB100-2220] -
Western Blot: LC3B Antibody - BSA Free [NB100-2220] - SsD treatment of HeLa cells increases lysosomal pH & induces TFEB nuclear translocation. a, b SsD (15 μM) led to an increase of lysosomal pH in HeLa cells as measured using Lysosensor DND-189 (a) or the quantitative ratiometric LysoSensor Yellow/Blue DND-160 (b). The graphs in (b) & (c) represent data from three independent experiments, & data are expressed as the means ± S.D., n = 3. The asterisk (*) symbols indicates p < 0.05 by t-test analysis. c HeLa cells were transfected with TFEB-GFP & treated with or without SsD (15 μM) or underwent starvation before confocal imaging. d HeLa cells were transfected with siGFP or siTFEB & treated with or without SsD (15 μM), & then LC3, p62, TFEB, or GAPDH immunoblot analyses were performed Image collected & cropped by CiteAb from the following publication (https://pubmed.ncbi.nlm.nih.gov/30820356), licensed under a CC-BY license. Not internally tested by Novus Biologicals.
Immunocytochemistry/ Immunofluorescence: LC3B Antibody - BSA Free [NB100-2220] -
Immunocytochemistry/ Immunofluorescence: LC3B Antibody - BSA Free [NB100-2220] - Endogenous LC3 accumulates around lysosomes.Wild type MEFs were treated with LCL161 (5 µM) or birinapant (50 µM) or DMSO as a control for 6 h. Cells were fixed & stained with antibodies against LAMP2 (red channel) & LC3 (green channel). Cells were imaged by confocal microscopy Image collected & cropped by CiteAb from the following publication (https://pubmed.ncbi.nlm.nih.gov/29743550), licensed under a CC-BY license. Not internally tested by Novus Biologicals.
Western Blot: LC3B Antibody - BSA Free [NB100-2220] -
Western Blot: LC3B Antibody - BSA Free [NB100-2220] - Autophagy is involved in EV-A71 replication in HeLa cells. a VP1 synthesis was dramatically reduced by BAF (50 or 10 nM) treatment in EV71-infected cells compared to cells without BAF treatment. b ATG5 knockdown markedly inhibited EV-A71 infection in HeLa cells. c SsD treatment failed to further inhibit AV-A71 infection in ATG5-knockdown HeLa cells. d Rapamycin treatment enhanced EV-A71 infection in HeLa cells. e SsD treatment markedly inhibited EV-A71 infection in HeLa cells treated with or without Torin-1 Image collected & cropped by CiteAb from the following publication (https://pubmed.ncbi.nlm.nih.gov/30820356), licensed under a CC-BY license. Not internally tested by Novus Biologicals.
Western Blot: LC3B Antibody - BSA Free [NB100-2220] -
Western Blot: LC3B Antibody - BSA Free [NB100-2220] - Topotecan treatment triggers autophagy in colon cancer cells.A. HCT116, LS-174T & HT29 cells were transfected for 24 h with an expression construct encoding LC3 fused to the yellow fluorescent protein (YFP-LC3). Thereafter, the cells were treated with or without 1 µg/mL topotecan (TPT) for 24 h & visualised under a confocal microscope. B. The indicated cells were treated with the indicated concentrations of topotecan for 24 h. The lysates were analysed by immunoblotting with The LC3 & P62 antibodies. Image collected & cropped by CiteAb from the following publication (https://pubmed.ncbi.nlm.nih.gov/23024792), licensed under a CC-BY license. Not internally tested by Novus Biologicals.
Immunohistochemistry: LC3B Antibody - BSA Free [NB100-2220] -
Immunohistochemistry: LC3B Antibody - BSA Free [NB100-2220] - LC3 expression in the adjacent non-tumor tissues by immunohistochemistry stainingRepresentative images of areas according to the proportion of positive cells (A–D) & intensity of staining (E–H). (A) none, (B) < 10%, (C) 10–50%, (D) > 50%; & staining (E) absent, (F) weak, (G) moderate, (H) strong. (upper panel, x200; lower panel, x400). Image collected & cropped by CiteAb from the following publication (https://pubmed.ncbi.nlm.nih.gov/29190884), licensed under a CC-BY license. Not internally tested by Novus Biologicals.
Western Blot: LC3B Antibody - BSA Free [NB100-2220] -
Western Blot: LC3B Antibody - BSA Free [NB100-2220] - P53 mediates topotecan-induced autophagy through the activation of sestrin 2 & AMPK in colon cancer cells with wild-type p53.A. HCT116 & LS-174T cells were treated with various concentrations of TPT for 24 h. The levels of P53, sestrin2 & p-AMPK were analysed by immunoblotting. B. HCT116 cells were transfected with p53 or sestrin 2 siRNAs for 24 h, treated with or without 1 µg/mL TPT for an additional 24 h, & the indicated proteins were then analysed by immunoblotting. C. HCT116 cells were transfected with LKB1 or CaMKK beta siRNAs, treated with or without 1 µg/mL TPT for an additional 24 h, & the indicated proteins were detected by immunoblotting. Image collected & cropped by CiteAb from the following publication (https://pubmed.ncbi.nlm.nih.gov/23024792), licensed under a CC-BY license. Not internally tested by Novus Biologicals.
Western Blot: LC3B Antibody - BSA Free [NB100-2220] -
Western Blot: LC3B Antibody - BSA Free [NB100-2220] - Specific inhibitor SP600125 or siRNA directed JNK blocked ceramide-induced autophagy & up-regulation of LC3 expression. (A) SUNE1 cells were treated with 20 μM ceramide for 24 h in the absence or presence of SP600125 or JNK1/2 siRNA. Lysates were analyzed by immunoblotting. (B) Autophagosome formation was visualized using YFP-LC3 expressing & observed under a confocal microscope. Representative immunofluorescence pictures are shown at the original magnification × 1000. (C) The expression of LC3 mRNA was examined by RT-PCR analysis. Image collected & cropped by CiteAb from the following publication (https://pubmed.ncbi.nlm.nih.gov/21943220), licensed under a CC-BY license. Not internally tested by Novus Biologicals.
Western Blot: LC3B Antibody - BSA Free [NB100-2220] -
Western Blot: LC3B Antibody - BSA Free [NB100-2220] - Glutamine deprivation induces IL-8 secretion.(a) RT–PCR analysis of LC3, IL-8, CHOP & GADD34 in U2OS cells subjected to glutamine deprivation (−Q) or exposed to TPG (1 μM). (b) Immunoblot analysis of ER stress- & autophagy-related proteins in U2OS cells subjected to glutamine deprivation or TPG treatment. Samples are run in triplicate. (c) Cytokine array analysis of conditioned media from U2OS & A549 cells grown in the presence (+Q) or absence (−Q) of glutamine. (d) IL-8 enzyme-linked immunosorbent assay of conditioned media from U2OS & A549 cells grown in the presence (+Q) or absence (−Q) of glutamine. Error bars in all figures represent s.d. of three biological replicates. Image collected & cropped by CiteAb from the following publication (https://www.nature.com/articles/ncomms5900), licensed under a CC-BY license. Not internally tested by Novus Biologicals.
Western Blot: LC3B Antibody - BSA Free [NB100-2220] -
Western Blot: LC3B Antibody - BSA Free [NB100-2220] - NDs API improves ATO-based therapy in vivo. HepG2 tumor-bearing nude mice administered intravenously (i.v.) w/ NS (200 μL), NDs (5 mg kg−1), ATO (0.75 mg kg−1), ATO (1.5 mg kg−1), NDs–0.75 mg kg−1 ATO mixture,/NDs–1.5 mg kg−1 ATO mixture daily for 5 consecutive days every week, w/ 13-week cycles c Immunoblots of autophagy-related proteins LC3-II, p62 (left); semi-quantified analysis (n = 3) in tumor tissues from mice after treatment (right). GAPDH used as loading control. Normalized band densities shown below each band. Image collected & cropped by CiteAb from following publication (https://pubmed.ncbi.nlm.nih.gov/30341298), licensed under a CC-BY license. Not internally tested by Novus Biologicals.
Immunocytochemistry/ Immunofluorescence: LC3B Antibody - BSA Free [NB100-2220] -
Immunocytochemistry/ Immunofluorescence: LC3B Antibody - BSA Free [NB100-2220] - NDs API improves the ATO-based therapy in vivo. HepG2 tumor-bearing nude mice administered intravenously (i.v.) w/ NS (200 μL), NDs (5 mg kg−1), ATO (0.75 mg kg−1), ATO (1.5 mg kg−1), NDs–0.75 mg kg−1 ATO mixture,/NDs–1.5 mg kg−1 ATO mixture daily for 5 consecutive days every week, w/ 13-week cycles. g Immunostaining of LC3 & ATG13 in tumor tissues of NDs–1.5 mg kg−1 ATO-treated mice. Schematic showing (left) & imaging (right) indicate that LC3/Atg13 puncta in periphery & around the blood vessels inside the tumors. Scale bars: 20 μm. Error bars s.d. Image collected & cropped by CiteAb from the following publication (https://pubmed.ncbi.nlm.nih.gov/30341298), licensed under a CC-BY license. Not internally tested by Novus Biologicals.
Immunohistochemistry: LC3B Antibody - BSA Free [NB100-2220] -
Immunohistochemistry: LC3B Antibody - BSA Free [NB100-2220] - LC3, CRF, & HIF-1 alpha expression. (a) for each antibody the spatial distribution of immunohistochemical staining was the same in cases with spontaneous & induced labor. (b) The analysis of data from optical density values of Western blotting bands shows no differences of LC3-II & HIF-1 alpha expression between groups. On the contrary CRF is higher in spontaneous labor. LC3-II, HIF-1 alpha, & CRF are normalized onto alpha -tubulin. (c) No correlation between LC3-II & CRF expression was found. SP: spontaneous labor; PG: induction with prostaglandin; PO: induction with prostaglandin & oxytocin; OX: induction with oxytocin. Image collected & cropped by CiteAb from the following publication (https://pubmed.ncbi.nlm.nih.gov/23956998), licensed under a CC-BY license. Not internally tested by Novus Biologicals.
Immunocytochemistry/ Immunofluorescence: LC3B Antibody - BSA Free [NB100-2220] -
Immunocytochemistry/ Immunofluorescence: LC3B Antibody - BSA Free [NB100-2220] - The time-dependent effects of melatonin on the LC3-II & Beclin 1 expression in U87MG (a, b) & A172 (c, d) cells. The cells were treated with 1 mM melatonin for 4, 12, 24 or 36 h. PBS was used as a negative control, & rapamycin (Rap 200 nM) served as a positive control. The levels of LC3-II & Beclin-1 expression were determined by a Western blot analysis. The protein bands for each regimen were quantified by densitometry, & their differences are presented in the graph. The values represent the mean ± S.E.M. for three separate determinations. Statistical significance * at P < 0.05 or ** at P < 0.01 compared with untreated controls Image collected & cropped by CiteAb from the following publication (https://pubmed.ncbi.nlm.nih.gov/31870319), licensed under a CC-BY license. Not internally tested by Novus Biologicals.
Immunocytochemistry/ Immunofluorescence: LC3B Antibody - BSA Free [NB100-2220] -
Immunocytochemistry/ Immunofluorescence: LC3B Antibody - BSA Free [NB100-2220] - Melatonin-induced autophagy was abolished by treatment with an autophagy inhibitor, 3-MA. The results of the Western blotting of LC3 & Beclin-1 in the U87MG (a, b) & A172 (c, d) cells treated with PBS (control) or melatonin (MLT 1 mM) for 24 h in the presence & absence of 3-MA (10 mM). Statistical significance * at P < 0.05 compared with untreated controls or the corresponding group Image collected & cropped by CiteAb from the following publication (https://pubmed.ncbi.nlm.nih.gov/31870319), licensed under a CC-BY license. Not internally tested by Novus Biologicals.
Immunocytochemistry/ Immunofluorescence: LC3B Antibody - BSA Free [NB100-2220] -
Immunocytochemistry/ Immunofluorescence: LC3B Antibody - BSA Free [NB100-2220] - TonEBP haploinsufficient mice do not show altered autophagy in NP. LC3 immunofluorescence staining of intervertebral discs from 4-month-old TonEBP+/+ (a–c) & haploinsufficient TonEBP+/− (d–f) mice demonstrated similar pattern & distribution of LC3 positive autophagosomes. (a,d) White dotted line demarks the NP tissue compartment. (c,f) Magnified images of dotted inserts from B & E respectively. White arrows indicate LC3-positive autophagosomes. Scale bar: 200 μm for (a) & (d); 20 μm for (b), (c), (e), & (f). Image collected & cropped by CiteAb from the following publication (https://pubmed.ncbi.nlm.nih.gov/28674405), licensed under a CC-BY license. Not internally tested by Novus Biologicals.
Western Blot: LC3B Antibody - BSA Free [NB100-2220] -
Western Blot: LC3B Antibody - BSA Free [NB100-2220] - PLD1 silencing prevents TNP-induced autophagy & decreases in HIV p24 release. Mock- & HIV-infected macrophages (A to C) & CD4+ T cells (D to F) transfected with PLD1 siRNA (siPLD1) or scrambled siRNA (siNS) were exposed to vehicle, 400 μg ml−1 RBC-NP (R), or 400 μg ml−1 TNP (T) for 4 h, washed three times with PBS, & then incubated for a further 24 h. n = 4. (A & D) (Bottom) Representative western blots of PLD1. (Top) Densitometric analysis of blots. (B & E) (Top) Representative western blots of LC3B isoforms & SQSTM1. (Bottom) Densitometric analysis of blots. (C & F) Enzyme-linked immunosorbent assays were performed for HIV p24 antigen in the supernatant. Image collected & cropped by CiteAb from the following publication (https://pubmed.ncbi.nlm.nih.gov/32934078), licensed under a CC-BY license. Not internally tested by Novus Biologicals.
Western Blot: LC3B Antibody - BSA Free [NB100-2220] -
Western Blot: LC3B Antibody - BSA Free [NB100-2220] - GII-NTPase possesses proapoptotic activity, which can be further enhanced by Nterm or P22. (A) Effects of GII-NTPase or its deletion mutants on cell apoptosis, autophagy, & ER stress. After transfection of the indicated GII-NTPase expression plasmids into 293T cells for 24 h, the expression of specific markers for apoptosis (PARP or caspase 3), autophagy (LC3B), & ER stress (GRP78) were examined by Western blotting. (B) Enhancement of the GII-NTPase-mediated apoptosis by Nterm or P22. 293T cells were cotransfected with the indicated plasmids expressing GII-NTPase, Nterm, or P22. After 24 h of transfection, the expression of cleaved PARP & caspase 3 in the cells was analyzed by Western blotting. Image collected & cropped by CiteAb from the following publication (https://pubmed.ncbi.nlm.nih.gov/29212938), licensed under a CC-BY license. Not internally tested by Novus Biologicals.
Immunocytochemistry/ Immunofluorescence: LC3B Antibody - BSA Free [NB100-2220] -
Immunocytochemistry/ Immunofluorescence: LC3B Antibody - BSA Free [NB100-2220] - The concentration-dependent effects of melatonin on the LC3-II & Beclin-1 expression in U87MG (a, b) & A172 (c, d) cells. The cells were treated with 100, 200, 1000 or 2000 μM of melatonin for 24 h. PBS was used as a negative control, & rapamycin (Rap 200 nM) served as a positive control. The levels of LC3-II & Beclin-1 expression were determined by a Western blot analysis. The protein bands for each regimen were quantified by densitometry, & their differences are presented in the graph. The values are represented as the mean ± S.E.M. for three separate determinations. Statistical significance * at P < 0.05 or ** at P < 0.01 compared with untreated controls Image collected & cropped by CiteAb from the following publication (https://pubmed.ncbi.nlm.nih.gov/31870319), licensed under a CC-BY license. Not internally tested by Novus Biologicals.
Immunohistochemistry-Paraffin: LC3B Antibody - BSA Free [NB100-2220] -
Immunohistochemistry-Paraffin: LC3B Antibody - BSA Free [NB100-2220] - Western blot analysis of human recombinant microtubule-associated proteins 1A/1B light chain 3A & 3B probed with either a the Abgent anti-LC3 antibody (AP1802a), or b MBL anti-LC3A/B antibody. LC3 bands were quantified using the Odyssey Infrared Imaging System (Li-Cor), & data presented as integrated intensities (n = 3). c Analysis of LC3B distribution in untreated OE21 & OE33 esophageal cancer cell lines. Arrows indicate diffuse cytoplasmic LC3B expression (magnification 400×) (n = 6). d Analysis of LC3B distribution in untreated KYSE450 & OE19 esophageal cell lines. Arrows indicate the presence of LC3B crescent or ring-like (upper panels) & globular (lower panels) structures in KYSE450 & OE19 cells (magnification 1000×) (n = 6) Image collected & cropped by CiteAb from the following publication (https://pubmed.ncbi.nlm.nih.gov/26265176), licensed under a CC-BY license. Not internally tested by Novus Biologicals.
Western Blot: LC3B Antibody - BSA Free [NB100-2220] -
Western Blot: LC3B Antibody - BSA Free [NB100-2220] - Expression of autophagy-related proteins. MDA-MB231 & MCF-7 cells were treated with different concentrations of T33 for 48 h & a expressions of LC3-I & LC3-II proteins in MDA-MB231 & MCF-7 cells were detected with immunoblotting. Ratios of LC3-II/ beta -Actin in b MDA-MB231 & MCF-7 cells are shown. Similar results were observed in triplicate experiments. The superscripts 1, 2, & 3 refer to significant differences (P < 0.05) from the MDA-MB231 control, MCF-7 control & MDA-MB231, respectively Image collected & cropped by CiteAb from the following publication (https://pubmed.ncbi.nlm.nih.gov/31409331), licensed under a CC-BY license. Not internally tested by Novus Biologicals.
Immunohistochemistry: LC3B Antibody - BSA Free [NB100-2220] -
Immunohistochemistry: LC3B Antibody - BSA Free [NB100-2220] - CB1 knockout elevated autophagy in the liver of HBs transgenic mice. a Representative immunohistochemical analysis of paraffin-embedded liver sections from 52-week-old mice was performed using anti-LC3B antibody. Original image magnification ×1000, bar 40 µm. b Quantification of LC3B puncta assessed with ImageJ software & expressed as % of LC3B staining/field. c Western blot analysis of lysates from 52-week-old mice was performed using specific anti-LC3B & anti-p62 antibodies. d Representative immunofluorescence analysis of paraffin-embedded liver sections of 52-week-old mice was performed using specific anti-LAMP1 antibodies (red). Nuclei were stained with DAPI (blue). Magnification ×1000, bar 40 µm Image collected & cropped by CiteAb from the following publication (https://pubmed.ncbi.nlm.nih.gov/31570772), licensed under a CC-BY license. Not internally tested by Novus Biologicals.
Immunocytochemistry/ Immunofluorescence: LC3B Antibody - BSA Free [NB100-2220] -
Immunocytochemistry/ Immunofluorescence: LC3B Antibody - BSA Free [NB100-2220] - The concentration-dependent effects of melatonin on the LC3-II & Beclin-1 expression in U87MG (a, b) & A172 (c, d) cells. The cells were treated with 100, 200, 1000 or 2000 μM of melatonin for 24 h. PBS was used as a negative control, & rapamycin (Rap 200 nM) served as a positive control. The levels of LC3-II & Beclin-1 expression were determined by a Western blot analysis. The protein bands for each regimen were quantified by densitometry, & their differences are presented in the graph. The values are represented as the mean ± S.E.M. for three separate determinations. Statistical significance * at P < 0.05 or ** at P < 0.01 compared with untreated controls Image collected & cropped by CiteAb from the following publication (https://pubmed.ncbi.nlm.nih.gov/31870319), licensed under a CC-BY license. Not internally tested by Novus Biologicals.
Western Blot: LC3B Antibody - BSA Free [NB100-2220] -
Western Blot: LC3B Antibody - BSA Free [NB100-2220] - TLR4 is critical to Hsp70/Hsp90-induced muscle wasting in mice. a Hsp70 & Hsp90-induced muscle catabolism in mice is dependent on TLR4. Wild-type & TLR4 null mice were injected with rHsp70 & rHsp90 & analyzed for catabolic response in TA as described in Fig. 4. b Hsp70 & Hsp90-induced muscle wasting is TLR4-dependent. Wild-type & TLR4 null mice injected with rHsp70 & rHsp90 are further analyzed for muscle wasting. Scale bar, 100 μm. Data (n = 5) were analyzed by analysis of variance or χ2 analysis (for CSA). * denotes a difference (P < 0.05) Image collected & cropped by CiteAb from the following publication (https://www.nature.com/articles/s41467-017-00726-x), licensed under a CC-BY license. Not internally tested by Novus Biologicals.
Immunohistochemistry: LC3B Antibody - BSA Free [NB100-2220] -
Immunohistochemistry: LC3B Antibody - BSA Free [NB100-2220] - Representative images of gastrocnemius muscle sections from non-PAD & PAD subjects stained for LC3, an autophagosome marker (red) & LAMP2, a lysosome marker (green). A In non-PAD, very little LC3 & LAMP2 staining is apparent. In PAD, rare fibers show co-localization of accumulated LC3 & LAMP2 (B), whereas the majority of fibers have elevated LC3 accumulation but no co-localization with LAMP2 (C). Arrows in the same column point to the same areas of LC3 accumulation in the center of the fiber with or without LAMP2 co-localization. Scale bar = 50μm Image collected & cropped by CiteAb from the following publication (https://pubmed.ncbi.nlm.nih.gov/27687713), licensed under a CC-BY license. Not internally tested by Novus Biologicals.
Immunocytochemistry/ Immunofluorescence: LC3B Antibody - BSA Free [NB100-2220] -
Immunocytochemistry/ Immunofluorescence: LC3B Antibody - BSA Free [NB100-2220] - Melatonin-induced autophagy was abolished by treatment with an autophagy inhibitor, 3-MA. The results of the Western blotting of LC3 & Beclin-1 in the U87MG (a, b) & A172 (c, d) cells treated with PBS (control) or melatonin (MLT 1 mM) for 24 h in the presence & absence of 3-MA (10 mM). Statistical significance * at P < 0.05 compared with untreated controls or the corresponding group Image collected & cropped by CiteAb from the following publication (https://pubmed.ncbi.nlm.nih.gov/31870319), licensed under a CC-BY license. Not internally tested by Novus Biologicals.
Western Blot: LC3B Antibody - BSA Free [NB100-2220] -
Western Blot: LC3B Antibody - BSA Free [NB100-2220] - Vacuolin-1 analogues identified via virtual screening induced the accumulation of both LC3B-II & SQSTM1 in HeLa cells in a dose dependent manner after a 6 h treatment. Image collected & cropped by CiteAb from the following publication (https://pubmed.ncbi.nlm.nih.gov/28555021), licensed under a CC-BY license. Not internally tested by Novus Biologicals.
Western Blot: LC3B Antibody - BSA Free [NB100-2220] -
Western Blot: LC3B Antibody - BSA Free [NB100-2220] - Inhibition of autophagy in MYOCD-knockdown cells restored the expression of contractile proteins.HA-VSMCs were transfected with shMYOCD plasmid for 4 h & then treated with 5 mM 3-MA for another 48 h. Western blot images & quantification in each group were shown (*P < 0.05, **P < 0.01, n = 3). Image collected & cropped by CiteAb from the following publication (https://pubmed.ncbi.nlm.nih.gov/35136037), licensed under a CC-BY license. Not internally tested by Novus Biologicals.
Immunohistochemistry: LC3B Antibody - BSA Free [NB100-2220] -
Immunohistochemistry: LC3B Antibody - BSA Free [NB100-2220] - Accumulation of an autophagosome marker in the presynaptic terminals of NMJs of SOD1G93A mice (A) Representative confocal micrographs of immunohistochemistry showing accumulation of the autophagosome marker LC3 (grayscale in left panels, green in right panels) in presynaptic terminals of diaphragm NMJs in SOD1G93A mice at P120, but not at NMJs of wild-type mice at P140. Nerves were stained using anti-neurofilament & anti-SV2 antibodies (blue), & postsynaptic acetylcholine receptors were labeled with Alexa 594-conjugated alpha -bungarotoxin (red). In these cross-section images of NMJs, presynaptic terminals are above the bungarotoxin signal, & postsynaptic myotubes are below the bungarotoxin signal. Scale bar: 10 μm. (B) The number of NMJs with LC3 puncta was significantly higher in SOD1G93A mice than in wild-type mice. Quantifications are from n = three animals & 268–305 NMJs each genotype in confocal images. Asterisks indicate a significant difference by un-paired t-test (**p < 0.01). Image collected & cropped by CiteAb from the following publication (https://pubmed.ncbi.nlm.nih.gov/28890682), licensed under a CC-BY license. Not internally tested by Novus Biologicals.
Immunocytochemistry/ Immunofluorescence: LC3B Antibody - BSA Free [NB100-2220] -
Immunocytochemistry/ Immunofluorescence: LC3B Antibody - BSA Free [NB100-2220] - Autophagy is dynamically regulated by migration-promoting & migration-inhibiting cues & is required for the recycling of paxillin.(A–C:) Immunoblotting for the lipidated form of LC3 (LC3-II), p62, & paxillin on RMS samples dissected from acute sections previously incubated with BDNF, GABA, GM60001, Y27632, or blebbistatin for 2 hr. GAPDH was used as a housekeeping protein. (D–E:) Quantification of LC3-II & paxillin levels after the pharmacological manipulation of cell migration (n = 5–7 mice for both groups, *p<0.05 & **p<0.005 with a Student t-test). (F): Example of a cell infected with a retrovirus expressing the LC3-GFP-RFP fusion protein & immunostained for Lamp1 to label autophagosomes (GFP+/RFP+) & autolysosomes (RFP+/Lamp1+). (G:) Percentage of autophagosomes & autolysosomes after a 2 hr incubation with BDNF, GABA, GM60001, Y27632, or blebbistatin. The autophagosome/autolysosome ratio was assessed for each cell, & the results are expressed as means ± SEM. ***p<0.001 with a one-way ANOVA followed by a post hoc LSD-Fisher test. Image collected & cropped by CiteAb from the following publication (https://pubmed.ncbi.nlm.nih.gov/32985978), licensed under a CC-BY license. Not internally tested by Novus Biologicals.
Immunohistochemistry: LC3B Antibody - BSA Free [NB100-2220] -
Immunohistochemistry: LC3B Antibody - BSA Free [NB100-2220] - OSI induces autophagy through upregulation of MCT1 in CRC cells.a Immunoblotting analysis of MCT1 expression in CRC cells treated with or without 5 μM OSI for 24 h. b Immunoblotting analysis of MCT1 & phosphorylated AMPK in tumor xenografts obtained from vehicle- or OSI-treated mice. (Each protein of interest from each group was electrophoretically transferred onto a PVDF membrane, incubated with indicated primary & secondary antibodies, & developed as a digital image.) c Immunohistochemical analysis of MCT1 expression in tumor xenografts. Scale bar, 50 μm. d Relative intensity of MCT1 staining in (c). e CRC cells were transfected with siScramble or siMCT1 for 24 h, followed by treatment with or without 5 μM OSI for another 24 h. The protein levels of LC3, phosphorylated AMPK, phosphorylated LKB1 & MCT1 were analyzed by immunoblotting. f CRC cells were treated as in (e), the endogenous LC3 puncta were analyzed by immunofluorescence. Scale bar, 10 μm. g The number of LC3 puncta in (f). h CRC cells were transfected with empty vector or Flag-MCT1 plasmid for 48 h, the protein levels of MCT1 & phosphorylated AMPK were analyzed by immunoblotting. i CRC cells were treated as in (h), the endogenous LC3 puncta were analyzed by immunofluorescence. Scale bar, 10 μm. j The number of LC3 puncta in (i). k Immunoblotting analysis of LC3, MCT1 & phosphorylated AMPK levels in CRC cells co-transfected with Flag-MCT1 & DN-AMPK plasmids for 48 h. l CRC cells were treated as in (k), the endogenous LC3 puncta were analyzed by immunofluorescence. Scale bar, 10 μm. m The number of LC3 puncta per cell in (l). Data are presented as mean SEM, Student’s t-test, & are representative of three independent experiments. *P < 0.05; ***P < 0.001 Image collected & cropped by CiteAb from the following publication (https://pubmed.ncbi.nlm.nih.gov/31409796), licensed under a CC-BY license. Not internally tested by Novus Biologicals.
Western Blot: LC3B Antibody - BSA Free [NB100-2220] -
Western Blot: LC3B Antibody - BSA Free [NB100-2220] - Screening of potent NAPIs in HepG2. a Immunoblots for autophagy-related proteins LC3-II, p62 (left); semi-quantified analysis (n = 3) in various nanoparticles treated cells (right). CQ & Rapamycin (Rapa) were used as positive controls for autophagy inhibition & autophagy activation, respectively. Glyceraldehyde 3-phosphate dehydrogenase (GAPDH) was used as the loading control. Normalized band densities were shown below each band. b Fluorescence images of mCherry-GFP-LC3 cells after incubation with CQ or NDs for 48 h (autophagosomes: mCherry+/GFP+ yellow puncta; autolysosomes: mCherry+/GFP) & quantification of the number of LC3 puncta per cell in cells (10 cells per group). Scale bar: 10 μm. c Immunoblots for autophagy-related proteins LC3-II, p62 (left); semi-quantified analysis (n = 3) in CQ, NDs, or CQ–NDs-treated cells (right). &P < 0.05, significantly different from NDs. GAPDH was used as the loading control. Normalized band densities were shown below each band. d Left: Cell viability after incubation with ATO or various NAPIs–ATO mixture for 48 h (n = 3). ##P < 0.01 by t-test, significantly different from ATO. Right: Cell viability after 48 h NDs–ATO treatment with RNAi of autophagy proteins ATG5 & ATG7 (n = 3). e, f Immunoblots for autophagy-related protein LC3-II & autolysosomal process-related protein NUPR1, SNAP25, VAMP8 in NDs-treated cells. g Immunoblots for autolysosomal process-related protein NUPR1 after NDs treatment with RNAi of autophagy proteins ATG5 & ATG7. GAPDH was used as the loading control. Error bars are s.d. Image collected & cropped by CiteAb from the following publication (https://pubmed.ncbi.nlm.nih.gov/30341298), licensed under a CC-BY license. Not internally tested by Novus Biologicals.
Western Blot: LC3B Antibody - BSA Free [NB100-2220] -
Western Blot: LC3B Antibody - BSA Free [NB100-2220] - Glutamine deprivation induces autophagic flux.(a) Autophagosomes were visualized in U2OS cells stably expressing a GFP-LC3 reporter construct. GFP-labelled puncta were examined after 24 h in the presence (+Q) or absence (−Q) of glutamine, with or without co-addition of 100 nM CCI-779 (CCI) & 400 nM BafA1. Scale bar, 10 μm. (b) Graphical summary of experiments performed as described in a. Percentage of cells with >10 puncta per cell from three independent experiments is depicted. Bars represent mean±s.d. from three independent experiments (>50 cells per experiment). The statistical significance (P value) was determined by a two-tailed, paired Student’s t-test. *P<0.05. (c) Immunoblot analysis of U2OS cells subjected to glutamine deprivation with or without 400 nM BafA1. Cells were pretreated with BafA1 for 1 h before & during exposure to glutamine-deficient medium. Autophagic activity was monitored by detection of p62 & LC3-II proteins. (d) U2OS mCherry-GFP-LC3 cells were cultured in the presence (+Q) or absence (−Q) of glutamine for 18 h. Red vesicles denote autolysosomes, whereas yellow vesicles represent autophagosomes. Bars indicate numbers of yellow vesicles (autophagosomes) or red vesicles (autolysosomes) per cell±s.d. (e) Images of U2OS mCherry-GFP-LC3 cells cultured for 18 h in the presence (+Q) or absence (−Q) of glutamine. Scale bar, 10 μm. (f) Phagophore formation in mCherry-ULK1. Scale bar, 10 μm. (g) mCherry-ATG5-expressing U2OS cells after 24 h in the presence (+Q) or absence (−Q) of glutamine. Scale bar, 10 μm. Image collected & cropped by CiteAb from the following publication (https://www.nature.com/articles/ncomms5900), licensed under a CC-BY license. Not internally tested by Novus Biologicals.
Western Blot: LC3B Antibody - BSA Free [NB100-2220] -
Western Blot: LC3B Antibody - BSA Free [NB100-2220] - Glucocorticoids promote BCG survival in macrophages by inhibiting autophagy. (a) RAW264.7 cells were pretreated with dexamethasone (DEX) (1 μM) or vehicle control ethanol (mock) for 6 hr & then challenged with M. bovis BCG (MOI 5) or treated with the vehicle control DMSO or rapamycin (4 μM). LC3 level was detected with Western blot analysis. & GAPDH was used as the loading control. Full-length blots are presented in Supplementary Fig. 12. Data are representative of three independent experiments with similar results. (b,c) RAW264.7 cells were treated as described in (a), & viable bacilli were determined by CFU assays at 6 hpi (b). Survival rate was calculated compared with that of mock-treated cells (c). Data are shown as the mean ± SEM of three independent experiments. *p < 0.05. Image collected & cropped by CiteAb from the following publication (https://www.nature.com/articles/s41598-017-01174-9), licensed under a CC-BY license. Not internally tested by Novus Biologicals.
Western Blot: LC3B Antibody - BSA Free [NB100-2220] -
Western Blot: LC3B Antibody - BSA Free [NB100-2220] - CysC regulates AMPK activity during the induction of autophagy. (a) Immunoblotting analysis of autophagy regulators. N2a cells expressing SOD1 treated with or without CysC (1 μM) for 6 h. The lysates analyzed by immunoblotting using antibodies for phosphorylated AMPK (pAMPK), phosphorylated mTOR (pmTOR), phosphorylated PKC delta (pPKC delta ), Myc & beta -actin. (b) Inactivation of AMPK by mutant SOD1 expression. Each relative pAMPK level normalized by beta -actin in (a) is quantified. *P<0.05, **P<0.01 versus mock. (c) Activation of AMPK by CysC treatment. Relative levels of pAMPK for CysC-treated samples normalized by that of PBS-treated control, which is shown as the broken line, in (a) quantified. *P<0.05 versus PBS-treated controls. (d) CysC induced autophagy through the AMPK activation. N2a cells treated with CysC (1 μM), CC (5 μM) or AICA-riboside (AICAR, 5 mM) for 12 h. The lysates analyzed by immunoblotting using antibodies against pAMPK, LC3 & Tubulin (left panel). Quantification of immunoblots was plotted (right panel). (e) The effect of pAMPK activation on neuroprotection by CysC. N2a cells expressing G85R SOD1 mutant treated with CysC (0.2 μM), CC (5 μM) or AICAR (5 mM). Cell viability was measured by the MTS assay. Data expressed as means±S.E.M. from 3 independent experiments. Each experiment was performed in triplicate. *P<0.01 compared to non-treated control, #P<0.01 compared to CysC-treated one. (f) Immunoblotting analysis of pAMPK in SOD1 transgenic mouse spinal cords. The spinal cord lysates from the transgenic mice at indicated ages analyzed for the levels of pAMPK, SOD1 & beta -actin (upper panel). Expression levels of pAMPK normalized by beta -actin (lower panel). All data expressed as means±S.E.M. from 3 independent experiments Image collected & cropped by CiteAb from the following publication (https://www.nature.com/articles/cddis2014459), licensed under a CC-BY license. Not internally tested by Novus Biologicals.
Immunocytochemistry/ Immunofluorescence: LC3B Antibody - BSA Free [NB100-2220] -
Immunocytochemistry/ Immunofluorescence: LC3B Antibody - BSA Free [NB100-2220] - Vps34 inhibition blocks autophagy initiation & causes accumulation of ubiquitin-positive & p62-positive structures. a Representative confocal images of cortical neurons treated with vehicle, Bafilomycin A1 (BafA1) at 50 nM, VPS34IN1 at 3 µM or cotreated for 3 h. Arrows highlight LC3 & p62 structures. Right panel, bar graphs denote average object intensity, per cell (mean ± SEM, N = 49-60 cells, from three independent experiments). Scale bar, 10 µm. ***p < 0.001 in one-way ANOVA, Holm–Sidak’s multiple comparisons test. b Representative confocal images of cortical neurons treated as in a & immunostained for LAMP-1, LC3, & p62. Airyscan insets highlight position of LC3 & p62 structures relative to LAMP-1-positive membranes. Scale bar, 10 µm. c Representative confocal images of cultured cortical neurons treated with vehicle or VPS34IN1 at 3 µM for 24 h. Arrows highlight p62 & ubiquitin colocalization. Scale bar, 10 µm Image collected & cropped by CiteAb from the following publication (https://www.nature.com/articles/s41467-017-02533-w), licensed under a CC-BY license. Not internally tested by Novus Biologicals.
Immunocytochemistry/ Immunofluorescence: LC3B Antibody - BSA Free [NB100-2220] -
Immunocytochemistry/ Immunofluorescence: LC3B Antibody - BSA Free [NB100-2220] - ORP1L & VAP-A form cholesterol-dependent ER-AV contact sites(a) MelJuSo cells expressing GFP or GFP-tagged ORP1L mutants were fixed & stained for LC3 & Calnexin. Y477 & D478 in the FFAT motif were mutated to alanines (A) in the ORP1L ydaa mutant. Scale bar, 10 μm. Right: co-immunoprecipitation for ORP1L (mutants) with VAP-A. GFP-ORP1L mutants or GFP were isolated from lysates of HEK293T cells co-overexpressing HA-VAPA using GFP-Trap beads. Western blot filters were probed for isolated GFP-tagged proteins, the associated HA-VAP-A & the input HA-VAP-A, as indicated. (b) Cryo-immuno-EM on HeLa cells expressing HA-LC3 & GFP-ORP1L delta ORD, as detected by HA10 nm & GFP15 nm gold antibodies. Insets show ORP1L labelling in the membrane contact site between ER & autophagosome. The membranes of the ER are depicted in the bottom inset. Scale bar, 50 nm. (c) Three-colour super-resolution image of an autophagosomal vesicle labelled by LC3 (green), ORP1L (blue) & the ER protein VAP-A (red). Scale bar, 500 nm (d) MelJuSo cells cultured either in lipid depleted serum or control medium were fixed & stained for LC3 & ER marker Calnexin. Scale bar, 10 μm. Right panel: Manders coefficient for LC3 localization to the ER was calculated on at least 10 cells over three independent experiments. Bars indicate mean+s.d. Student's t-test statistical analysis (****P<0.0001). Image collected & cropped by CiteAb from the following publication (https://pubmed.ncbi.nlm.nih.gov/27283760), licensed under a CC-BY license. Not internally tested by Novus Biologicals.
Immunohistochemistry: LC3B Antibody - BSA Free [NB100-2220] -
Immunohistochemistry: LC3B Antibody - BSA Free [NB100-2220] - OSI induces autophagy through upregulation of MCT1 in CRC cells.a Immunoblotting analysis of MCT1 expression in CRC cells treated with or without 5 μM OSI for 24 h. b Immunoblotting analysis of MCT1 & phosphorylated AMPK in tumor xenografts obtained from vehicle- or OSI-treated mice. (Each protein of interest from each group was electrophoretically transferred onto a PVDF membrane, incubated with indicated primary & secondary antibodies, & developed as a digital image.) c Immunohistochemical analysis of MCT1 expression in tumor xenografts. Scale bar, 50 μm. d Relative intensity of MCT1 staining in (c). e CRC cells were transfected with siScramble or siMCT1 for 24 h, followed by treatment with or without 5 μM OSI for another 24 h. The protein levels of LC3, phosphorylated AMPK, phosphorylated LKB1 & MCT1 were analyzed by immunoblotting. f CRC cells were treated as in (e), the endogenous LC3 puncta were analyzed by immunofluorescence. Scale bar, 10 μm. g The number of LC3 puncta in (f). h CRC cells were transfected with empty vector or Flag-MCT1 plasmid for 48 h, the protein levels of MCT1 & phosphorylated AMPK were analyzed by immunoblotting. i CRC cells were treated as in (h), the endogenous LC3 puncta were analyzed by immunofluorescence. Scale bar, 10 μm. j The number of LC3 puncta in (i). k Immunoblotting analysis of LC3, MCT1 & phosphorylated AMPK levels in CRC cells co-transfected with Flag-MCT1 & DN-AMPK plasmids for 48 h. l CRC cells were treated as in (k), the endogenous LC3 puncta were analyzed by immunofluorescence. Scale bar, 10 μm. m The number of LC3 puncta per cell in (l). Data are presented as mean SEM, Student’s t-test, & are representative of three independent experiments. *P < 0.05; ***P < 0.001 Image collected & cropped by CiteAb from the following publication (https://pubmed.ncbi.nlm.nih.gov/31409796), licensed under a CC-BY license. Not internally tested by Novus Biologicals.
Western Blot: LC3B Antibody - BSA Free [NB100-2220] -
Western Blot: LC3B Antibody - BSA Free [NB100-2220] - Abrogation of autophagy by siRNAs targeting autophagy-related genes in gastric cancer cells induced tumor-intrinsic PD-L1 expression. a Inhibition of autophagy by knockdown of ATG5 in AGS & NCI-n87 gastric cancer cells induced the expression of PD-L1 in the presence & absence of INF-gamma (200 U/mL) as shown by flow cytometry analysis at 48 h post-transfection. b The induction of PD-L1 was confirmed by Western blots at 72 h post-transfection. The knockdown efficacies of ATG5 & ATG7 siRNA were verified. The conversion of LC3B-I to LC3B-II was reduced. Results were averaged & blots were representative of 4 independent experiments. The ratio of PD-L1 MFI minus isotype control was shown as mean ± S.D. relative to Ctrl from 4 independent experiments, *p < 0.05 Image collected & cropped by CiteAb from the following publication (https://pubmed.ncbi.nlm.nih.gov/30925913), licensed under a CC-BY license. Not internally tested by Novus Biologicals.
Western Blot: LC3B Antibody - BSA Free [NB100-2220] -
Western Blot: LC3B Antibody - BSA Free [NB100-2220] - OSI induces autophagy through upregulation of MCT1 in CRC cells.a Immunoblotting analysis of MCT1 expression in CRC cells treated with or without 5 μM OSI for 24 h. b Immunoblotting analysis of MCT1 & phosphorylated AMPK in tumor xenografts obtained from vehicle- or OSI-treated mice. (Each protein of interest from each group was electrophoretically transferred onto a PVDF membrane, incubated with indicated primary & secondary antibodies, & developed as a digital image.) c Immunohistochemical analysis of MCT1 expression in tumor xenografts. Scale bar, 50 μm. d Relative intensity of MCT1 staining in (c). e CRC cells were transfected with siScramble or siMCT1 for 24 h, followed by treatment with or without 5 μM OSI for another 24 h. The protein levels of LC3, phosphorylated AMPK, phosphorylated LKB1 & MCT1 were analyzed by immunoblotting. f CRC cells were treated as in (e), the endogenous LC3 puncta were analyzed by immunofluorescence. Scale bar, 10 μm. g The number of LC3 puncta in (f). h CRC cells were transfected with empty vector or Flag-MCT1 plasmid for 48 h, the protein levels of MCT1 & phosphorylated AMPK were analyzed by immunoblotting. i CRC cells were treated as in (h), the endogenous LC3 puncta were analyzed by immunofluorescence. Scale bar, 10 μm. j The number of LC3 puncta in (i). k Immunoblotting analysis of LC3, MCT1 & phosphorylated AMPK levels in CRC cells co-transfected with Flag-MCT1 & DN-AMPK plasmids for 48 h. l CRC cells were treated as in (k), the endogenous LC3 puncta were analyzed by immunofluorescence. Scale bar, 10 μm. m The number of LC3 puncta per cell in (l). Data are presented as mean SEM, Student’s t-test, & are representative of three independent experiments. *P < 0.05; ***P < 0.001 Image collected & cropped by CiteAb from the following publication (https://pubmed.ncbi.nlm.nih.gov/31409796), licensed under a CC-BY license. Not internally tested by Novus Biologicals.
Immunocytochemistry/ Immunofluorescence: LC3B Antibody - BSA Free [NB100-2220] -
Immunocytochemistry/ Immunofluorescence: LC3B Antibody - BSA Free [NB100-2220] - Screening of potent NAPIs in HepG2. a Immunoblots for autophagy-related proteins LC3-II, p62 (left); semi-quantified analysis (n = 3) in various nanoparticles treated cells (right). CQ & Rapamycin (Rapa) were used as positive controls for autophagy inhibition & autophagy activation, respectively. Glyceraldehyde 3-phosphate dehydrogenase (GAPDH) was used as the loading control. Normalized band densities were shown below each band. b Fluorescence images of mCherry-GFP-LC3 cells after incubation with CQ or NDs for 48 h (autophagosomes: mCherry+/GFP+ yellow puncta; autolysosomes: mCherry+/GFP) & quantification of the number of LC3 puncta per cell in cells (10 cells per group). Scale bar: 10 μm. c Immunoblots for autophagy-related proteins LC3-II, p62 (left); semi-quantified analysis (n = 3) in CQ, NDs, or CQ–NDs-treated cells (right). &P < 0.05, significantly different from NDs. GAPDH was used as the loading control. Normalized band densities were shown below each band. d Left: Cell viability after incubation with ATO or various NAPIs–ATO mixture for 48 h (n = 3). ##P < 0.01 by t-test, significantly different from ATO. Right: Cell viability after 48 h NDs–ATO treatment with RNAi of autophagy proteins ATG5 & ATG7 (n = 3). e, f Immunoblots for autophagy-related protein LC3-II & autolysosomal process-related protein NUPR1, SNAP25, VAMP8 in NDs-treated cells. g Immunoblots for autolysosomal process-related protein NUPR1 after NDs treatment with RNAi of autophagy proteins ATG5 & ATG7. GAPDH was used as the loading control. Error bars are s.d. Image collected & cropped by CiteAb from the following publication (https://pubmed.ncbi.nlm.nih.gov/30341298), licensed under a CC-BY license. Not internally tested by Novus Biologicals.
Western Blot: LC3B Antibody - BSA Free [NB100-2220] -
Western Blot: LC3B Antibody - BSA Free [NB100-2220] - Screening of potent NAPIs in HepG2. a Immunoblots for autophagy-related proteins LC3-II, p62 (left); semi-quantified analysis (n = 3) in various nanoparticles treated cells (right). CQ & Rapamycin (Rapa) were used as positive controls for autophagy inhibition & autophagy activation, respectively. Glyceraldehyde 3-phosphate dehydrogenase (GAPDH) was used as the loading control. Normalized band densities were shown below each band. b Fluorescence images of mCherry-GFP-LC3 cells after incubation with CQ or NDs for 48 h (autophagosomes: mCherry+/GFP+ yellow puncta; autolysosomes: mCherry+/GFP) & quantification of the number of LC3 puncta per cell in cells (10 cells per group). Scale bar: 10 μm. c Immunoblots for autophagy-related proteins LC3-II, p62 (left); semi-quantified analysis (n = 3) in CQ, NDs, or CQ–NDs-treated cells (right). &P < 0.05, significantly different from NDs. GAPDH was used as the loading control. Normalized band densities were shown below each band. d Left: Cell viability after incubation with ATO or various NAPIs–ATO mixture for 48 h (n = 3). ##P < 0.01 by t-test, significantly different from ATO. Right: Cell viability after 48 h NDs–ATO treatment with RNAi of autophagy proteins ATG5 & ATG7 (n = 3). e, f Immunoblots for autophagy-related protein LC3-II & autolysosomal process-related protein NUPR1, SNAP25, VAMP8 in NDs-treated cells. g Immunoblots for autolysosomal process-related protein NUPR1 after NDs treatment with RNAi of autophagy proteins ATG5 & ATG7. GAPDH was used as the loading control. Error bars are s.d. Image collected & cropped by CiteAb from the following publication (https://pubmed.ncbi.nlm.nih.gov/30341298), licensed under a CC-BY license. Not internally tested by Novus Biologicals.
Western Blot: LC3B Antibody - BSA Free [NB100-2220] -
Western Blot: LC3B Antibody - BSA Free [NB100-2220] - OSI induces autophagy in CRC cells in vitro & in vivo.a Immunoblotting analysis of LC3, Atg5, & p62/SQSTM1 expression in CRC cells treated with indicated concentrations of OSI for 24 h. b The formation of endogenous LC3 puncta in cells treated with DMSO or 5 μM OSI for 24 h. c Total number of endogenous LC3 puncta per cell in (b). d, e LC3 expression in xenograft tissues was examined by IHC. Representative images were provided as indicated in (d) & relative intensity of LC3 staining was quantified in (e). f Immunoblotting analysis of LC3 & p62/SQSTM1 expression in tumor xenografts (Each protein of interest from each group was electrophoretically transferred onto a PVDF membrane, incubated with indicated primary & secondary antibodies, & developed as a digital image.) g Relative intensity of LC3 in (f). h Co-immunoprecipitation analysis of the interaction between Beclin 1 & Bcl-2 in CRC cells treated with or without 5 μM OSI for 24 h. i Immunoblotting analysis of LC3 expression in CRC cells treated with or without 5 μM OSI in the presence or absence of 5 mM 3-MA for 24 h. j CRC cells were treated as in (i), the LC3 puncta were analyzed by immunofluorescence. Scale bar, 10 μm. k, l Immunoblotting analysis of LC3 expression in CRC cells transfected with siScramble, siATG5 (k), or siBECN1 (l) for 24 h, followed by treatment with or without 5 μM OSI for another 24 h. m CRC cells were treated as in (k, l). The LC3 puncta were analyzed by immunofluorescence. Scale bar, 10 μm. Data are presented as mean SEM, Student’s t-test, & are representative of 3 independent experiments. **P < 0.01; ***P < 0.001 Image collected & cropped by CiteAb from the following publication (https://pubmed.ncbi.nlm.nih.gov/31409796), licensed under a CC-BY license. Not internally tested by Novus Biologicals.
Immunohistochemistry: LC3B Antibody - BSA Free [NB100-2220] -
Immunohistochemistry: LC3B Antibody - BSA Free [NB100-2220] - OSI induces autophagy in CRC cells in vitro & in vivo.a Immunoblotting analysis of LC3, Atg5, & p62/SQSTM1 expression in CRC cells treated with indicated concentrations of OSI for 24 h. b The formation of endogenous LC3 puncta in cells treated with DMSO or 5 μM OSI for 24 h. c Total number of endogenous LC3 puncta per cell in (b). d, e LC3 expression in xenograft tissues was examined by IHC. Representative images were provided as indicated in (d) & relative intensity of LC3 staining was quantified in (e). f Immunoblotting analysis of LC3 & p62/SQSTM1 expression in tumor xenografts (Each protein of interest from each group was electrophoretically transferred onto a PVDF membrane, incubated with indicated primary & secondary antibodies, & developed as a digital image.) g Relative intensity of LC3 in (f). h Co-immunoprecipitation analysis of the interaction between Beclin 1 & Bcl-2 in CRC cells treated with or without 5 μM OSI for 24 h. i Immunoblotting analysis of LC3 expression in CRC cells treated with or without 5 μM OSI in the presence or absence of 5 mM 3-MA for 24 h. j CRC cells were treated as in (i), the LC3 puncta were analyzed by immunofluorescence. Scale bar, 10 μm. k, l Immunoblotting analysis of LC3 expression in CRC cells transfected with siScramble, siATG5 (k), or siBECN1 (l) for 24 h, followed by treatment with or without 5 μM OSI for another 24 h. m CRC cells were treated as in (k, l). The LC3 puncta were analyzed by immunofluorescence. Scale bar, 10 μm. Data are presented as mean SEM, Student’s t-test, & are representative of 3 independent experiments. **P < 0.01; ***P < 0.001 Image collected & cropped by CiteAb from the following publication (https://pubmed.ncbi.nlm.nih.gov/31409796), licensed under a CC-BY license. Not internally tested by Novus Biologicals.
Western Blot: LC3B Antibody - BSA Free [NB100-2220] -
Western Blot: LC3B Antibody - BSA Free [NB100-2220] - Growth retardation & shortened lifespan of the mice with deletion of an autophagy-essential gene Atg7 in hematopoietic system. (A) Three genotypes for wild-type, heterozygote, & homozygote for Atg 7 deletion in hematopoietic system with representative images of the mice. The images were taken at age of 10 weeks. (B) PCR Genotyping analysis of the offsprings from Atg7f/f mice crossing Vav-iCre mice to screen Atg7f/f;Vav-iCre mice. The sequences for the primers used in PCR are given in the method section, & their PCR amplified bands representing specific genotypes were indicated in the agarose gel electrophoresis films. (C) Examination of Atg7 expression in wild-type & the Atg7-deleted mice. Upper panel, quantitative PCR analysis of Atg7 transcription normalized to Gapdh transcript in different organs; lower panel, western blotting analysis of autophagy-essential protein ATG7 & lipidation of LC3 in different organs. GAPDH used as a loading control. (D) Growth comparison between wild-type & Atg7-deleted mice. Wild-type mice progressively gain weight before age of 60 weeks (left panel), but Atg7-deleted mice cease weight gain at about age of 6 weeks (right panel). (E) Measurement of lifespan of wild-type & Atg7-deleted mice. (F) Immunohistological examination of heart, liver, lung & thymus from 10 weeks old wild-type & Atg7-deleted mice by HE staining. Image collected & cropped by CiteAb from the following publication (https://pubmed.ncbi.nlm.nih.gov/31327762), licensed under a CC-BY license. Not internally tested by Novus Biologicals.
Western Blot: LC3B Antibody - BSA Free [NB100-2220] -
Western Blot: LC3B Antibody - BSA Free [NB100-2220] - Overexpression of wild-type MAGEA6, but not mutant MAGEA6, suppresses autophagy in PDAC cell lines.(A) Immunoblot analysis of autophagy signaling in HPDE-iKRAS cells expressing GFP (Vec) & MAGEA6 variants. (B) Immunofluorescence staining of LC3B puncta in the transduced HPDE-iKRAS cells. Representative photos (left) & statistical analysis (mean ± standard deviation of counted cells, N=~100 per cohort) are shown. *p=0.002; two-tailed unpaired t-test. (C) Immunoblot analysis of autophagy substrate SQSTM1/p62 in the transduced HPDE-iKRAS cells treated with BafA1 for the indicated time points., Immunoblot analysis of (D) autophagy signaling & (E) SQSTM1/p62 accumulation in wild-type MAGEA6 expressing & (F) autophagy signaling in MAGEA6H305fs* expressing HPDE-iKRAS cells under nutrient-deficient conditions. (G) Immunoblot analysis of autophagy signaling in wild-type MAGEA6 expressing cells under prolonged nutrient-deficient conditions.Immunoblot analysis of autophagy signaling of transduced AsPC-1 & MIA PaCa-2.Immunoblot analysis of the accumulation of autophagy substrate SQSTM/p62 in the transduced HPDE-iKRAS cells under BafA1 for the indicated time points.Immunoblot analysis of autophagy activity in transduced HPDE-iKRAS cells under nutrient-depleted conditions as indicated. Image collected & cropped by CiteAb from the following publication (https://pubmed.ncbi.nlm.nih.gov/32270762), licensed under a CC-BY license. Not internally tested by Novus Biologicals.
Western Blot: LC3B Antibody - BSA Free [NB100-2220] -
Western Blot: LC3B Antibody - BSA Free [NB100-2220] - Inhibition of LRRK2 alters the autophagy/lysosomal pathway in H4 neuroglioma cells. A) LC3-II levels increase upon LRRK2-in1 inhibitor treatment (1 μM, overnight treatment; quantification from 3 independent replicates, the plot shows mean & SD, * indicates significance (p < 0.05)). B) Dose dependent increase in LC3-II upon overnight treatment with LRRK2-in1. C) MTT assay showing no alteration of cell viability upon over night treatment with LRRK2-in1 from 1 to 5 μM. A small toxic effect appeared with the higher dose (10 μM). The plot shows mean & SD, * indicates significance (p < 0.05). D) LRRK2 knockdown cells display reduced response to LRRK2-in1. LRRK2 protein levels are decreased in shRNA stable line compared to wild type cells (right panel), & knockdown of LRRK2 reduces response to 1 μM LRRK2-in1 treatment compared to wild type or scrambled shRNA cells (left panel). E) Western blot analysis of H4 cells treated with DMSO & LRRK2-in1 (5 μM, 2.5 hours treatment) in the presence & absence of 40 nM bafilomycin added at the same time as the inhibitor. Quantification of three replicates is shown in the right hand panel, the plot shows mean & SD, * indicates significance (p < 0.05). F) LRRK2-in1 increases LC3-II levels independent of mTORC1 activity. P70S6K & phoshoThr389-P70S6K; S6 & phosphoSer235/236-S6 levels are shown in control, starvation & amino-acid stimulated conditions. LRRK2-in1 (1 μM over night) treatment does not alter phosphorylation of P70S6K & S6 in conditions that show increased levels of LC3-II. G) Neutral red staining. The plot shows mean & SEM. * indicates significance (p < 0.05). Image collected & cropped by CiteAb from the following publication (https://linkinghub.elsevier.com/retrieve/pii/S0167488913002954), licensed under a CC-BY license. Not internally tested by Novus Biologicals.
Immunocytochemistry/ Immunofluorescence: LC3B Antibody - BSA Free [NB100-2220] -
Immunocytochemistry/ Immunofluorescence: LC3B Antibody - BSA Free [NB100-2220] - SQSTM1 recruited ARHGAP5-AS1 for autophagic degradation.a ARHGAP5-AS1 expression in resistant cells after transfecting siNC or SQSTM1 siRNAs was assessed using qRT-PCR. **p < 0.01. b ARHGAP5-AS1 expression in sensitive cells after SQSTM1 overexpression was detected by qRT-PCR. c The interaction of ARHGAP5-AS1 with SQSTM1 in SGC-R cells was analyzed by RIP assay followed with qRT-PCR. IgG was served as the negative control. d RNA pull down assay was performed to verify the binding of SQSTM1 to ARHGAP5-AS1 in SGC7901 or SGC-R cells. beta -actin was served as negative control. NC: no probe. The interaction of ARHGAP5-AS1 with SQSTM1 in SGC-R cells before & after EBSS treatment (4 h) were analyzed using RIP assay (e) & RNA pull down assay (f). g The interaction of various SQSTM1 constructs with ARHGAP5-AS1 were analyzed using RIP assay. h The interaction of various ARHGAP5-AS1 fragments with SQSTM1 was analyzed by RNA pull down assay. i Half-life of ARHGAP5-AS1 in SGC7901 & SGC-R cells with different SQSTM1 expression status were determined by qRT-PCR. The colocalization of ARHGAP5-AS with SQSTM1 (j) & LC3B (k) in SGC-R cells treated as indicated were analyzed by combined FISH & IFC assay (original magnification, ×100). Scale bar: 100 μm (j) & 10 μm (k) Image collected & cropped by CiteAb from the following publication (https://pubmed.ncbi.nlm.nih.gov/31097692), licensed under a CC-BY license. Not internally tested by Novus Biologicals.
Western Blot: LC3B Antibody - BSA Free [NB100-2220] -
Western Blot: LC3B Antibody - BSA Free [NB100-2220] - Effects of autophagy & caspase inhibitors on survival of neurons after glucose reperfusion (GR).After 3 h GD, neuro2a cells were replaced by 20-Methyladenine (3MA); Bafilomycin A1 (BA1) & z-VAD-FMK (z-VAD) were added at final concentrations of 5 mM, 5 nM & 20 uM, respectively. (A) Cell viability was assessed using the MTT assay after treatment of autophagy & pan-caspase inhibitors. MTT mitochondrial reduction was shown as a relative percentage of the MTT values at the indicated time point (3 h GD/48 h GR) from three independent experiments ± SD (*p<0.05, **p<0.001). (B) Changes in protein levels by inhibitors of autophagy or caspase activation were analyzed by immunoblot. Proteins were blotted with anti-LC3, p62, cleaved-caspase 3 & PARP antibodies. Tubulin was used as loading control. (C) Quantification of immunoblot data in (B). The amount of each protein was normalized against the amount of tubulin. Data represent the mean ± SD (*p<0.05, n = 3). (D) Cells transiently expressing GFP-LC3 (green) were treated with 3MA, BA1 or z-VAD for 48 h of GR after 3h GD. Nuclei were stained with DAPI (blue). Scale bar represents 5 µm. Quantification shown on the right graph represents mean GFP-LC3 puncta per cell (n = 10 cells per condition) from three independent experiments ± SD. The asterisks (*) indicate significant differences in the values.*p<0.05, **p<0.001. Image collected & cropped by CiteAb from the following publication (https://dx.plos.org/10.1371/journal.pone.0076466), licensed under a CC-BY license. Not internally tested by Novus Biologicals.
Immunocytochemistry/ Immunofluorescence: LC3B Antibody - BSA Free [NB100-2220] -
Immunocytochemistry/ Immunofluorescence: LC3B Antibody - BSA Free [NB100-2220] - Exposure of microglia to cART resulted in blockade of autophagosome–lysosome fusion. (A) rPMs were seeded into a 12-well plate followed by tandem fluorescent-tagged MAP1LC3B plasmid. Next, cells were exposed to cART (5 µM each of TDF, FTC, & DTG) for an additional 24 h & observed by confocal imaging. The results showed that cART exposure significantly increased the formation of autophagosomes (yellow puncta). (B) Representative bar graph showing the number of autophagosome (yellow puncta) per cell. (C) Representative bar graph showing the number of autolysosome (red puncta) per cell. (D) rPMs were seeded into 12-well plates followed with cART exposure for 24 h. Cells were then double immunostained with MAP1LC3B & LAMP2 antibody & observed by immunofluorescent microscopy. (E,F) Representative bar graphs showing cART-mediated decreased LAMP2 puncta & decreased colocalization of MAP1LC3B & LAMP2. BAF—autophagosome fusion inhibitor, & rapamycin (RAP—autophagy inducer) were used as controls for autophagy flux. Data is from three independent experiments & is expressed as means ± SEM & were analyzed using one-way ANOVA. *, p < 0.05 vs. control. Image collected & cropped by CiteAb from the following publication (https://pubmed.ncbi.nlm.nih.gov/31569373), licensed under a CC-BY license. Not internally tested by Novus Biologicals.
Western Blot: LC3B Antibody - BSA Free [NB100-2220] -
Western Blot: LC3B Antibody - BSA Free [NB100-2220] - The cytoprotection of in vitro sIPC is diminished by autophagy inhibitors in RPTC cells. RPTC cells were subjected to: (1) control; (2) CCCP-R; (3) sIPC + CCCP-R in the absence or presence of chloroquine (20 μM) & 3-methyladenine (10 mM). Both inhibitors were used for 1-h pretreatment & during 2-h recovery from prolonged CCCP treatment. Cells were collected for morphological & immunoblot analyses. (a) Representative images of phase contrast & fluorescence microscopy showing cellular & nuclear morphology of apoptosis. Scale bar: 200 μm. (b) Quantification of cell apoptosis. Data are expressed as mean ± SD. *, P < 0.05, significantly different from the control group; #, P < 0.05, significantly different from CCCP-R group. (c) Analysis of apoptosis inhibitory efficiency by sIPC. Data are expressed as mean ± SD. *, P < 0.05, significantly different from the group without inhibitors. (d & e) Immunoblots of LC3B & cleaved CASP3. ACTB was used as a loading control. The molecular mass marker lanes were labelled as kDa. For densitometric analysis of cleaved CASP3, after normalization with ACTB, the protein signals of the control were arbitrarily set as 1, & the signals of other conditions were normalized to the control to calculate fold changes. Data are expressed as mean ± SD. *, P < 0.05, significantly different from the control group; #, P < 0.05, significantly different from CCCP-R group. Image collected & cropped by CiteAb from the following publication (https://pubmed.ncbi.nlm.nih.gov/31066324), licensed under a CC-BY license. Not internally tested by Novus Biologicals.
Immunocytochemistry/ Immunofluorescence: LC3B Antibody - BSA Free [NB100-2220] -
Immunocytochemistry/ Immunofluorescence: LC3B Antibody - BSA Free [NB100-2220] - ORP1L & VAP-A form cholesterol-dependent ER-AV contact sites(a) MelJuSo cells expressing GFP or GFP-tagged ORP1L mutants were fixed & stained for LC3 & Calnexin. Y477 & D478 in the FFAT motif were mutated to alanines (A) in the ORP1L ydaa mutant. Scale bar, 10 μm. Right: co-immunoprecipitation for ORP1L (mutants) with VAP-A. GFP-ORP1L mutants or GFP were isolated from lysates of HEK293T cells co-overexpressing HA-VAPA using GFP-Trap beads. Western blot filters were probed for isolated GFP-tagged proteins, the associated HA-VAP-A & the input HA-VAP-A, as indicated. (b) Cryo-immuno-EM on HeLa cells expressing HA-LC3 & GFP-ORP1L delta ORD, as detected by HA10 nm & GFP15 nm gold antibodies. Insets show ORP1L labelling in the membrane contact site between ER & autophagosome. The membranes of the ER are depicted in the bottom inset. Scale bar, 50 nm. (c) Three-colour super-resolution image of an autophagosomal vesicle labelled by LC3 (green), ORP1L (blue) & the ER protein VAP-A (red). Scale bar, 500 nm (d) MelJuSo cells cultured either in lipid depleted serum or control medium were fixed & stained for LC3 & ER marker Calnexin. Scale bar, 10 μm. Right panel: Manders coefficient for LC3 localization to the ER was calculated on at least 10 cells over three independent experiments. Bars indicate mean+s.d. Student's t-test statistical analysis (****P<0.0001). Image collected & cropped by CiteAb from the following publication (https://pubmed.ncbi.nlm.nih.gov/27283760), licensed under a CC-BY license. Not internally tested by Novus Biologicals.
Western Blot: LC3B Antibody - BSA Free [NB100-2220] -
Western Blot: LC3B Antibody - BSA Free [NB100-2220] - Inhibition of LRRK2 alters the autophagy/lysosomal pathway in H4 neuroglioma cells. A) LC3-II levels increase upon LRRK2-in1 inhibitor treatment (1 μM, overnight treatment; quantification from 3 independent replicates, the plot shows mean & SD, * indicates significance (p < 0.05)). B) Dose dependent increase in LC3-II upon overnight treatment with LRRK2-in1. C) MTT assay showing no alteration of cell viability upon over night treatment with LRRK2-in1 from 1 to 5 μM. A small toxic effect appeared with the higher dose (10 μM). The plot shows mean & SD, * indicates significance (p < 0.05). D) LRRK2 knockdown cells display reduced response to LRRK2-in1. LRRK2 protein levels are decreased in shRNA stable line compared to wild type cells (right panel), & knockdown of LRRK2 reduces response to 1 μM LRRK2-in1 treatment compared to wild type or scrambled shRNA cells (left panel). E) Western blot analysis of H4 cells treated with DMSO & LRRK2-in1 (5 μM, 2.5 hours treatment) in the presence & absence of 40 nM bafilomycin added at the same time as the inhibitor. Quantification of three replicates is shown in the right hand panel, the plot shows mean & SD, * indicates significance (p < 0.05). F) LRRK2-in1 increases LC3-II levels independent of mTORC1 activity. P70S6K & phoshoThr389-P70S6K; S6 & phosphoSer235/236-S6 levels are shown in control, starvation & amino-acid stimulated conditions. LRRK2-in1 (1 μM over night) treatment does not alter phosphorylation of P70S6K & S6 in conditions that show increased levels of LC3-II. G) Neutral red staining. The plot shows mean & SEM. * indicates significance (p < 0.05). Image collected & cropped by CiteAb from the following publication (https://linkinghub.elsevier.com/retrieve/pii/S0167488913002954), licensed under a CC-BY license. Not internally tested by Novus Biologicals.
Immunocytochemistry/ Immunofluorescence: LC3B Antibody - BSA Free [NB100-2220] -
Immunocytochemistry/ Immunofluorescence: LC3B Antibody - BSA Free [NB100-2220] - TFEB overexpression in macrophages induces the autophagy markers LC3 & p62 & restores their co-localization in atherosclerotic aortic roots.(a,b) Representative immunofluorescence images of atherosclerotic aortic roots (2 months' western diet) from control & mφTFEB-TG mice (ApoE-null background) stained with antibodies against TFEB (a), TFEB & MOMA-2 (b; scale bar, 50 μm). (c) Quantification of the average TFEB intensity & co-localization with nuclear marker DAPI (n=4-5 mice per group). (d) Representative immunofluorescence images of atherosclerotic aortic roots from control & mφTFEB-TG mice stained with p62 & LC3 (scale bar, 50 μm). (e) Quantification of the p62 & LC3 average intensity from control & mφTFEB-TG-stained roots (n=13–14 mice per group). (f) Representative pseudocolour image of these p62/LC3 images (green represents co-localization) & graph depicting the increased p62/LC3 correlation seen in a representative mφTFEB-TG as compared to a control lesion (scale bar, 50 μm). (g) Quantification of the p62/LC3 co-localization from control & mφTFEB-TG-stained roots shown (n=13–14 mice per group). (h,i) FACS analysis of aortic macrophages isolated from atherosclerotic aortas of Control or mφTFEB-TG mice (western diet-fed ApoE-KO background, n=3–4 pooled aortas) & stained for either (h) p62 & LC3, or (i) Lamp2 & LC3 antibodies (per cent of macrophages expressing each marker is shown below plots). For all graphs, data are presented as mean±s.e.m. *P<0.05, ***P<0.001, two-tailed unpaired t-test. Image collected & cropped by CiteAb from the following publication (https://www.nature.com/articles/ncomms15750), licensed under a CC-BY license. Not internally tested by Novus Biologicals.
Immunohistochemistry: LC3B Antibody - BSA Free [NB100-2220] -
Immunohistochemistry: LC3B Antibody - BSA Free [NB100-2220] - Keap1 co-localizes with SQSTM1-immunopositive sarcoplasmic aggregates in AVM muscle. a-c. Only focal & minimal co-localization of LC3 (a) & Keap1 immunofluorescence (b) is seen in a representative toxic AVM sample (colchicine-treated subject #31); merged panel is shown in (c) (LC3, red; Keap1, green). d-f. In the same specimen, there is extensive co-localization of SQSTM1 (d) & Keap1 immunofluorescence (e); merged panel is shown in (f) (SQSTM1, red; Keap1, green). g-i. Similar to toxic AVM specimens, essentially no co-localization of LC3 (g) & Keap1 immunofluorescence (h) is seen in a representative IBM muscle biopsy (subject #46); merged panel is shown in (i) (LC3, red; Keap1, green). j-l. In the same specimen, there is extensive co-localization of SQSTM1 (j) & Keap1 immunofluorescence (k); merged panel is shown in (l) (SQSTM1, red; Keap1, green). Scale bar, 25 μm Image collected & cropped by CiteAb from the following publication (https://actaneurocomms.biomedcentral.com/articles/10.1186/s40478-016-03…), licensed under a CC-BY license. Not internally tested by Novus Biologicals.
Western Blot: LC3B Antibody - BSA Free [NB100-2220] -
Western Blot: LC3B Antibody - BSA Free [NB100-2220] - Glucose deprivation (GD) induces neuronal cell death.Time course of cell viability & cell death after GD was estimated by MTT & LDH assays, respectively. Bars depict rates of MTT reduction (A) & LDH release (B) time dependent manner after GD. MTT data represent relative percentages compared with controls (*p<0.05, **p<0.001, n = 3). LDH release from neuro2a cells was calculated as fold increase from the LDH release in controls (*p<0.01, **p<0.001, n = 3). (C) Levels of LC3 & p62 expression, cleaved-caspase 3 & PARP cleavage were determined at indicated times after GD by immunoblot analysis. Tubulin was used as loading control. (D) Quantitative analyses of the immunoblots are shown in (C). The amount of each protein was normalized against the amount of tubulin. Data represent the mean ± SD for each condition (*p<0.05, **p<0.001, n = 3). Image collected & cropped by CiteAb from the following publication (https://dx.plos.org/10.1371/journal.pone.0076466), licensed under a CC-BY license. Not internally tested by Novus Biologicals.
Immunohistochemistry: LC3B Antibody - BSA Free [NB100-2220] -
Immunohistochemistry: LC3B Antibody - BSA Free [NB100-2220] - OSI induces autophagy through upregulation of MCT1 in CRC cells.a Immunoblotting analysis of MCT1 expression in CRC cells treated with or without 5 μM OSI for 24 h. b Immunoblotting analysis of MCT1 & phosphorylated AMPK in tumor xenografts obtained from vehicle- or OSI-treated mice. (Each protein of interest from each group was electrophoretically transferred onto a PVDF membrane, incubated with indicated primary & secondary antibodies, & developed as a digital image.) c Immunohistochemical analysis of MCT1 expression in tumor xenografts. Scale bar, 50 μm. d Relative intensity of MCT1 staining in (c). e CRC cells were transfected with siScramble or siMCT1 for 24 h, followed by treatment with or without 5 μM OSI for another 24 h. The protein levels of LC3, phosphorylated AMPK, phosphorylated LKB1 & MCT1 were analyzed by immunoblotting. f CRC cells were treated as in (e), the endogenous LC3 puncta were analyzed by immunofluorescence. Scale bar, 10 μm. g The number of LC3 puncta in (f). h CRC cells were transfected with empty vector or Flag-MCT1 plasmid for 48 h, the protein levels of MCT1 & phosphorylated AMPK were analyzed by immunoblotting. i CRC cells were treated as in (h), the endogenous LC3 puncta were analyzed by immunofluorescence. Scale bar, 10 μm. j The number of LC3 puncta in (i). k Immunoblotting analysis of LC3, MCT1 & phosphorylated AMPK levels in CRC cells co-transfected with Flag-MCT1 & DN-AMPK plasmids for 48 h. l CRC cells were treated as in (k), the endogenous LC3 puncta were analyzed by immunofluorescence. Scale bar, 10 μm. m The number of LC3 puncta per cell in (l). Data are presented as mean SEM, Student’s t-test, & are representative of three independent experiments. *P < 0.05; ***P < 0.001 Image collected & cropped by CiteAb from the following publication (https://pubmed.ncbi.nlm.nih.gov/31409796), licensed under a CC-BY license. Not internally tested by Novus Biologicals.
Immunohistochemistry: LC3B Antibody - BSA Free [NB100-2220] -
Immunohistochemistry: LC3B Antibody - BSA Free [NB100-2220] - OSI induces autophagy in CRC cells in vitro & in vivo.a Immunoblotting analysis of LC3, Atg5, & p62/SQSTM1 expression in CRC cells treated with indicated concentrations of OSI for 24 h. b The formation of endogenous LC3 puncta in cells treated with DMSO or 5 μM OSI for 24 h. c Total number of endogenous LC3 puncta per cell in (b). d, e LC3 expression in xenograft tissues was examined by IHC. Representative images were provided as indicated in (d) & relative intensity of LC3 staining was quantified in (e). f Immunoblotting analysis of LC3 & p62/SQSTM1 expression in tumor xenografts (Each protein of interest from each group was electrophoretically transferred onto a PVDF membrane, incubated with indicated primary & secondary antibodies, & developed as a digital image.) g Relative intensity of LC3 in (f). h Co-immunoprecipitation analysis of the interaction between Beclin 1 & Bcl-2 in CRC cells treated with or without 5 μM OSI for 24 h. i Immunoblotting analysis of LC3 expression in CRC cells treated with or without 5 μM OSI in the presence or absence of 5 mM 3-MA for 24 h. j CRC cells were treated as in (i), the LC3 puncta were analyzed by immunofluorescence. Scale bar, 10 μm. k, l Immunoblotting analysis of LC3 expression in CRC cells transfected with siScramble, siATG5 (k), or siBECN1 (l) for 24 h, followed by treatment with or without 5 μM OSI for another 24 h. m CRC cells were treated as in (k, l). The LC3 puncta were analyzed by immunofluorescence. Scale bar, 10 μm. Data are presented as mean SEM, Student’s t-test, & are representative of 3 independent experiments. **P < 0.01; ***P < 0.001 Image collected & cropped by CiteAb from the following publication (https://pubmed.ncbi.nlm.nih.gov/31409796), licensed under a CC-BY license. Not internally tested by Novus Biologicals.
Immunocytochemistry/ Immunofluorescence: LC3B Antibody - BSA Free [NB100-2220] -
Immunocytochemistry/ Immunofluorescence: LC3B Antibody - BSA Free [NB100-2220] - Measurement of dysregulated autophagy by fluorescent microscopyOVCAR3 cells were treated with the indicated drugs for 24 hours & then fixed & immunostained for p62 (red) & LC3 (green), with a DAPI costain (blue). Confocal z-stacks were flattened for image analysis to capture all punctate area. A. Doses were: chloroquine (10 μM), nelfinavir (10 μM), rapamycin (10 nM), dasatinib (50 nM), & all were combined for Necramed. B. Similar immunostaining as in (A) Punctae were quantified for size & number per cell by ImageJ with at least 40 cells per condition. LC3 channel was analyzed for autophagosomes, & the p62 channel for sequestosomes. Doses were same as in (A), but with chloroquine & nelfinavir reduced to 5 μM. *p < 0.05, ***p < 0.001 by t-test. All error bars are s.e.m. C. OVCAR3 cells with a virally integrated mCherry-GFP-LC3 construct were studied by live microscopy, for the number of hours indicated following Necramed (doses as in (A)) or control treatment. Image collected & cropped by CiteAb from the following publication (https://pubmed.ncbi.nlm.nih.gov/26418751), licensed under a CC-BY license. Not internally tested by Novus Biologicals.
Western Blot: LC3B Antibody - BSA Free [NB100-2220] -
Western Blot: LC3B Antibody - BSA Free [NB100-2220] - Rop-DPRL combined with CR inhibits tumor growth. (A) Fluorescent imaging of major organs & tumor. Tumor-bearing mice were injected with cy5-labeled liposome or unlabelled liposome. The tumor & major organs from control or drug-treated mice were excised at 12 h or 24 h. (B) Fluorescent image of tumor sections. Tumor from control or Rop-DPRL treated mice were excised at 12 h. Tumor frozen sections were observed under confocal microscope. Scale bar = 20 µm. (C) Immunofluorescence staining of tumor sections for the autophagosome marker LC3, P62 & LAMP1. (D) Image of representative tumors. (E) Change in tumor volume. (F) Tumor weight. (G) TUNEL staining of tumor sections. Nuclei were stained with Hoechst. Scale bar = 20µm. (H) Body weight changes of mice under different treatments. CR: Calorie restriction. Arrows: Enlarged lysosomes. Data are presented as the mean ± SEM, ** p < 0.01. Image collected & cropped by CiteAb from the following publication (https://pubmed.ncbi.nlm.nih.gov/32308756), licensed under a CC-BY license. Not internally tested by Novus Biologicals.
Western Blot: LC3B Antibody - BSA Free [NB100-2220] -
Western Blot: LC3B Antibody - BSA Free [NB100-2220] - SsD & SsA inhibit autophagy in HeLa cells. a Structures of SsA, SsC, & SsD. b SsD (15 μM) & SsA (30 μM), but not SsC, significantly increased LC3-II yellow puncta formation but did not significantly affect LC3-II red-only puncta in RFP-GFP-LC3-expressing HeLa cells. Scale bar = 10 μm. Quantification of LC3 yellow puncta/red puncta (%) is presented as the mean ± S.E., n = ~80 cells from 3 independent experiments. c Treatment of HeLa cells with SsD for 6 h induced the accumulation of both LC3-II & SQSTM1 in a dose-dependent manner. d SsD (15 μM) induced the accumulation of both LC3-II & SQSTM1 in HeLa cells in a time-dependent manner. e SsA (30 μM) induced the accumulation of both LC3-II & SQSTM1 in HeLa cells in a time-dependent manner. f Treatment with different concentrations of SsC for 6 h failed to induce the accumulation of either LC3-II or SQSTM1 in HeLa cells. g SsD (15 μM) reversibly inhibited autophagy Image collected & cropped by CiteAb from the following publication (https://pubmed.ncbi.nlm.nih.gov/30820356), licensed under a CC-BY license. Not internally tested by Novus Biologicals.
Immunocytochemistry/ Immunofluorescence: LC3B Antibody - BSA Free [NB100-2220] -
Immunocytochemistry/ Immunofluorescence: LC3B Antibody - BSA Free [NB100-2220] - PERK pathway-independent induction of prosurvival autophagy in KG1 LSC-like cells upon G9a inhibition. a, LC3-I/II & p62 expression, analyzed by western blotting, after cell treatment with BIX-01294 (15 μmol/L) in the absence or presence of bafilomycin A1 (BafA1) for 24 h. b, Confocal microscopy images of GFP-LC3-transfected cells after treatment with BIX-01294 (5 μmol/L). c, Apoptotic fractions, measured using flow cytometry, after cell treatment with BIX-01294 (15 μmol/L) in the absence or presence of the autophagy inhibitor 3-MA (5 mmol/L) or BafA1 (2 nmol/L) for 48 h. d, Protein expression, analyzed by western blotting with the indicated antibodies, after treatment of PERK siRNA-transfected & non-transfected cells with BIX-01294 (15 μmol/L) for 48 h. e, Protein expression, analyzed by western blotting with the indicated antibodies, after cell treatment with BIX-01294 (10 μmol/L) in the absence or presence of GSK2606414 (20 μmol/L) for 48 h. f, Protein expression, analyzed by western blotting with the indicated antibodies, after treatment of NRF2 siRNA-transfected & non-transfected cells with BIX-01294 (10 μmol/L) for 48 h. g, Levels of apoptosis, evaluated by flow cytometry, after cell treatment for 48 h with BIX-01294 (10 μmol/L) in the absence or presence of the PERK inhibitor GSK2606414 (10 μmol/L) or the autophagy inhibitor 3-MA (5 mmol/L), or BafA1 (2 nmol/L). h, Levels of apoptosis, evaluated by flow cytometry, after treatment of PERK siRNA- or control siRNA-transfected cells with BIX-01294 (10 μmol/L) in the absence or presence of 3-MA (5 mmol/L) or BafA1 (2 nmol/L) Image collected & cropped by CiteAb from the following publication (https://pubmed.ncbi.nlm.nih.gov/32293500), licensed under a CC-BY license. Not internally tested by Novus Biologicals.
Immunohistochemistry: LC3B Antibody - BSA Free [NB100-2220] -
Immunohistochemistry: LC3B Antibody - BSA Free [NB100-2220] - OSI induces autophagy in CRC cells in vitro & in vivo.a Immunoblotting analysis of LC3, Atg5, & p62/SQSTM1 expression in CRC cells treated with indicated concentrations of OSI for 24 h. b The formation of endogenous LC3 puncta in cells treated with DMSO or 5 μM OSI for 24 h. c Total number of endogenous LC3 puncta per cell in (b). d, e LC3 expression in xenograft tissues was examined by IHC. Representative images were provided as indicated in (d) & relative intensity of LC3 staining was quantified in (e). f Immunoblotting analysis of LC3 & p62/SQSTM1 expression in tumor xenografts (Each protein of interest from each group was electrophoretically transferred onto a PVDF membrane, incubated with indicated primary & secondary antibodies, & developed as a digital image.) g Relative intensity of LC3 in (f). h Co-immunoprecipitation analysis of the interaction between Beclin 1 & Bcl-2 in CRC cells treated with or without 5 μM OSI for 24 h. i Immunoblotting analysis of LC3 expression in CRC cells treated with or without 5 μM OSI in the presence or absence of 5 mM 3-MA for 24 h. j CRC cells were treated as in (i), the LC3 puncta were analyzed by immunofluorescence. Scale bar, 10 μm. k, l Immunoblotting analysis of LC3 expression in CRC cells transfected with siScramble, siATG5 (k), or siBECN1 (l) for 24 h, followed by treatment with or without 5 μM OSI for another 24 h. m CRC cells were treated as in (k, l). The LC3 puncta were analyzed by immunofluorescence. Scale bar, 10 μm. Data are presented as mean SEM, Student’s t-test, & are representative of 3 independent experiments. **P < 0.01; ***P < 0.001 Image collected & cropped by CiteAb from the following publication (https://pubmed.ncbi.nlm.nih.gov/31409796), licensed under a CC-BY license. Not internally tested by Novus Biologicals.
Western Blot: LC3B Antibody - BSA Free [NB100-2220] -
Western Blot: LC3B Antibody - BSA Free [NB100-2220] - Metabolic profiling & biochemical assay. (A) Relative abundance of the substrates in the glycolytic pathway & TCA cycle in ORP compared to OCL by targeted metabolic profiling. When compared with OCL heart, ORP hearts have significantly lower glucose-6-phosphate & fructose-6-phosphate (both are glycolytic metabolites), & significantly higher a-ketoglutarate, fumarate, malate, & citrate (all are TCA cycle metabolites). *P < 0.05 compared with OCL. See Table S6 for numerical data. (B) A schematic diagram summarizing the changes in metabolism by rapamycin in old heart. (C) Western blots of autophagic markers show no significant change of LC3 II/I, p62, or beclin-1 in cardiac aging. However, OCR has significantly lower p62 than that in OCL. #P < 0.05 compared with OCL. (D) Both CR & RP significantly reduce the age-dependent increase in protein carbonyls (nmol mL−1). #P < 0.05 compared with OCL. (E). Both CR & RP significantly reduce the age-dependent increase in protein ubiquitination.*P < 0.05 compared with YCL & #P < 0.05 compared with OCL. n = 3–8. G6P: glucose 6-phosphate; G1P: glucose 1-phosphate; F6P: fructose 6-phosphate; F1P: fructose 1-phosphate; F16BP: fructose 1,6-bisphosphate; F26BP: fructose 2,6-biphosphate; G3P: glyceraldehyde 3-phosphate; DHAP:dihydroxyacetone phosphate; 2(3)-PGA: 2- or 3-phosphoglycerate; & PEP: phosphoenolpyruvate. Isomers of same molecular weight, that is, G6P versus G1P, F6P versus F1P, & F16BP versus F26BP, were not distinguishable by the LC-MS/MS-based metabolic profiling method. Image collected & cropped by CiteAb from the following publication (https://pubmed.ncbi.nlm.nih.gov/24612461), licensed under a CC-BY license. Not internally tested by Novus Biologicals.
Western Blot: LC3B Antibody - BSA Free [NB100-2220] -
Western Blot: LC3B Antibody - BSA Free [NB100-2220] - iNOS level is regulated by autophagy during LPS-stimulated condition. (A) Raw 264.7 cells were treated with LPS (200 ng/mL) for 12 h first, followed by removing the LPS & added CQ (30 µM), SAR (1 µM), Torin (1 µM), Rap (1 µM) for another 12 h. CTRL is blank control group with DMSO treatment. (B) Western blot analysis of iNOS in Raw 264.7 cells under LPS treatment. (C) Western blot analysis of p62 in Raw 264.7 cells under LPS treatment. (D) Raw 264.7 cells were treated LPS (200 ng/mL) for 12 h, then removed LPS added CHX (1 µg/mL) & autophagy related drugs for another 12 h. (E) Level of iNOS in Raw 264.7 cell after CHX treatment. (B–E) Values were analyzed from three individual experiments by GraphPad Prism, each experiment conducted three times. * p < 0.05, ** p < 0.01, *** p < 0.001. Error bars (mean ± SEM). One-way ANOVA with Turkeys as post hoc tests. Image collected & cropped by CiteAb from the following publication (https://pubmed.ncbi.nlm.nih.gov/31618870), licensed under a CC-BY license. Not internally tested by Novus Biologicals.
Immunocytochemistry/ Immunofluorescence: LC3B Antibody - BSA Free [NB100-2220] -
Immunocytochemistry/ Immunofluorescence: LC3B Antibody - BSA Free [NB100-2220] - Autophagic pathway regulates inflammasome activation in blood-derived monocytes stimulated with M. leprae. (A–C) Monocytes were purified from healthy donors’ peripheral blood mononuclear cells by 2-h adherence & stimulated with 10 µg/mL M. leprae (ML) in the presence or absence of autophagy regulators for 18 h. Autophagy was triggered with 200 ng/mL rapamycin (RP), & inhibited with 100 µM chloroquine (CQ, autophagic flux blocker) & 10 µM 3-methyladenine (3-MA). (A) Monocytes stimulated with M. leprae, RP, CQ, & 3-MA were fixed & stained with anti-NLRP3 (red), anti-LC3B (green) antibodies & DAPI (blue). Monocytes stimulated with M. leprae increase the number of LC3-II-decorated autophagosomes (puncta) per cell, which is reforced by RP addition, & reverted by 3-MA. Autophagy blocking with CQ & 3-MA was able to increase NLRP3 specks numbers per cell in relation to the well stimulated with M. leprae & RP. Immunofluorescence images were quantified & bars represent the mean values of the number of LC3 puncta & NLRP3 specks per cell ± SEM (n = 3). *(in relation to NS) or #(indicated by the dashes) p < 0.05. Scale bar: 10 µm. (B) Purified mRNAs from monocyte cultures stimulated with M. leprae, the autophagy blocker 3-MA, & RP, as a control of autophagy activation, were analyzed by RT-qPCR for LC3B & IL1B. Bars represent the mean of the fold change values in relation to the non-stimulated controls of three independent experiments with similar results. (C) The IL-1 beta, IL-6, & TNF levels in the monocyte cultures supernatants were assessed by ELISA. Bars represent the fold change values in relation to the non-stimulated controls ± SEM (n = 3). Image collected & cropped by CiteAb from the following publication (https://pubmed.ncbi.nlm.nih.gov/29915584), licensed under a CC-BY license. Not internally tested by Novus Biologicals.
Immunocytochemistry/ Immunofluorescence: LC3B Antibody - BSA Free [NB100-2220] -
Immunocytochemistry/ Immunofluorescence: LC3B Antibody - BSA Free [NB100-2220] - Melatonin induced LC3 aggregation & conversion. a GFP-LC3 aggregation & conversion in U87MG cells stably expressing an exogenous fusion protein, green fluorescent protein (GFP) & microtubule-associated light chain 3 (LC3) (U87-GFP-LC3), after treatment with DMSO (control), rapamycin (RAP 200 nM), melatonin (MEL 1 mM) or agomelatine (AGO 2 μM) for 24 h (×40); b U87MG cells & c A172 cells treated with DMSO (control), rapamycin (RAP 200 nM), melatonin (MEL 1 mM), agomelatine (AGO 2 μM) & luzindole (LUZ 5 μM/L) for 24 h were fixed & analyzed for endogenous LC3 dots by immunofluorescence using anti-LC3 antibodies (green), DAPI (blue) staining shows the nuclei (×40). d Stable U87-GFP-LC3 cell lines & GFP in vector control. U87MG cells stably expressing an exogenous fusion protein, green fluorescent protein (GFP) & microtubule-associated light chain 3 (LC3) (U87-GFP-LC3) (×40) Image collected & cropped by CiteAb from the following publication (https://pubmed.ncbi.nlm.nih.gov/31870319), licensed under a CC-BY license. Not internally tested by Novus Biologicals.
Immunocytochemistry/ Immunofluorescence: LC3B Antibody - BSA Free [NB100-2220] -
Immunocytochemistry/ Immunofluorescence: LC3B Antibody - BSA Free [NB100-2220] - Autophagy induction by atorvastatin in T24 human bladder cancer cells. (A) Immunocytochemistry for the co-localization of LC3 puncta (green) & Lysotracker (red, demarcation for the lysosome) after atorvastatin treatments (30 μM) for 24 h in T24 cells. Rapamycin treated T24 cells were the positive control of autophagy induction. 4′,6-diamidino-2-phenylindole (DAPI) was used for nucleus staining. Scale bar = 100 μm; (B) High magnification view of immunocytochemistry for the co-localization LC3 puncta (green) & Lysotracker after atorvastatin treatments (30 μM) for 24 h in T24 cells at the single-cell level. Scale bar = 50 μm; (C) Western blot analysis of autophagosome formation markers p62/SQSTM1, LC3-I & LC3-II in untreated (control) & atorvastatin (30 μM) treated T24 cells. Image collected & cropped by CiteAb from the following publication (http://www.mdpi.com/1422-0067/15/5/8106), licensed under a CC-BY license. Not internally tested by Novus Biologicals.
Immunocytochemistry/ Immunofluorescence: LC3B Antibody - BSA Free [NB100-2220] -
Immunocytochemistry/ Immunofluorescence: LC3B Antibody - BSA Free [NB100-2220] - Increased LC3B-positive puncta correlated positively with vascular remodeling during AngII-induced hypertension. (A) Western blot analysis of LC3B-II expression in aortas from sham or AngII-infused mice at different time points after operation. **P < 0.01 vs. the corresponding sham group, Student's t-test. n = 10 mice/group. (B) Representative immunofluorescence staining of LC3B (green) & alpha -SMA (red) in thoracic aorta section. Nuclei were stained with DAPI. Scale bars, 20 µm. (C) Quantification of LC3B puncta. Five random fields (2,500 µm2/filed) were measured in one section. Statistical significance was determined by one-way ANOVA. **P < 0.01 vs. sham, n = 12 sections from six mice per group. (D-G) Structural parameters of mouse aorta from sham & hypertensive mice. WD, wall diameter; LD, lumen diameter; CSA, cross-sectional area. *P < 0.05, **P < 0.01 vs. the corresponding sham group, Student's t-test. n = 10 mice/group. (H) Correlation between changes in LC3B puncta & CSA values. Image collected & cropped by CiteAb from the following publication (https://pubmed.ncbi.nlm.nih.gov/32226533), licensed under a CC-BY license. Not internally tested by Novus Biologicals.
Immunohistochemistry: LC3B Antibody - BSA Free [NB100-2220] -
Immunohistochemistry: LC3B Antibody - BSA Free [NB100-2220] - Representative images of the variation of LC3 staining associated with cavities in SDH activity & mitochondrial COX-1 staining in PAD gastrocnemius muscle sections. First column shows succinate dehydrogenase (SDH) activity (dark fibers are type I, intermediate fibers are type IIa, & light fibers are type IIa/x), second column shows mitochondrial COX-1 protein (green), third column shows LC3 (red) & fourth column shows COX-1 & LC3 merged. Examples of normal fibers with no LC3 staining or COX-1 cavities (rowA), punctate LC3 staining where a COX-1 cavitiy is forming (row B), elevated LC3 staining with low COX-1 staining (rowC), LC3 accumulation in areas lacking COX-1 staining (row D), & LC3 plaque in the center of an SDH/COX1 cavity (COX-1; rowE). Arrows within the same row point to areas of LC3 accumulation in same fiber. Scale bar = 100 µM Image collected & cropped by CiteAb from the following publication (https://pubmed.ncbi.nlm.nih.gov/27687713), licensed under a CC-BY license. Not internally tested by Novus Biologicals.
Immunocytochemistry/ Immunofluorescence: LC3B Antibody - BSA Free [NB100-2220] -
Immunocytochemistry/ Immunofluorescence: LC3B Antibody - BSA Free [NB100-2220] - Vps34 inhibition blocks autophagy initiation & causes accumulation of ubiquitin-positive & p62-positive structures. a Representative confocal images of cortical neurons treated with vehicle, Bafilomycin A1 (BafA1) at 50 nM, VPS34IN1 at 3 µM or cotreated for 3 h. Arrows highlight LC3 & p62 structures. Right panel, bar graphs denote average object intensity, per cell (mean ± SEM, N = 49-60 cells, from three independent experiments). Scale bar, 10 µm. ***p < 0.001 in one-way ANOVA, Holm–Sidak’s multiple comparisons test. b Representative confocal images of cortical neurons treated as in a & immunostained for LAMP-1, LC3, & p62. Airyscan insets highlight position of LC3 & p62 structures relative to LAMP-1-positive membranes. Scale bar, 10 µm. c Representative confocal images of cultured cortical neurons treated with vehicle or VPS34IN1 at 3 µM for 24 h. Arrows highlight p62 & ubiquitin colocalization. Scale bar, 10 µm Image collected & cropped by CiteAb from the following publication (https://www.nature.com/articles/s41467-017-02533-w), licensed under a CC-BY license. Not internally tested by Novus Biologicals.
Western Blot: LC3B Antibody - BSA Free [NB100-2220] -
Western Blot: LC3B Antibody - BSA Free [NB100-2220] - Mechanistic analysis of autophagic inhibition in ATO-treated HepG2. a The viability of HepG2 & NB4 cells after incubation with ATO at various concentrations for 48 h (n = 3; error bars are s.d.). Upper: Confocal images of NB4 or HepG2 cells after being stained with calcein AM. Scale bars: 10 μm. b The viability of HepG2 & NB4 cells after incubation with CQ, ATO, or CQ–ATO mixture for 48 h (n = 3). ##P < 0.01 by t-test, significantly different from ATO. ns not significant. c Immunoblots of autophagy-related proteins LC3-II, p62 (left); semi-quantified analysis (n = 3) in NDs, ATO, or NDs–ATO mixture-treated cells (right). GAPDH was used as the loading control. Normalized band densities were shown below each band. d Cell viability & Caspase-3 activity after incubation with ATO or NDs–ATO mixture for 48 h (n = 3). ##P < 0.01 by t-test, significantly different from ATO. e Immunostaining of LC3 in NDs, ATO, or NDs–ATO mixture-treated cells (left). Scale bar: 20 μm. TEM images of ATO or NDs–ATO mixture-treated cells (right). Scale bars: 1 μm. Typical structures of autophagosomes induced by ATO & autolysosome containing NDs induced by NDs–ATO mixture are indicated with green or blue arrows, respectively (magnification). Vacuoles inside cells are indicated with red arrows (magnification). Scale bars: 500 nm. Error bars are s.d. Image collected & cropped by CiteAb from the following publication (https://pubmed.ncbi.nlm.nih.gov/30341298), licensed under a CC-BY license. Not internally tested by Novus Biologicals.
Immunocytochemistry/ Immunofluorescence: LC3B Antibody - BSA Free [NB100-2220] -
Immunocytochemistry/ Immunofluorescence: LC3B Antibody - BSA Free [NB100-2220] - Rop-DPRL impairs autophagy. (A) Fluorescent images of GFP-LC3-HeLa cells treated with 1.5 mM ropivacaine for 0-24 h, or starvation for 0-24 h, & stained with 75 nM LysoTracker Red. Scale bar = 5 µm. (B) Western blot & (C) statistical results of P62, immature & mature cathepsin D (CathD), LC3I, LC3II, & beta -actin. HeLa cells were treated with ropivacaine or starvation for 0-24 h. (D) Western blot & (E) statistical results of P62, LC3I, LC3II, & beta -actin. HeLa cells were treated with PBS, CQ (50 µM), ropivacaine, or CQ+Rop for 24 h. (F) Fluorescent images of GFP-LC3-HeLa cells treated with empty liposome or Rop-DPRL for 24 h & stained with 75 nM LysoTracker Red. Scale bar = 5 μm. (G,I, K & M) Western blot & (H,J,L & N) statistical results for P62, LC3I, LC3II & beta -actin. Cells were treated with empty liposome, CQ, Rop-DPRL, starvation or indicated combination for 24 h. Data are presented as the mean ± SEM, *p < 0.05, ** p < 0.01, *** p < 0.001, ns = no significant difference, Rop: ropivacaine, starv: starvation. Image collected & cropped by CiteAb from the following publication (https://pubmed.ncbi.nlm.nih.gov/32308756), licensed under a CC-BY license. Not internally tested by Novus Biologicals.
Western Blot: LC3B Antibody - BSA Free [NB100-2220] -
Western Blot: LC3B Antibody - BSA Free [NB100-2220] - PERK pathway-independent induction of prosurvival autophagy in KG1 LSC-like cells upon G9a inhibition. a, LC3-I/II & p62 expression, analyzed by western blotting, after cell treatment with BIX-01294 (15 μmol/L) in the absence or presence of bafilomycin A1 (BafA1) for 24 h. b, Confocal microscopy images of GFP-LC3-transfected cells after treatment with BIX-01294 (5 μmol/L). c, Apoptotic fractions, measured using flow cytometry, after cell treatment with BIX-01294 (15 μmol/L) in the absence or presence of the autophagy inhibitor 3-MA (5 mmol/L) or BafA1 (2 nmol/L) for 48 h. d, Protein expression, analyzed by western blotting with the indicated antibodies, after treatment of PERK siRNA-transfected & non-transfected cells with BIX-01294 (15 μmol/L) for 48 h. e, Protein expression, analyzed by western blotting with the indicated antibodies, after cell treatment with BIX-01294 (10 μmol/L) in the absence or presence of GSK2606414 (20 μmol/L) for 48 h. f, Protein expression, analyzed by western blotting with the indicated antibodies, after treatment of NRF2 siRNA-transfected & non-transfected cells with BIX-01294 (10 μmol/L) for 48 h. g, Levels of apoptosis, evaluated by flow cytometry, after cell treatment for 48 h with BIX-01294 (10 μmol/L) in the absence or presence of the PERK inhibitor GSK2606414 (10 μmol/L) or the autophagy inhibitor 3-MA (5 mmol/L), or BafA1 (2 nmol/L). h, Levels of apoptosis, evaluated by flow cytometry, after treatment of PERK siRNA- or control siRNA-transfected cells with BIX-01294 (10 μmol/L) in the absence or presence of 3-MA (5 mmol/L) or BafA1 (2 nmol/L) Image collected & cropped by CiteAb from the following publication (https://pubmed.ncbi.nlm.nih.gov/32293500), licensed under a CC-BY license. Not internally tested by Novus Biologicals.
Western Blot: LC3B Antibody - BSA Free [NB100-2220] -
Western Blot: LC3B Antibody - BSA Free [NB100-2220] - TLR4 mediates Hsp70/Hsp90-induced catabolic response in myotubes. a Hsp70 & Hsp90-induced catabolic response in myotubes is dependent on TLR4. C2C12 myoblasts were transfected with siRNA as indicated. After differentiation, myotubes were treated with rHsp70 & rHsp90 & analyzed for catabolic response as described above. b LLC-released EVs induce muscle catabolism in C2C12 myotubes through TLR4. C2C12 myotubes with either TLR2 or TLR4 knockdown were treated with EVs isolated from LCM (AchE 6 mU) & analyzed for catabolic response. c CD9-positive EVs activate TLR4 in reporter cells. EVs isolated from LCM were subjected to immunoprecipitation (IP) using an antibody against CD9 with pre-immune IgG as control. Resulting pellet & supernatant were used to treat TLR4 reporter cell line HEK-Blue hTLR4 for 24 h, & compared with original EVs. TLR4 activation was measured as SEAP activity. Data (n = 3) were analyzed by analysis of variance. * denotes a difference (P < 0.05) Image collected & cropped by CiteAb from the following publication (https://www.nature.com/articles/s41467-017-00726-x), licensed under a CC-BY license. Not internally tested by Novus Biologicals.
Immunocytochemistry/ Immunofluorescence: LC3B Antibody - BSA Free [NB100-2220] -
Immunocytochemistry/ Immunofluorescence: LC3B Antibody - BSA Free [NB100-2220] - cIAP2 & XIAP regulate autophagosome fusion, but not cIAP1.a MEFs expressing mCherry-GFP-LC3b were transfected with siRNA against either cIAP1, cIAP2 or XIAP. Cells were analysed with the microscope & the number of mCherry+, & GFP + puncta/cell were calculated & the ratio of GFP + /mCherry + puncta is indicated. Shown are the means & the error bars represent the SEM of at least three independent experiments. Westerns show efficient knockdown of cIAP1 & XIAP expression. cIAP2 siRNA efficiency was determined by real time PCR as shown in the graph below the westerns. b Wild type & cIAP2−/− XIAP−/− dermal fibroblasts expressing mCherry-GFP-LC3b were treated analysed on the microscope & mCherry+, & GFP + puncta/cell were calculated. The ratio of GFP+/mCherry + puncta is indicated. c Wild type & cIAP2−/− XIAP−/− dermal fibroblasts were left in complete media (CM) or starved for 2 h in EBSS. Cells were lysed & proteins analysed by western blot for XIAP, LC3, & Actin. cIAP2−/− was confirmed by PCR due to lack of effective antibodies for mouse cIAP2 (see supplemental Fig. 2). d Immunofluoresence showing accumulation of LC3 in starved cIAP2−/− XIAP−/− dermal fibroblasts. Wild type & cIAP2−/− XIAP−/− dermal fibroblasts were incubated in complete media or starved in EBSS for 2 h, then fixed & stained for LC3 (green channel) & LAMP2 (red channel). Nuclei are stained blue with Hoechst. Shown in upper panels are overviews. Lower panels show zoomed in regions indicated in the upper panels Image collected & cropped by CiteAb from the following publication (https://pubmed.ncbi.nlm.nih.gov/29743550), licensed under a CC-BY license. Not internally tested by Novus Biologicals.
Western Blot: LC3B Antibody - BSA Free [NB100-2220] -
Western Blot: LC3B Antibody - BSA Free [NB100-2220] - Enhanced mTORC2 signaling is sufficient to protect MSC from calcification. Flag-tagged rictor or green fluorescent protein (GFP) as a control were introduced into MSC by lentiviral transfer. Cells were cultured for 21 days under control conditions, with osteoblast induction medium (OM) & vehicle, or OM & 20 nM Rapa as indicated. (A) Western blot analyses of rictor & flag confirming overexpression of rictor due to gene transfer, downstream targets of the two mTOR complexes (mTORC1: pp70-S6KSer389; mTORC2: pAKTSer473), inhibition of autophagy (LC3B II, p62), cellular senescence (p16INK4a), & apoptosis-related proteins (Bcl-2: negative regulator of apoptosis; cleaved caspase 3 (cl casp 3): executioner caspase). Representative western blots from six independent experiments are shown. For densitometric quantification, band intensities were normalized to GAPDH as a loading control. Control (no OM) was set to 1. (B) Lactate dehydrogenase (LDH) activity in cell culture supernatants normalized to total protein concentrations was determined to quantify cell death. Control was set to 1. (C) Alkaline phosphatase (ALP) activity normalized to total protein concentrations was measured after 7 days of incubation. (D) Calcium deposition was quantified with the ortho-cresolphthalein method & normalized to total protein concentrations. Bars represent mean + SEM, *P < 0.05, **P < 0.01, ***P < 0.001. Numbers of independent experiments are indicated at the bottom of each graph. (E) Alizarin red S staining of calcium deposits. Representative experiment out of six, phase contrast microscopy, original magnification x200, scale bar = 100 µm. Image collected & cropped by CiteAb from the following publication (https://pubmed.ncbi.nlm.nih.gov/31882658), licensed under a CC-BY license. Not internally tested by Novus Biologicals.
Immunocytochemistry/ Immunofluorescence: LC3B Antibody - BSA Free [NB100-2220] -
Immunocytochemistry/ Immunofluorescence: LC3B Antibody - BSA Free [NB100-2220] - Autophagy induction by atorvastatin in T24 human bladder cancer cells. (A) Immunocytochemistry for the co-localization of LC3 puncta (green) & Lysotracker (red, demarcation for the lysosome) after atorvastatin treatments (30 μM) for 24 h in T24 cells. Rapamycin treated T24 cells were the positive control of autophagy induction. 4′,6-diamidino-2-phenylindole (DAPI) was used for nucleus staining. Scale bar = 100 μm; (B) High magnification view of immunocytochemistry for the co-localization LC3 puncta (green) & Lysotracker after atorvastatin treatments (30 μM) for 24 h in T24 cells at the single-cell level. Scale bar = 50 μm; (C) Western blot analysis of autophagosome formation markers p62/SQSTM1, LC3-I & LC3-II in untreated (control) & atorvastatin (30 μM) treated T24 cells. Image collected & cropped by CiteAb from the following publication (http://www.mdpi.com/1422-0067/15/5/8106), licensed under a CC-BY license. Not internally tested by Novus Biologicals.
Western Blot: LC3B Antibody - BSA Free [NB100-2220] -
Western Blot: LC3B Antibody - BSA Free [NB100-2220] - OSI induces autophagy by activating LKB1/AMPK signaling in CRC cells.a Immunoblotting analysis of AMPK, phosphorylated AMPK (Thr172) & LC3 levels in CRC cells treated with indicated concentration of OSI for 24 h. b Immunohistochemistry analysis of AMPK phosphorylation levels in xenograft tissues. Scale bar, 50 μm. c Relative intensity of phosphorylated AMPK staining in (b). d CRC cells were transfected with siScramble or siAMPK for 24 h & followed by treatment with or without 5 μM for another 24 h. LC3 & phosphorylated AMPK (Thr172) levels were detected by immunoblotting. e CRC cells were transfected with empty vector or DN-AMPK plasmid for 24 h, followed by treatment with or without 5 μM OSI for another 24 h. LC3 & AMPK phosphorylation levels were determined by immunoblotting. f CRC cells were treated as in (d), the endogenous LC3 puncta in CRC cells were assessed by immunofluorescence. Scale bar, 10 μm. g The number of LC3 puncta per cell in (f). h CRC cells were treated as in (e), the endogenous LC3 puncta in CRC cells were assessed by immunofluorescence, Scale bar, 10 μm. i The number of LC3 puncta per cell in (h). j Immunoblotting analysis of phosphorylated LKB1 & phosphorylated CaMKK beta levels in CRC cells treated with or without 5 μM OSI. Data are presented as mean SEM, Student’s t-test, & are representative of three independent experiments. ***P < 0.001 Image collected & cropped by CiteAb from the following publication (https://pubmed.ncbi.nlm.nih.gov/31409796), licensed under a CC-BY license. Not internally tested by Novus Biologicals.
Western Blot: LC3B Antibody - BSA Free [NB100-2220] -
Western Blot: LC3B Antibody - BSA Free [NB100-2220] - Cathepsin inhibitors promote neuronal survival after glucose reperfusion (GR).After 3 h GD, neuro2a cells were replaced by 20; pepstatin A (PA, 10 uM), leupeptin (Leu, 10 uM) or both (PA+Leu). (A) Cell viability was assessed using the MTT assay. MTT mitochondrial reduction was shown as a relative percentage of the MTT values at the indicated time point (3 h GD/48 h GR) from three independent experiments ± SD (*p<0.05, **p<0.001). (B) Changes of protein level by cathepsin inhibitors were analyzed by immunoblot analysis. Proteins from cell lysates were fractionated on SDS-PAGE; blots were probed with anti-LC3, anti-p62, anti-cleaved caspase-3, & anti-PARP antibodies. Tubulin was used as loading control. (C) The graphs represent relative band density of each protein shown in (B). The amount of each protein was normalized against the amount of tubulin. Data represent the mean ± SD (*p<0.05, n = 3). Image collected & cropped by CiteAb from the following publication (https://dx.plos.org/10.1371/journal.pone.0076466), licensed under a CC-BY license. Not internally tested by Novus Biologicals.Applications for LC3B Antibody - BSA Free
Application
Recommended Usage
Immunocytochemistry/ Immunofluorescence
1:200
Immunohistochemistry
1:200 - 1:400
Immunohistochemistry-Paraffin
1:200 - 1:400
Immunoprecipitation
20 ug/500 ug of protein
Simple Western
1:50
Western Blot
0.5 - 2.0 ug/mL
Application Notes
Use in SDS-PAGE reported in scientific literature (PMID:34315875).
Reviewed Applications
Read 51 reviews rated 4.6 using NB100-2220 in the following applications:
- Immunocytochemistry (2 Reviews)
- Immunocytochemistry/Immunofluorescence (1 Review)
- Immunofluorescence (1 Review)
- Immunohistochemistry (1 Review)
- Immunohistochemistry-Frozen (1 Review)
- Immunohistochemistry-Paraffin (1 Review)
- Immunoprecipitation (1 Review)
- Simple Western (3 Reviews)
- Western Blot (40 Reviews)
Flow Cytometry Panel Builder
Bio-Techne Knows Flow Cytometry
Save time and reduce costly mistakes by quickly finding compatible reagents using the Panel Builder Tool.
Advanced Features
- Spectra Viewer - Custom analysis of spectra from multiple fluorochromes
- Spillover Popups - Visualize the spectra of individual fluorochromes
- Antigen Density Selector - Match fluorochrome brightness with antigen density

Formulation, Preparation, and Storage
Purification
Immunogen affinity purified
Formulation
PBS
Format
BSA Free
Preservative
0.02% Sodium Azide
Concentration
1.0 mg/ml
Shipping
The product is shipped with polar packs. Upon receipt, store it immediately at the temperature recommended below.
Stability & Storage
Store at -20C.
Background: LC3B
Autophagic flux is supported by autophagy-related proteins (Atgs) initially identified in yeast (6,7). The core autophagy machinery is comprised of 17 Atg proteins that play specific roles in autophagosome formation. Among these Atg proteins, Atg8 is not only involved in autophagosome formation but also functions in cargo selection. In mammals, several Atg8 homologues have been identified including microtubule-associated protein 1 light chain 3 alpha, beta and gamma - LC3A, LC3B, and LC3C (8) respectively, as well as GABA type A receptor-associated protein (GABARAP), GABARAP-Like1, and GABARAP-Like2 (9). LC3 (predicted molecular weight 14kD) is ubiquitously expressed and undergoes posttranslational processing after synthesis. First, the cysteine protease Atg4 cleaves a carboxy terminal sequence to generate the cytosolic form LC3-I. Next, E1-like (Atg7) and E2-like (Atg3) enzymes conjugate phosphatidylethanolamine to the newly exposed carboxyterminal glycine, generating LC3-II. Finally, the Atg12-Atg5-Atg16L1 complex participates in LC3 lipidation and autophagosome formation (10). LC3B-I to LC3B-II conversion correlates with autophagosome number and is considered the best marker to monitor autophagy.
References
1. Yu, L., Chen, Y., & Tooze, S. A. (2018). Autophagy pathway: Cellular and molecular mechanisms. Autophagy. https://doi.org/10.1080/15548627.2017.1378838
2. Forrester, A., De Leonibus, C., Grumati, P., Fasana, E., Piemontese, M., Staiano, L.,... Settembre, C. (2019). A selective ER -phagy exerts procollagen quality control via a Calnexin- FAM 134B complex. The EMBO Journal. https://doi.org/10.15252/embj.201899847
3. He, X., Zhu, Y., Zhang, Y., Geng, Y., Gong, J., Geng, J.,... Zhong, H. (2019). RNF34 functions in immunity and selective mitophagy by targeting MAVS for autophagic degradation. The EMBO Journal. https://doi.org/10.15252/embj.2018100978
4. Mathai, B., Meijer, A., & Simonsen, A. (2017). Studying Autophagy in Zebrafish. Cells. https://doi.org/10.3390/cells6030021
5. Losier, T. T., Akuma, M., McKee-Muir, O. C., LeBlond, N. D., Suk, Y., Alsaadi, R. M.,... Russell, R. C. (2019). AMPK Promotes Xenophagy through Priming of Autophagic Kinases upon Detection of Bacterial Outer Membrane Vesicles. Cell Reports. https://doi.org/10.1016/j.celrep.2019.01.062
6. Nakatogawa, H., Suzuki, K., Kamada, Y., & Ohsumi, Y. (2009). Dynamics and diversity in autophagy mechanisms: Lessons from yeast. Nature Reviews Molecular Cell Biology. https://doi.org/10.1038/nrm2708
7. Tsukada, M., & Ohsumi, Y. (1993). Isolation and characterization of autophagy-defective mutants of Saccharomyces cerevisiae. FEBS Letters. https://doi.org/10.1016/0014-5793(93)80398-E
8. Wild, P., McEwan, D. G., & Dikic, I. (2014). The LC3 interactome at a glance. Journal of Cell Science. https://doi.org/10.1242/jcs.140426
9. Igloi, G. L. (2001). Cloning, expression patterns, and chromosome localization of three human and two mouse homologues of GABAA receptor-associated protein. Genomics. https://doi.org/10.1006/geno.2001.6555
10. Glick, D., Barth, S., & Macleod, K. F. (2010). Autophagy: Cellular and molecular mechanisms. Journal of Pathology. https://doi.org/10.1002/path.2697
Long Name
Microtubule-associated Protein 1 Light Chain 3 beta
Alternate Names
Apg8b, ATG8F, LC3II, MAP1LC3B, anti-LC3B, atg8f antibody, LC3B ihc, LC3B immunohistochemistry, LC3B immunoprecipitation, LC3B western blot
Gene Symbol
MAP1LC3B
Additional LC3B Products
Product Documents for LC3B Antibody - BSA Free
Certificate of Analysis
To download a Certificate of Analysis, please enter a lot or batch number in the search box below.
Product Specific Notices for LC3B Antibody - BSA Free
This product is for research use only and is not approved for use in humans or in clinical diagnosis. Primary Antibodies are guaranteed for 1 year from date of receipt.
Related Research Areas
Citations for LC3B Antibody - BSA Free
 Powered by Bioz
Customer Reviews for LC3B Antibody - BSA Free (51)
4.6 out of 5
51 Customer Ratings
Have you used LC3B Antibody - BSA Free?
Submit a review and receive an Amazon gift card!
$25/€18/£15/$25CAN/¥2500 Yen for a review with an image
$10/€7/£6/$10CAN/¥1110 Yen for a review without an image
Submit a review
Customer Images
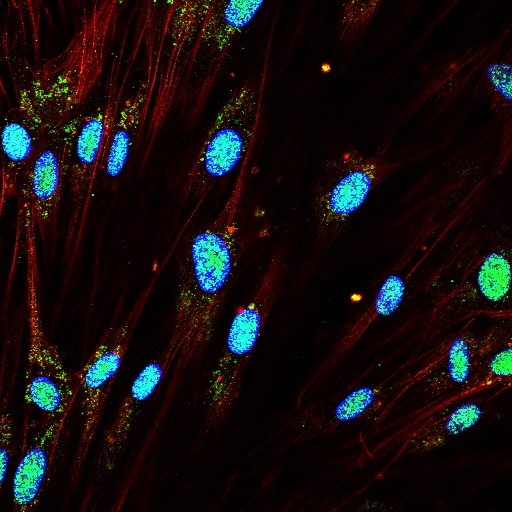
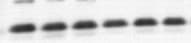

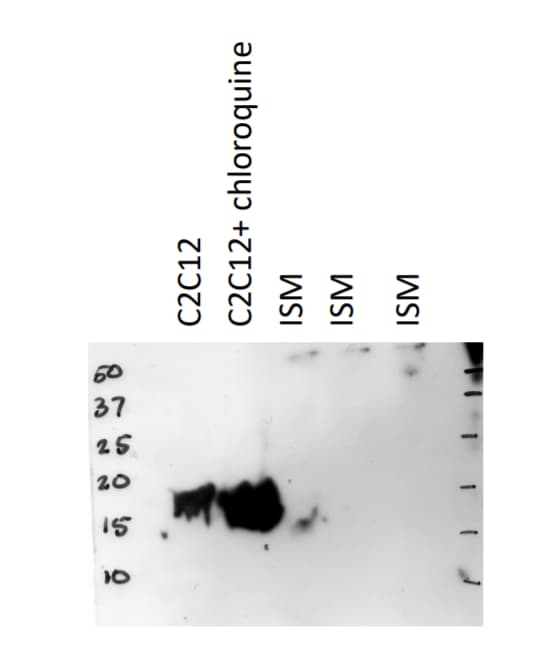
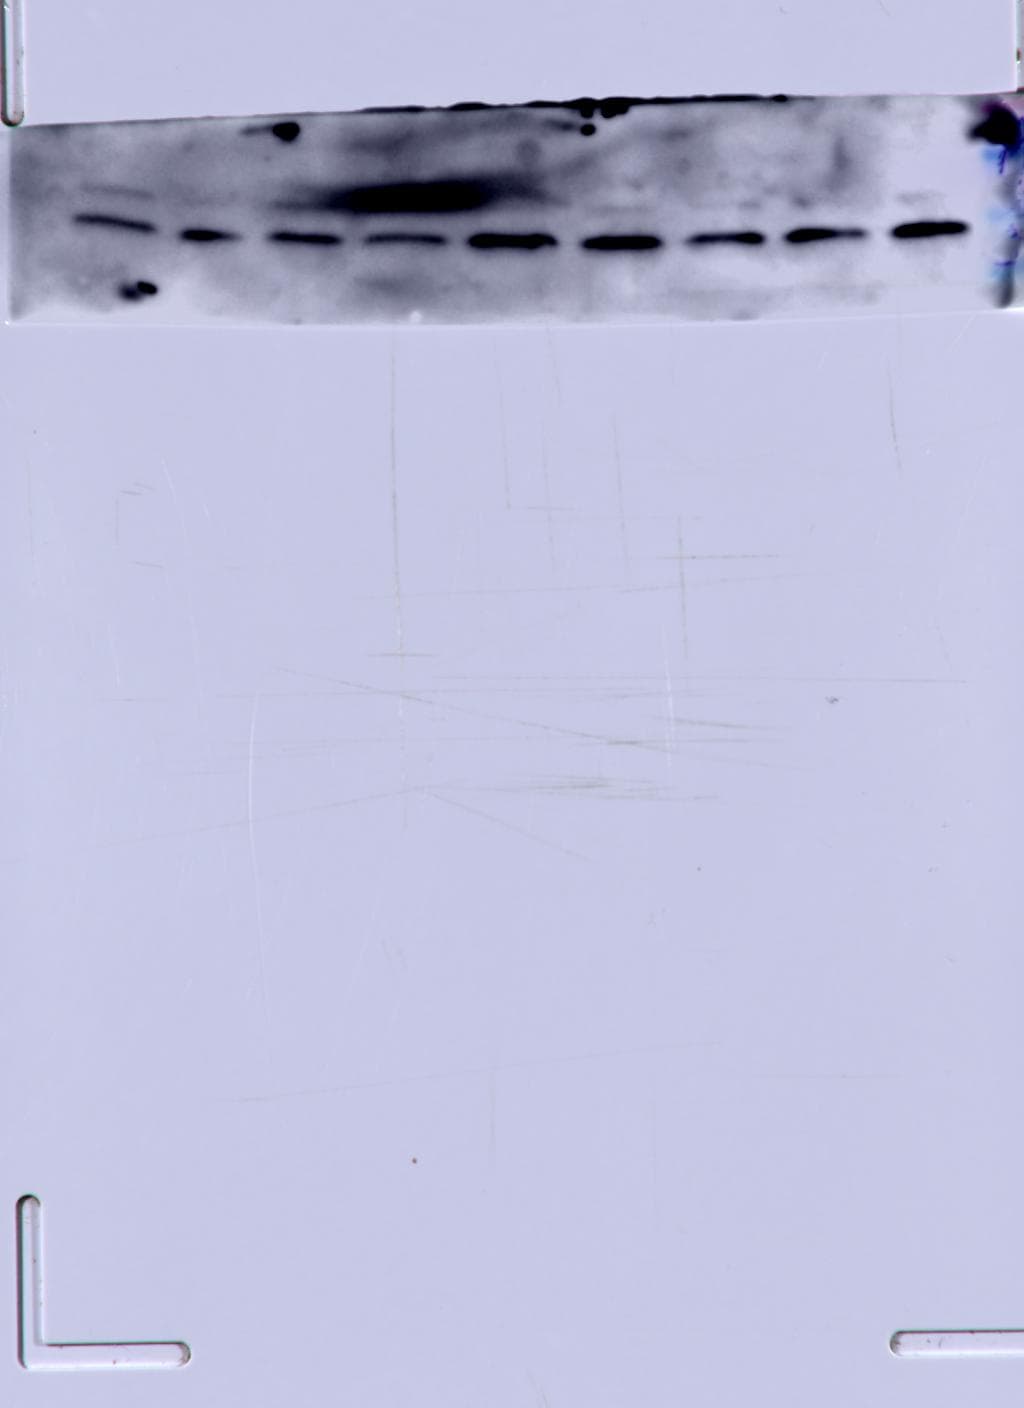
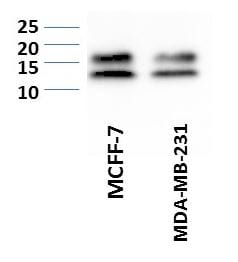

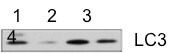
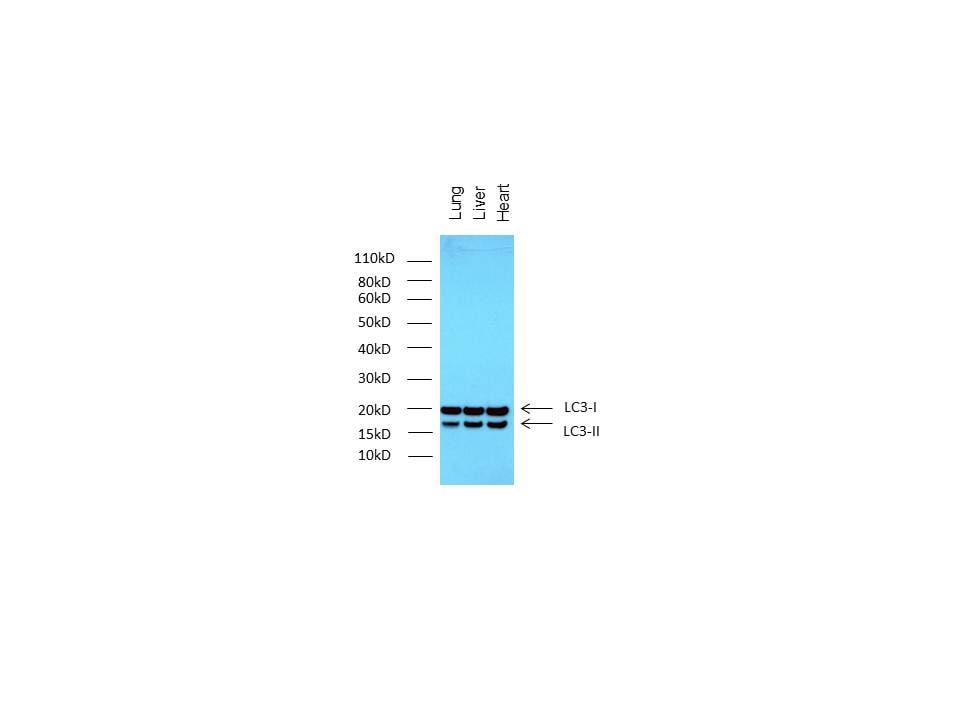
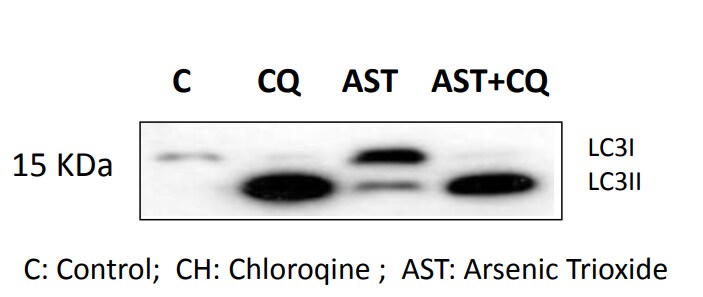
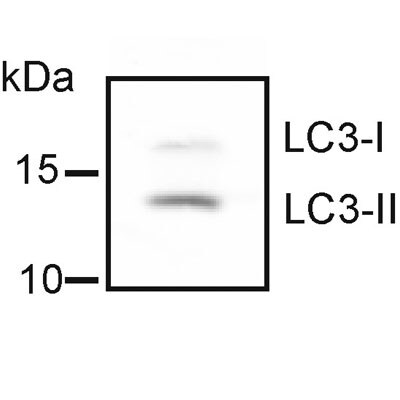
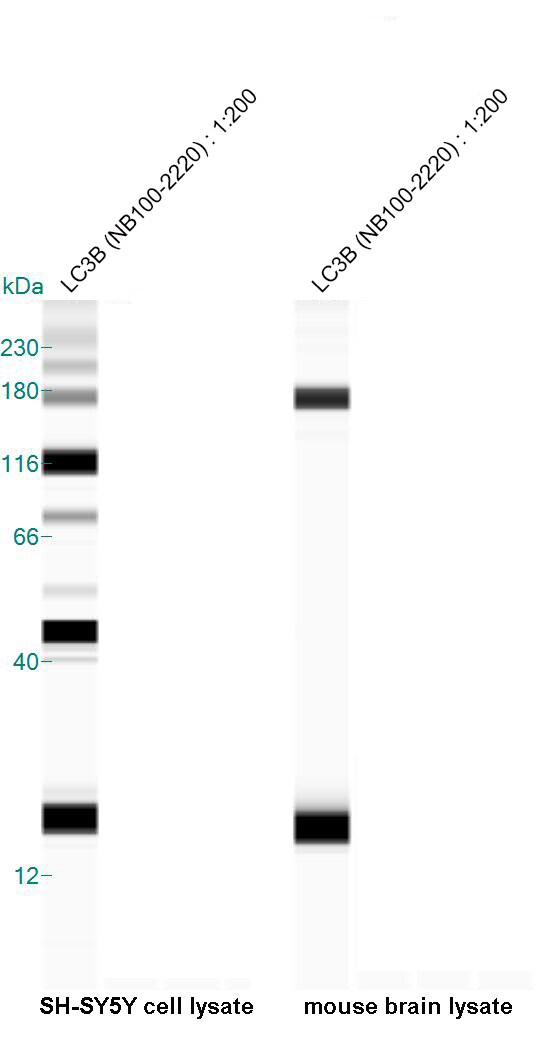
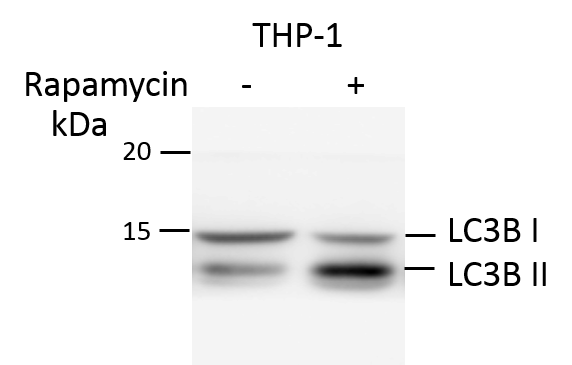
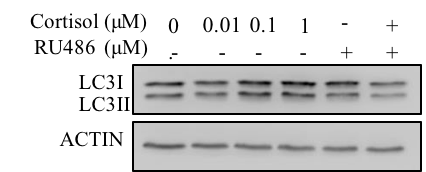
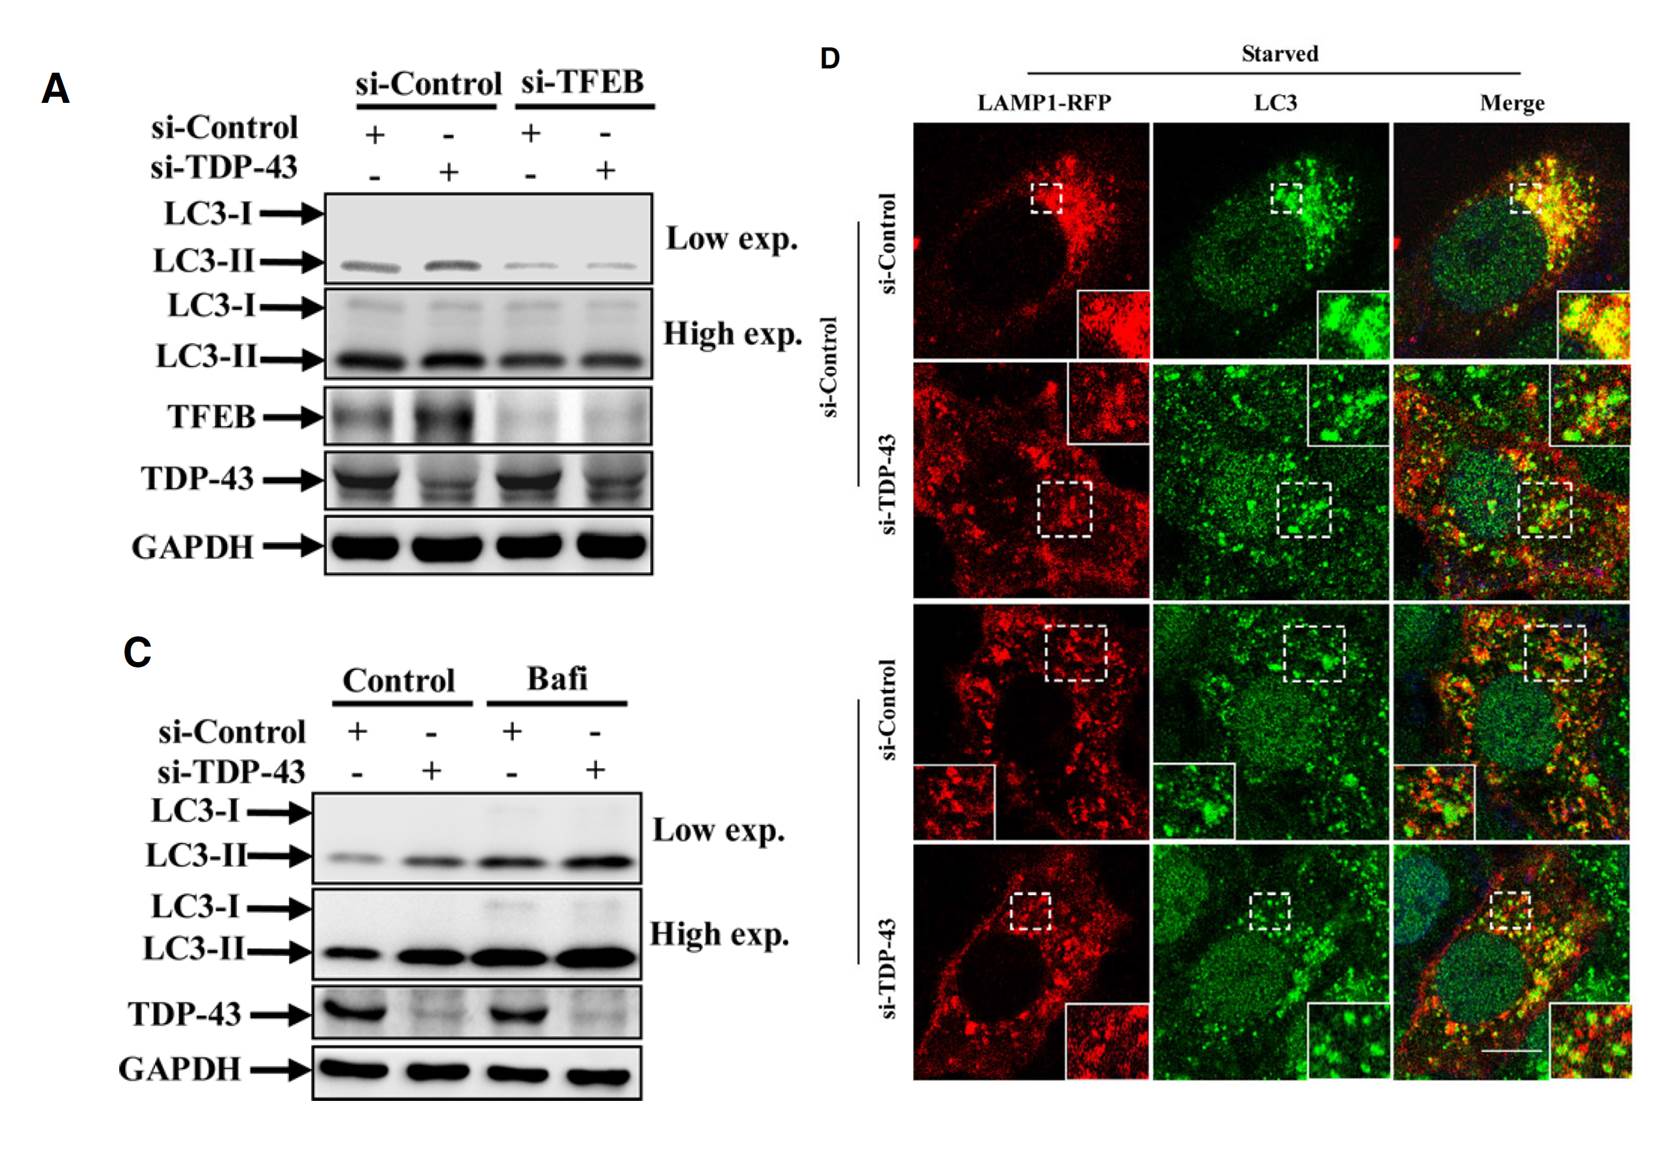
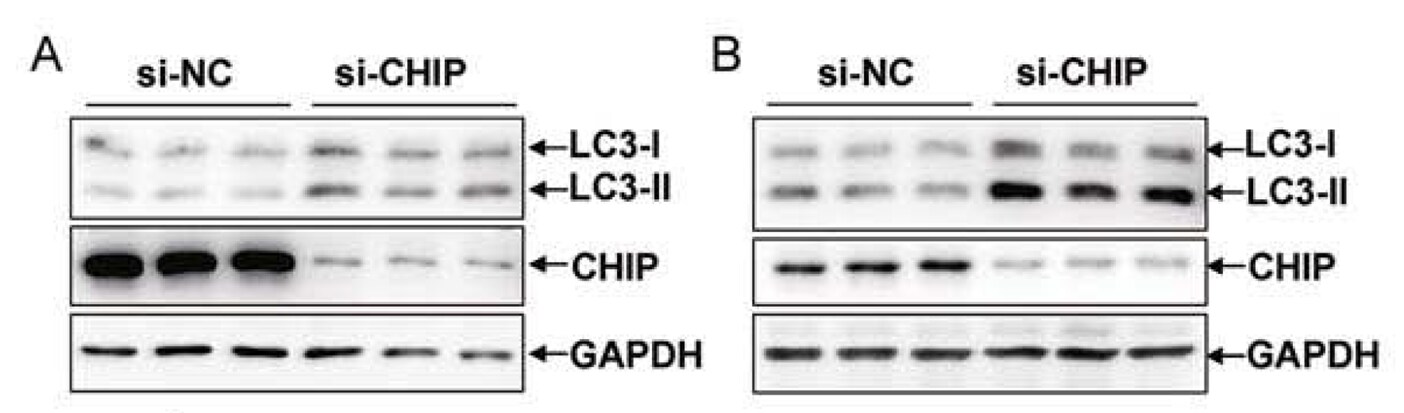

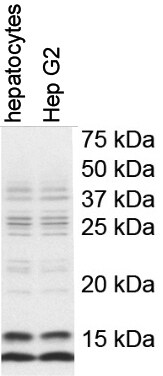
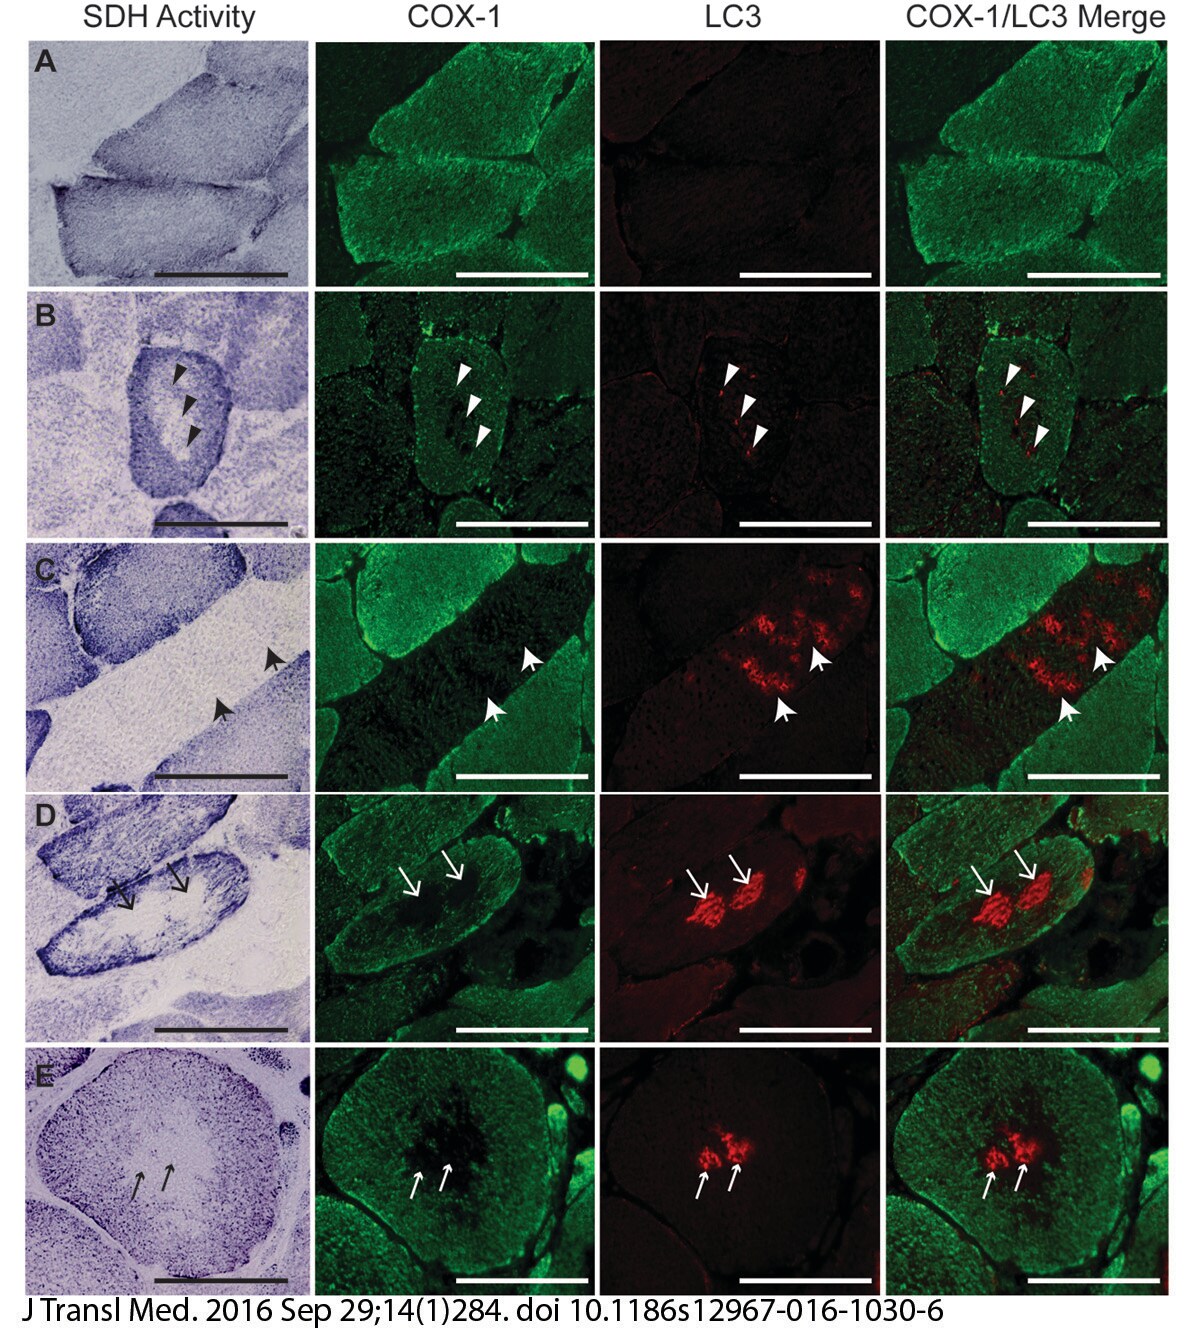
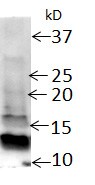
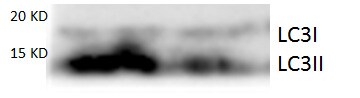

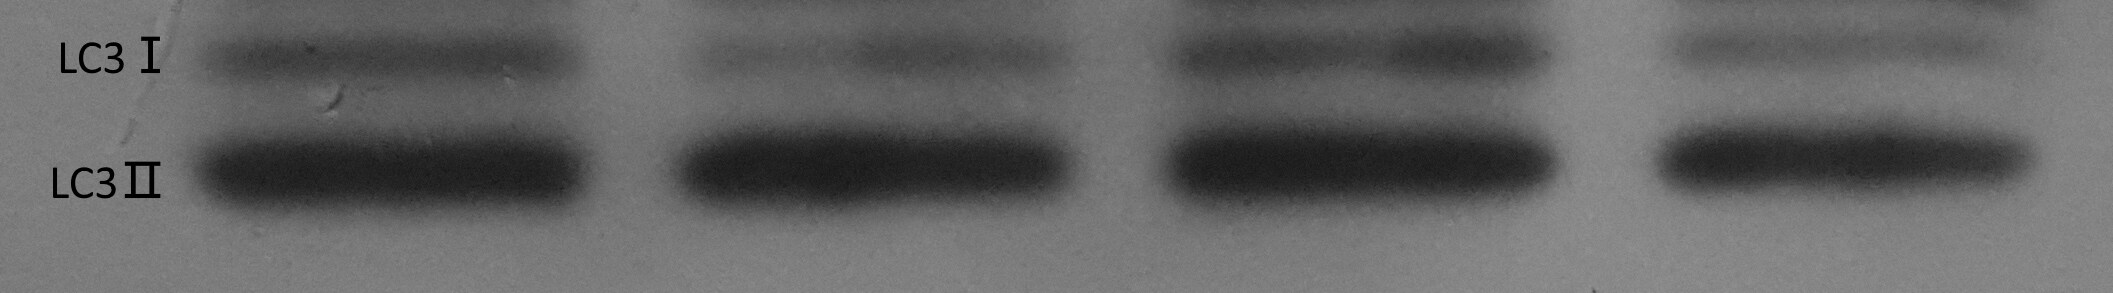
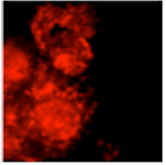


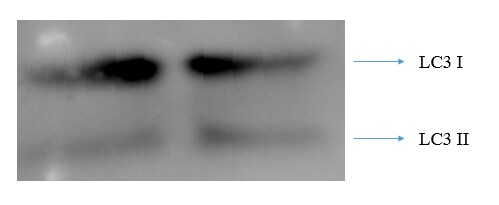
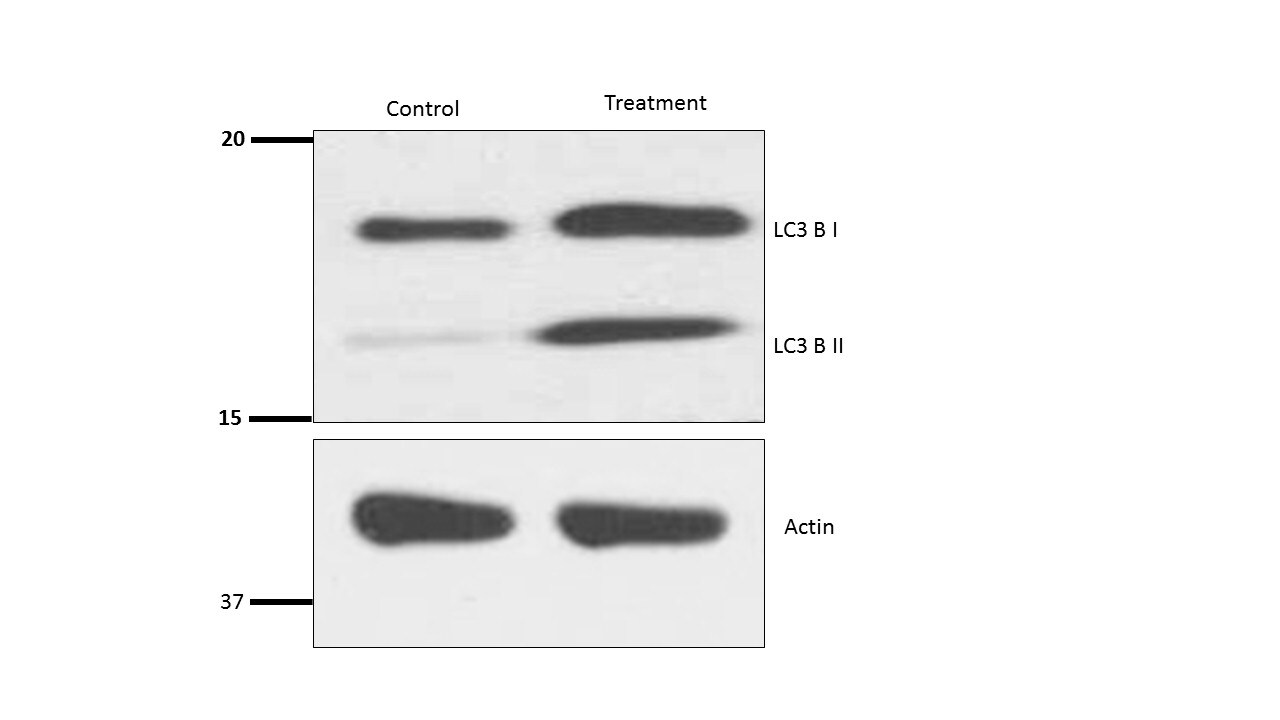
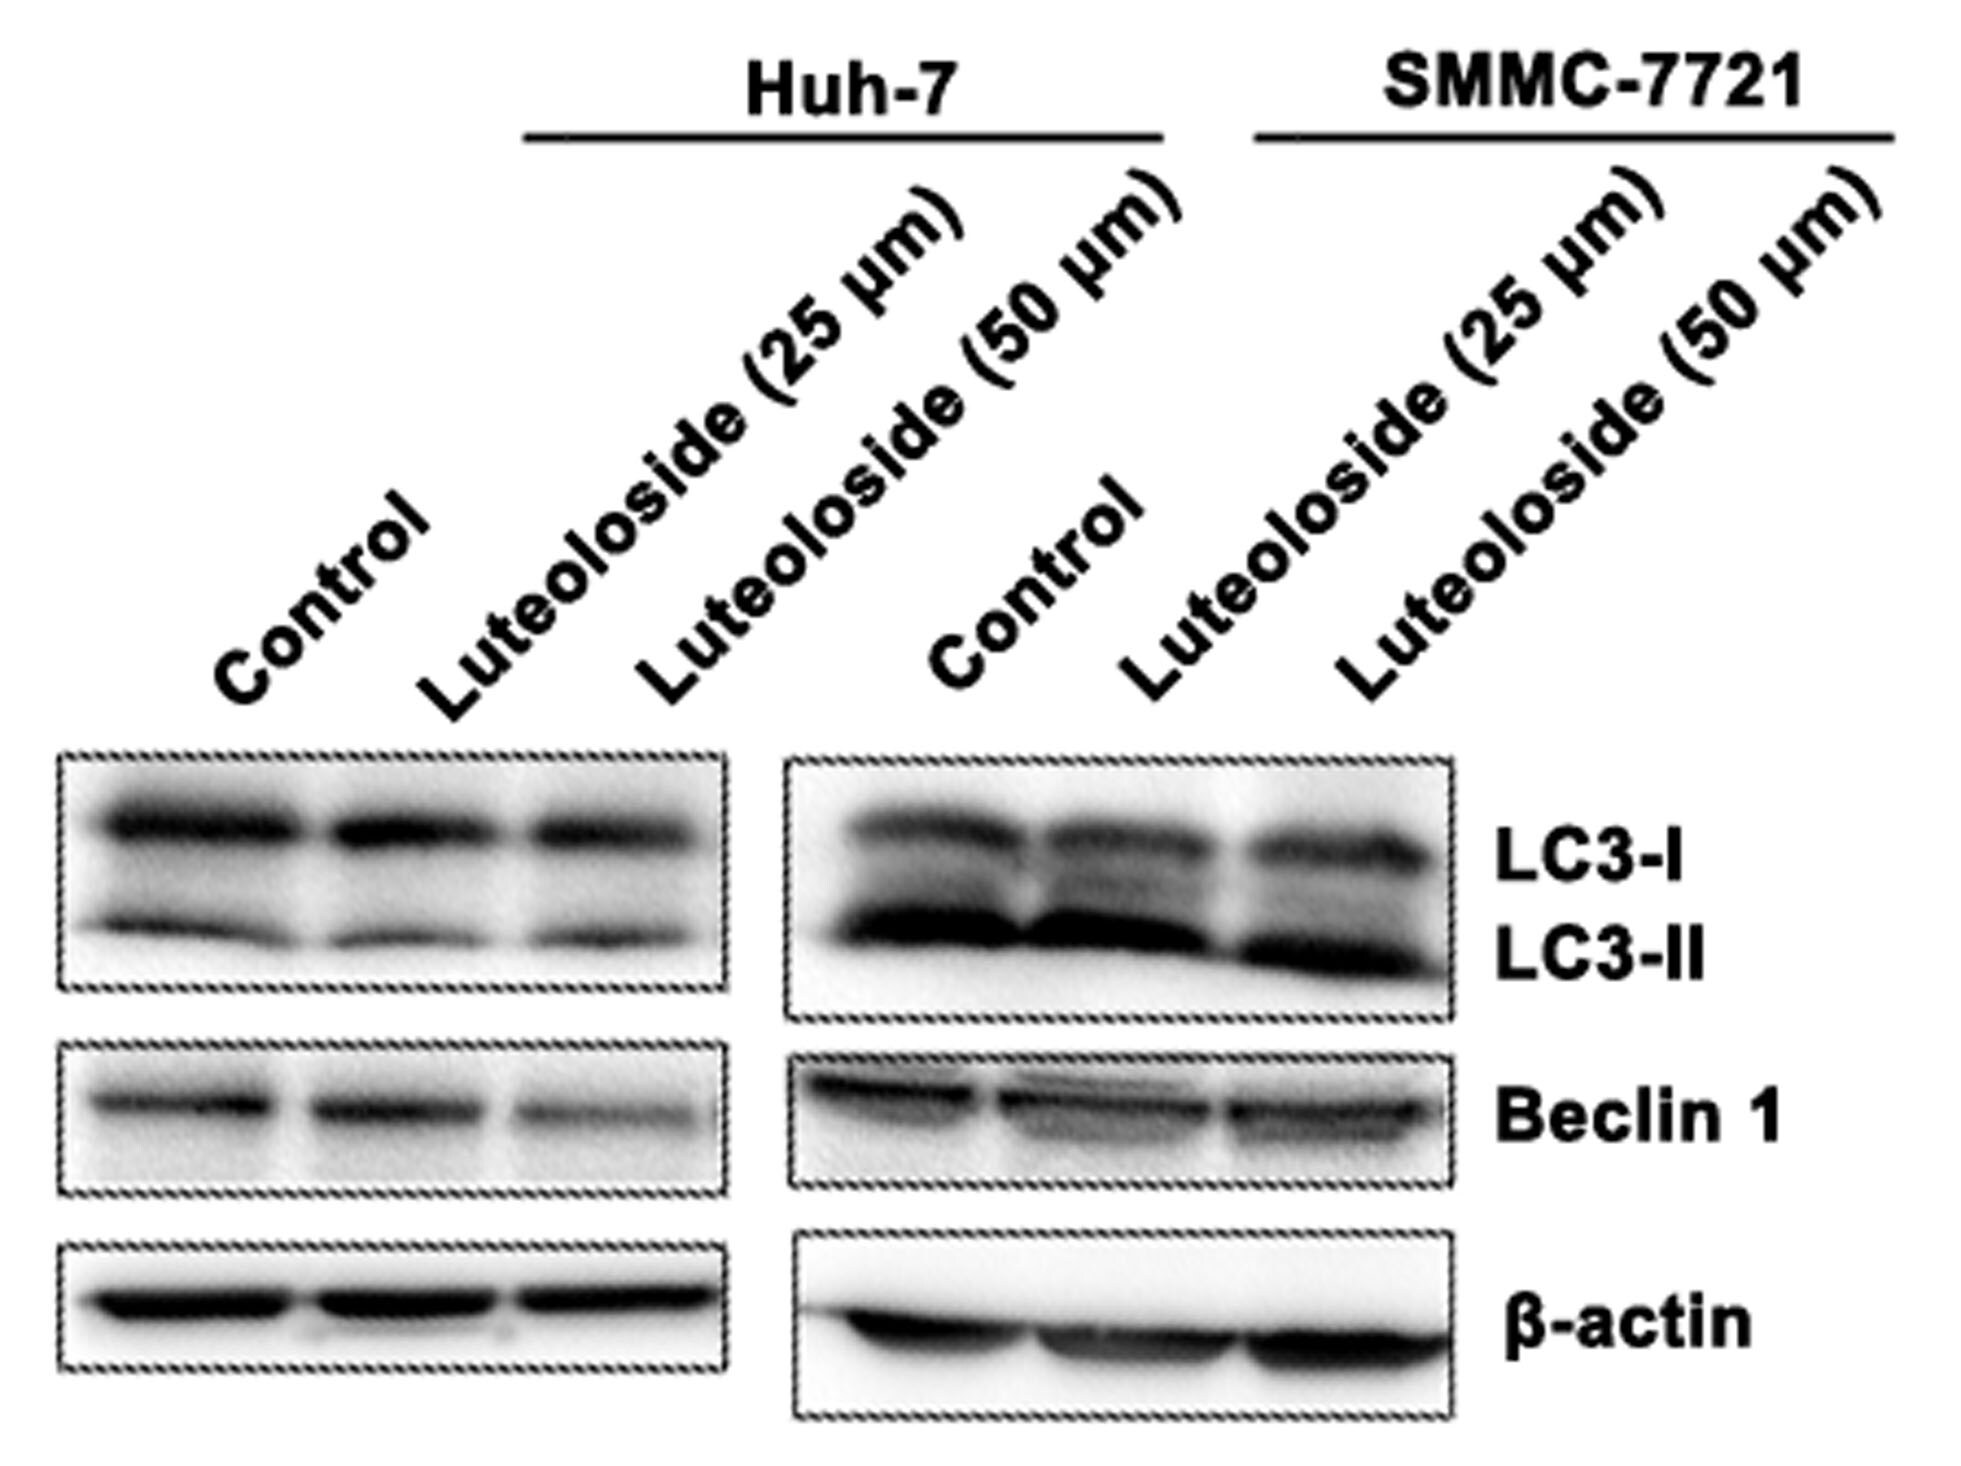
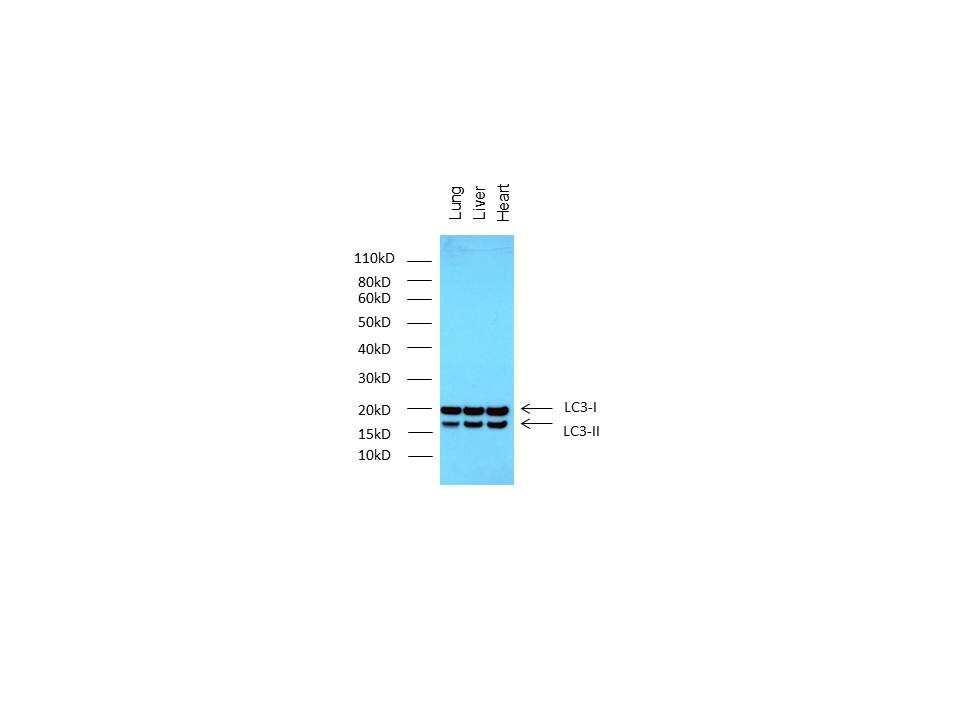
-(01-ml)_NB100-2220_8451.jpg)
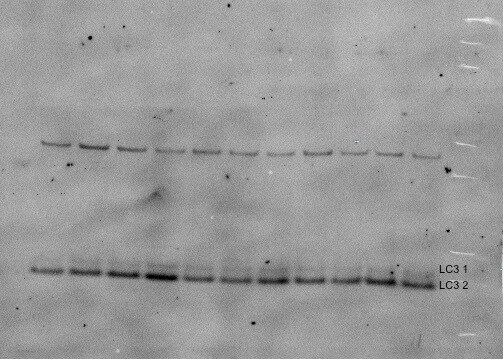
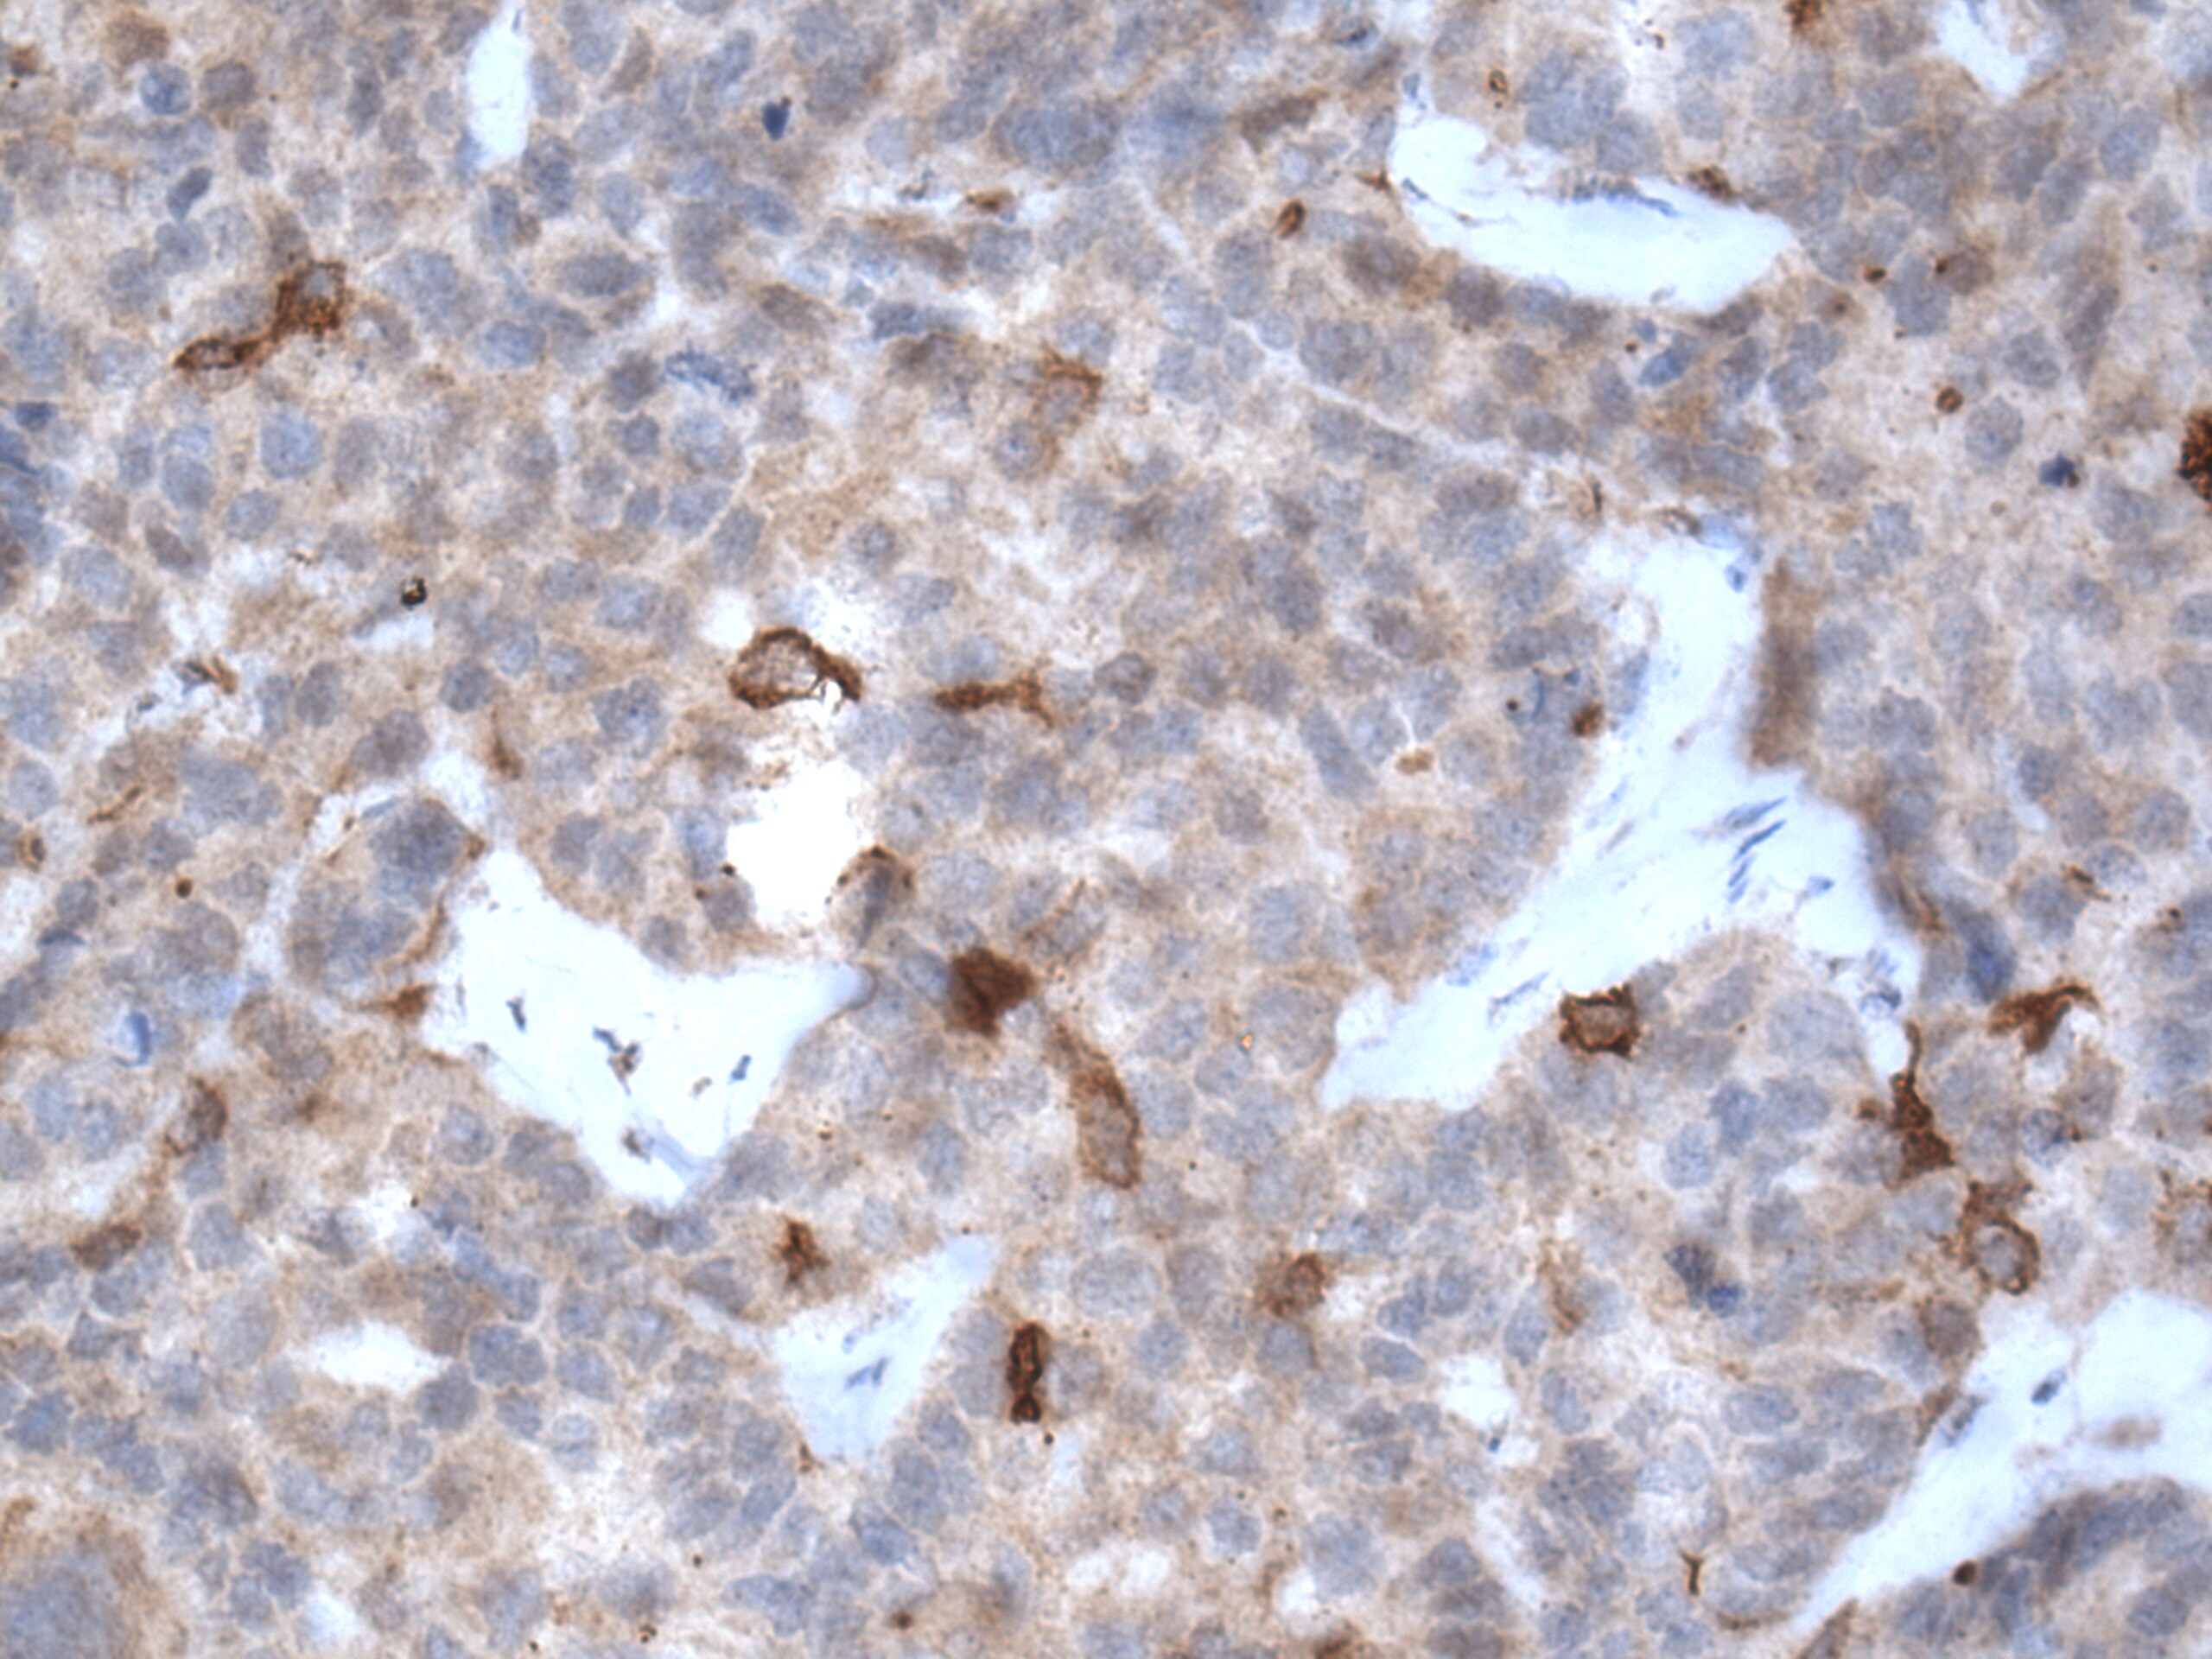
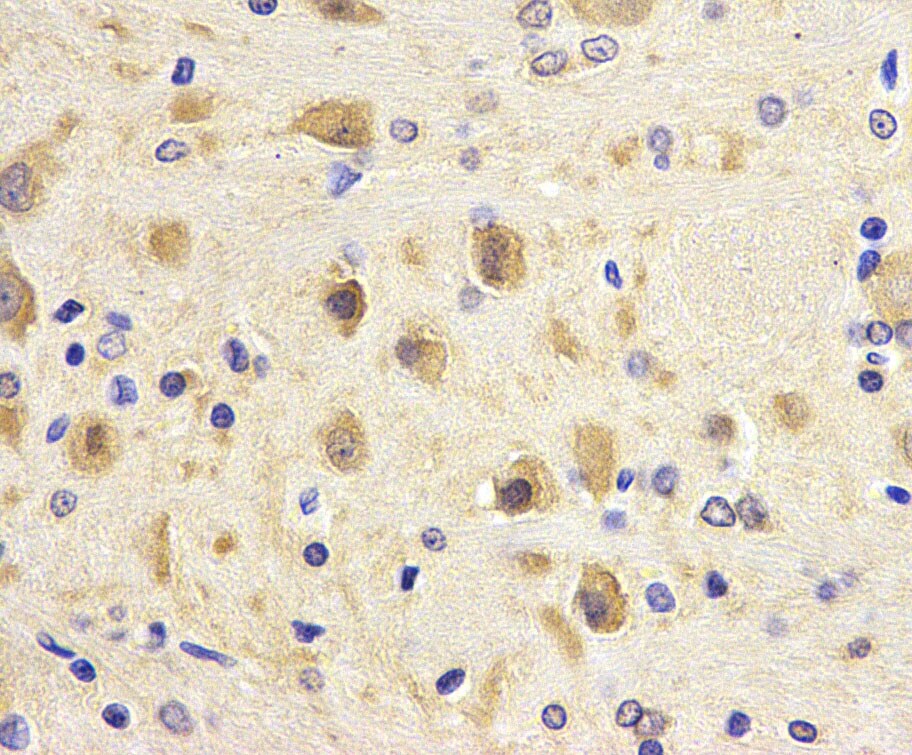
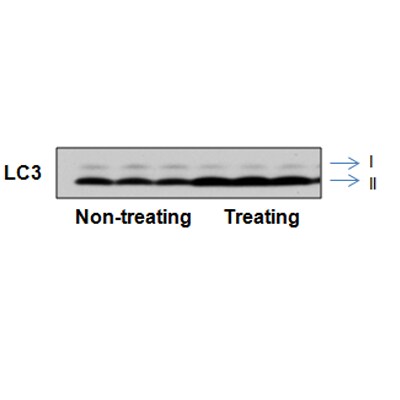


Showing
1
-
5 of
51 reviews
Showing All
Filter By:
-
Application: Immunocytochemistry/ImmunofluorescenceSample Tested: Lung Mesenchymal stem cellsSpecies: HumanVerified Customer | Posted 06/02/2021At the image Lung Mesenchymal Stem Cells show auto-phagosomes in green, actin filaments in red and nucleus in blue. NB100-2220SS antibody shows unspecific binding in nucleus and very specific signal in cytoplasm.Cells were permeabilized with 0,2% triton, fixed with 4% PFA, Blocked with donkey serum, incubated for 1 h RT, washed with PBS-tween 20, incubated with secondary antibody donkey anti-rabbit Alexa-fluor 488, washed and stained with phalloidin texas-red and Hoechst 33342, mounted with anti-fade and photographed in confocal microscopy.

-
Application: Western BlotSample Tested: mouse liver lysateSpecies: MouseVerified Customer | Posted 10/02/2020Works for WB.
-
Application: Western BlotSample Tested: Liver tissueSpecies: MouseVerified Customer | Posted 09/15/2020WT mice liver samples
-
Application: Western BlotSample Tested: C2C12 mouse myoblast cell line and Manduca sexta intersegmental muscleSpecies: Mouse and InsectVerified Customer | Posted 09/10/2020Lysate from C2C12 cells treated with chloroquine (30uM overnight) was used as a positive control. The antibody did not recognize LC3B in lysates from insect muscle (ISM) at any of the three stages of development tested.20ug total protein was loaded on a 12% acrylamide gel. The blot was treated with 1:2000 dilution of antibody overnight at 4C, followed by HRP-labeled secondary and ECL detection.
Bio-Techne ResponseThis review was submitted through the legacy Novus Innovators Program, reflecting a new species or application tested on a primary antibody.
-
Application: Western BlotSample Tested: 20 ug whole cell lysateSpecies: HumanVerified Customer | Posted 06/11/2019LC3 in Human cells1;1000 dilution of antibody in 20ug of protein worked well.
-
Application: Western BlotSample Tested: 20 ug whole cell lysateSpecies: HumanVerified Customer | Posted 06/02/2019Basal LC3 I/II expression in breast cancer lines
-
Application: Western BlotSample Tested: THP-1 whole cell lysateSpecies: HumanVerified Customer | Posted 03/04/2019
-
Application: ImmunocytochemistrySample Tested: hela cellSpecies: HumanVerified Customer | Posted 02/21/2019
-
Application: Western BlotSample Tested: mouse HSPCsSpecies: MouseVerified Customer | Posted 02/04/2019
-
Application: Western BlotSample Tested: Guinea pig ling, liver and heartSpecies: Guinea PigVerified Customer | Posted 02/04/2019
-
Application: Western BlotSample Tested: cochleaSpecies: MouseVerified Customer | Posted 01/31/2019
-
Application: Western BlotSample Tested: HL-1 cell lysateSpecies: MouseVerified Customer | Posted 01/29/2019
-
Application: Simple WesternSample Tested: mouse brain tisseu lysateSpecies: MouseVerified Customer | Posted 01/28/2019
-
Application: Western BlotSample Tested: THP-1 whole cell lysateSpecies: HumanVerified Customer | Posted 07/17/2018THP-1 cells were treated with Rapamycin (100nm) for 24h. Total cell lysates were subjected to western blot. PVDF membrane were probed with 1mm/ml Human LC3B Antibody (NB100-2220) Antibody. A specific band was detected for LC3B I and LC3B II at approximately 13~15 kDa. This experiment was conducted under reducing conditions
-
Application: Western BlotSample Tested: whole cell lysate and fibroblasts whole cell extractSpecies: HumanVerified Customer | Posted 06/07/2018
-
Application: ImmunocytochemistrySample Tested: hela cell and HEK 293Species: HumanVerified Customer | Posted 05/18/2018
-
Application: Western BlotSample Tested: NIH3T3, HeLa, HEK293T, N2a neuroblastoma, Q7 striatal, Sy5Y neuroblastomaSpecies: Mouse and HumanVerified Customer | Posted 05/10/2018LC3 western blot and fluorescence picture
-
Application: Western BlotSample Tested: cochleaSpecies: MouseVerified Customer | Posted 02/22/2018
-
Application: Western BlotSample Tested: mouse hepatocytes and HepG2 cellsSpecies: Mouse and HumanVerified Customer | Posted 11/25/2017
-
Application: Immunohistochemistry-FrozenSample Tested: Human skeletal muscleSpecies: HumanVerified Customer | Posted 08/23/2017LC3 accumulation in muscle fibers from patients with PAD (row B - E). Normal fibers from a Non-PAD sample (row A). Scale bar = 100 µM.For LC3: Fresh-frozen sections were acetone fixed, washed with TBST(1% Tween), blocked for 1 hr with TBST, 5% NGS and incubated ON at 4C with primary antibody. LC3 staining was amplified with biotin followed by a directly conjugated streptavidin.
-
Application: Western BlotSample Tested: NRK rat normal kidney cell lineSpecies: RatVerified Customer | Posted 07/14/2017Used at 1:2500. Please see publication (Lee WK et al. Arch Toxicol 2017, in press) for details. NOVUSCITED
-
Application: Western BlotSample Tested: 20 ug whole cell lysateSpecies: HumanVerified Customer | Posted 04/12/2017
-
Application: Western BlotSample Tested: MacrophageSpecies: MouseVerified Customer | Posted 03/23/2017
-
Application: Western BlotSample Tested: MDA MB 231 whole cell lysates and conditioned mediumSpecies: HumanVerified Customer | Posted 03/14/2017
-
Application: Western BlotSample Tested: murine bone marrow derived macrophagesSpecies: murineVerified Customer | Posted 02/14/2017Macrophage lysates probed with anti-LC3 antibody (NB100-2220)
-
Application: Western BlotSample Tested: Chondrocyte cell lysateSpecies: RatVerified Customer | Posted 01/18/2017
-
Application: ImmunofluorescenceSample Tested: mouse HSPCsSpecies: MouseVerified Customer | Posted 01/29/2016IF-LC3
-
Application: Western BlotSample Tested: mouse HSPCsSpecies: MouseVerified Customer | Posted 01/29/2016LC3-Western blot
-
Application: Simple WesternSample Tested: mouse brain tisseu lysateSpecies: MouseVerified Customer | Posted 01/21/2016Simple Western: LC3B expression in mouse brain lysate
-
Application: Simple WesternSample Tested: SH-SY5Y cell lysateSpecies: HumanVerified Customer | Posted 01/21/2016Simple Western: LC3B expression in SH-SY5Y cell lysate
-
Application: Western BlotSample Tested: Mouse eye tissueSpecies: MouseVerified Customer | Posted 01/20/2016Mouse eye tissue
-
Application: Western BlotSample Tested: Human prostate cancer cell line (PC3)Species: HumanVerified Customer | Posted 07/25/2015LC3 B detection
-
Application: Western BlotSample Tested: Whole cell lysateSpecies: HumanVerified Customer | Posted 01/30/2015Western blot analyses of LC3 expression in different cells
-
Application: Western BlotSample Tested: Guinea pig ling, liver and heartSpecies: OtherVerified Customer | Posted 01/20/2015
-
Application: Western BlotSample Tested:Species: MouseVerified Customer | Posted 06/26/2014A review for LC-3 antibody (NB100-2220)
-
Application: Western BlotSample Tested: MouseSpecies: MouseVerified Customer | Posted 06/13/2014
-
Application: Western BlotSample Tested:Species: HumanVerified Customer | Posted 03/27/2014LC3 in pancreatic cancer cells.
-
Application: ImmunohistochemistrySample Tested: Ovarian cancer tissueSpecies: HumanVerified Customer | Posted 02/28/2014LC3 against human ovarian cancer
-
Application: Immunohistochemistry-ParaffinSample Tested: Rat brainSpecies: RatVerified Customer | Posted 01/16/2014IHC of rat brain
-
Application: Western BlotSample Tested: mouse ventricleSpecies: MouseVerified Customer | Posted 02/12/2013
-
Application: Western BlotSample Tested: HL-1 cell lysateSpecies: MouseVerified Customer | Posted 12/12/2012
-
Application: Western BlotSample Tested: H9C2 extract, Sample Amount: 20ugSpecies: RatVerified Customer | Posted 01/09/2012
-
Application: Western BlotSample Tested: HumanSpecies: HumanVerified Customer | Posted 12/05/2011
-
Application: Western BlotSample Tested: MouseSpecies: MouseVerified Customer | Posted 11/21/2011
-
Application: Western BlotSample Tested: HumanSpecies: HumanVerified Customer | Posted 11/21/2011
-
Application: Western BlotSample Tested: MouseSpecies: MouseVerified Customer | Posted 11/16/2011
-
Application: Western BlotSample Tested: HumanSpecies: HumanVerified Customer | Posted 11/03/2011
-
Application: Western BlotSample Tested: HumanSpecies: HumanVerified Customer | Posted 10/31/2011
-
Application: Western BlotSample Tested: HumanSpecies: HumanVerified Customer | Posted 10/31/2011
-
Application: Western BlotSample Tested: Murine Blastocyst Derived Cells, Sample Amount: 30ugSpecies: MouseVerified Customer | Posted 07/21/2010
-
Application: ImmunoprecipitationSample Tested: IP SampleSpecies: OtherVerified Customer | Posted 06/15/2009
There are no reviews that match your criteria.
Protocols
View specific protocols for LC3B Antibody - BSA Free (NB100-2220):
LC3B Antibody:
Immunohistochemistry-Paraffin Embedded Sections
Antigen Unmasking:
Bring slides to a boil in 10 mM sodium citrate buffer (pH 6.0) then maintain at a sub-boiling temperature for 10 minutes. Cool slides on bench-top for 30 minutes.
Staining:
1. Wash sections in deionized water three times for 5 minutes each.
2. Wash sections in wash buffer for 5 minutes.
3. Block each section with 100-400 ul blocking solution for 1 hour at room temperature.
4. Remove blocking solution and add 100-400 ul diluted primary antibody. Incubate overnight at 4 C.
5. Remove antibody solution and wash sections in wash buffer three times for 5 minutes each.
6. Add 100-400 ul biotinylated diluted secondary antibody. Incubate 30 minutes at room temperature.
7. Remove secondary antibody solution and wash sections three times with wash buffer for 5 minutes each.
8. Add 100-400 ul Streptavidin-HRP reagent to each section and incubate for 30 minutes at room temperature.
9. Wash sections three times in wash buffer for 5 minutes each.
10. Add 100-400 ul DAB substrate to each section and monitor staining closely.
11. As soon as the sections develop, immerse slides in deionized water.
12. Counterstain sections in hematoxylin.
13. Wash sections in deionized water two times for 5 minutes each.
14. Dehydrate sections.
15. Mount coverslips.
Protocol: Inhibition of Autophagy and LC3B Antibody (NB100-2220) Western Blot
Materials
Chloroquine diphosphate (CQ) (10 mM) in dH2O
1X PBS
Sample buffer, 2X Laemmli buffer: 4% SDS, 5% 2-mercaptoethanol (BME), 20% glycerol, 0.004% bromophenol blue, 0.125 M Tris HCl, pH 6.8
RIPA buffer: 150 mM NaCl, 1% NP-40 or Triton X-100, 0.5% sodium deoxycholate, 0.1% SDS, 50 mM Tris-HCl, pH 8.0, 20 mM Tris-HCl, pH 7.5
1X Running Buffer: 25 mM Tris-base, 192 mM glycine, 0.1% SDS. Adjust to pH 8.3
1X Transfer buffer (wet): 25 mM Tris-base, 192 mM glycine, 20% methanol, Adjust to pH 8.3
TBS
TBST, TBS and 0.1% Tween
Blocking solution: TBST, 5% non-fat dry milk
rabbit anti-LC3B primary antibody (NB100-2220) in blocking buffer (~2 ug/mL)
Methods
Tip: For more information on Western Blotting, see our Western Blot handbook.
1. Grow cells (e.g. HeLa or Neuro2A) in vitro to semi-confluency (70-75%).
2. Add CQ to culture dishes to a final concentration of 50 uM and incubate overnight (16 hours). Remember to include an untreated sample as a negative control.
Note: Validated autophagy inducers should be included as positive controls.
3. Rinse cells with ice-cold 1X PBS and lyse cells with sample buffer.
Note: LC3B-I and LC3B-II are sensitive to degradation, although LC3B-I is more labile. These proteins are sensitive to freeze-thaw cycles and SDS sample buffers. Fresh samples should be analyzed quickly to prevent protein degradation.
4. Sonicate and incubate cells for 5 minutes at 95oC.
Tip: Cells are lysed directly in sample buffer or may be lysed in RIPA buffer.
5. Load samples of Chloroquine-treated and -untreated cell lysates 40 ug/lane on a 4-20% polyacrylamide gradient gel (SDS-PAGE).
Tip: For detection of LC3B it is particularly important to monitor the progress of the gel as this protein is relatively small (~14kDa).
Tip: Alternatively, for non-gradient gels, use a 20% polyacrylamide gel.
6. Transfer proteins to a 0.2 um PVDF membrane for 30 minutes at 100V.
7. After transfer, rinse the membrane with dH2O and stain with Ponceau S for 1-2 minutes to confirm efficiency of protein transfer.
8. Rinse the membrane in dH2O to remove excess stain and mark the loaded lanes and molecular weight markers using a pencil.
9. Block the membrane using blocking buffer solution (5% non-fat dry milk in TBST) for 1 hour at room temperature.
10.Rinse the membrane with TBST for 5 minutes.
11.Dilute the rabbit anti-LC3B primary antibody (NB100-2220) (~2 ug/mL) in blocking buffer and incubate the membrane for 1 hour at room temperature.
12.Rinse the membrane with dH2O.
13.Rinse the membrane with TBST, 3 times for 10 minutes each.
14.Incubate the membrane with diluted secondary antibody, according with product's specifications, (e.g. anti-rabbit-IgG HRP-conjugated) in blocking buffer for 1 hour at room temperature.
Note: Tween-20 may be added to the blocking or antibody dilution buffer at a final concentration of 0.05-0.2%, provided it does not interfere with antibody-antigen binding.
15.Rinse the membrane with TBST, 3 times for 10 minutes each.
16.Apply the detection reagent of choice (e.g. BioFX Super Plus ECL) in accordance with the manufacturer's instructions.
17.Image the blot.
Tip: LC3B-I and it's lipidated form LC3B-II have different electrophoretic mobility properties, with the lipidated form moving faster in an SDS-PAGE gel, albeit its larger molecular weight. LC3B-II runs at 14-16 kDa while LC3B-I runs at 16-18kDa.
Note: This assay measures the difference in the LC3B-II signal in the presence and absence of inhibitors (e.g., lysosomotropic agents). When autophagic flux is present or induced in a system an increase in the LC3B-II signal should be observed with the inhibitor.
Find general support by application which include: protocols, troubleshooting, illustrated assays, videos and webinars.
- 7-Amino Actinomycin D (7-AAD) Cell Viability Flow Cytometry Protocol
- Antigen Retrieval Protocol (PIER)
- Antigen Retrieval for Frozen Sections Protocol
- Appropriate Fixation of IHC/ICC Samples
- Cellular Response to Hypoxia Protocols
- ChIP Protocol Video
- Chromatin Immunoprecipitation (ChIP) Protocol
- Chromatin Immunoprecipitation Protocol
- Chromogenic IHC Staining of Formalin-Fixed Paraffin-Embedded (FFPE) Tissue Protocol
- Chromogenic Immunohistochemistry Staining of Frozen Tissue
- ClariTSA™ Fluorophore Kits
- Detection & Visualization of Antibody Binding
- ELISA Sample Preparation & Collection Guide
- ELISA Troubleshooting Guide
- Extracellular Membrane Flow Cytometry Protocol
- Flow Cytometry Protocol for Cell Surface Markers
- Flow Cytometry Protocol for Staining Membrane Associated Proteins
- Flow Cytometry Staining Protocols
- Flow Cytometry Troubleshooting Guide
- Fluorescent IHC Staining of Frozen Tissue Protocol
- Graphic Protocol for Heat-induced Epitope Retrieval
- Graphic Protocol for the Preparation and Fluorescent IHC Staining of Frozen Tissue Sections
- Graphic Protocol for the Preparation and Fluorescent IHC Staining of Paraffin-embedded Tissue Sections
- Graphic Protocol for the Preparation of Gelatin-coated Slides for Histological Tissue Sections
- How to Run an R&D Systems DuoSet ELISA
- How to Run an R&D Systems Quantikine ELISA
- How to Run an R&D Systems Quantikine™ QuicKit™ ELISA
- ICC Cell Smear Protocol for Suspension Cells
- ICC Immunocytochemistry Protocol Videos
- ICC for Adherent Cells
- IHC Sample Preparation (Frozen sections vs Paraffin)
- Immunocytochemistry (ICC) Protocol
- Immunocytochemistry Troubleshooting
- Immunofluorescence of Organoids Embedded in Cultrex Basement Membrane Extract
- Immunofluorescent IHC Staining of Formalin-Fixed Paraffin-Embedded (FFPE) Tissue Protocol
- Immunohistochemistry (IHC) and Immunocytochemistry (ICC) Protocols
- Immunohistochemistry Frozen Troubleshooting
- Immunohistochemistry Paraffin Troubleshooting
- Immunoprecipitation Protocol
- Intracellular Flow Cytometry Protocol Using Alcohol (Methanol)
- Intracellular Flow Cytometry Protocol Using Detergents
- Intracellular Nuclear Staining Flow Cytometry Protocol Using Detergents
- Intracellular Staining Flow Cytometry Protocol Using Alcohol Permeabilization
- Intracellular Staining Flow Cytometry Protocol Using Detergents to Permeabilize Cells
- Preparing Samples for IHC/ICC Experiments
- Preventing Non-Specific Staining (Non-Specific Binding)
- Primary Antibody Selection & Optimization
- Propidium Iodide Cell Viability Flow Cytometry Protocol
- Protocol for Heat-Induced Epitope Retrieval (HIER)
- Protocol for Liperfluo
- Protocol for Making a 4% Formaldehyde Solution in PBS
- Protocol for VisUCyte™ HRP Polymer Detection Reagent
- Protocol for the Characterization of Human Th22 Cells
- Protocol for the Characterization of Human Th9 Cells
- Protocol for the Fluorescent ICC Staining of Cell Smears - Graphic
- Protocol for the Fluorescent ICC Staining of Cultured Cells on Coverslips - Graphic
- Protocol for the Preparation & Fixation of Cells on Coverslips
- Protocol for the Preparation and Chromogenic IHC Staining of Frozen Tissue Sections
- Protocol for the Preparation and Chromogenic IHC Staining of Frozen Tissue Sections - Graphic
- Protocol for the Preparation and Chromogenic IHC Staining of Paraffin-embedded Tissue Sections
- Protocol for the Preparation and Chromogenic IHC Staining of Paraffin-embedded Tissue Sections - Graphic
- Protocol for the Preparation and Fluorescent ICC Staining of Cells on Coverslips
- Protocol for the Preparation and Fluorescent ICC Staining of Non-adherent Cells
- Protocol for the Preparation and Fluorescent ICC Staining of Stem Cells on Coverslips
- Protocol for the Preparation and Fluorescent IHC Staining of Frozen Tissue Sections
- Protocol for the Preparation and Fluorescent IHC Staining of Paraffin-embedded Tissue Sections
- Protocol for the Preparation of Gelatin-coated Slides for Histological Tissue Sections
- Protocol for the Preparation of a Cell Smear for Non-adherent Cell ICC - Graphic
- Protocol: Annexin V and PI Staining by Flow Cytometry
- Protocol: Annexin V and PI Staining for Apoptosis by Flow Cytometry
- Quantikine HS ELISA Kit Assay Principle, Alkaline Phosphatase
- Quantikine HS ELISA Kit Principle, Streptavidin-HRP Polymer
- R&D Systems Quality Control Western Blot Protocol
- Sandwich ELISA (Colorimetric) – Biotin/Streptavidin Detection Protocol
- Sandwich ELISA (Colorimetric) – Direct Detection Protocol
- TUNEL and Active Caspase-3 Detection by IHC/ICC Protocol
- The Importance of IHC/ICC Controls
- Troubleshooting Guide: ELISA
- Troubleshooting Guide: Fluorokine Flow Cytometry Kits
- Troubleshooting Guide: Immunohistochemistry
- Troubleshooting Guide: Western Blot Figures
- Western Blot Conditions
- Western Blot Protocol
- Western Blot Protocol for Cell Lysates
- Western Blot Troubleshooting
- Western Blot Troubleshooting Guide
- View all Protocols, Troubleshooting, Illustrated assays and Webinars
FAQs for LC3B Antibody - BSA Free
Showing
1
-
5 of
15 FAQs
Showing All
-
Q: Can you recommend a good HRP conjugated secondary antibody for this product?
A:
We recommend secondary antibody NB7160 for use with LC3B Antibody (NB100-2220).
-
Q: Can you recommend a positive control (like a recombinant LC3 purified protein) for LC3B antibody NB100-2220? I am using the antibody on a western blot of mouse tissue.
-
Q: Does this antibody also recognizes LC3A and LC3C?
A: This antibody was raised using a synthetic peptide made to an N-terminal portion of the human LC3 protein sequence as immunogen and is expected to detect LC3B protein. The immunogenic sequence employed does not have any similarity to LC3A or LC3C and hence we do not expect any cross-reactivity. This product is one of our best sellers with great customer reviews, as well as with citations in at least 160 peer reviewed publications.
-
Q: Does this antibody recognize LC3A or LC3C too?
A: No; this antibody is specific for LC3B and is not expected to cross-react with LC3A or LC3C.
-
Q: Hello, somewhere on the LC3B antibody page I read it is recommended to use a 0.2uM membrane for western blot?
A: Yes, because LC3B-I is about 14-15 kDa and LC3B-II is even even smaller, the protein may slip through the 0.45 uM membrane and be lost during blotting. However, there has been success using 0.45 uM membranes; a 0.2 uM membrane is something to consider if no signal is detected.
-
Q:
Hello,I already have the antibody, but I was wondering if you could tell me the percent identity to a specific zebrafish LC3 protein. I know it says it works in zebrafish, but we have three and the one I am interested in is the one expressed maternally--- F1QKC7. Here is the Alignment to the human protein your antibody was made. Would you just look at it quick and tell me if the 10 aa peptide is one that is highly similar (like for example aa's 66-71). http://www.uniprot.org/align/2013102541KABHU792. LC3 Antibody (NB100-2220) It is very closely related to my maternal expressed protein. I was just wanting to confirm that it is the right thing and not background staining that I am seeing.
A: Based on the actual immunogen sequence, I am only seeing a 31% homology to the zebrafish sequence you have provided. While the homology is low, there is still a possibility that the antibody could recognize the zebrafish protein. Just for your information, the zebrafish sequence we used for validation was accession number Q7ZUD8. I can offer a few suggestions to verify specific staining in your samples: If it is possible, I would verify by western blot with your tissue. If you can validate by two applications, the staining seen is most likely specific. With the staining, I would run a secondary only or isotype control to ensure that any background staining is not coming from the secondary antibody or other interaction. If you do have access to a knock-down or knock-out, this would be the most ideal way to verify specific staining.
-
Q: I want to know how the lc3 antibody (nb100-2220) was produced and purified?
A: Of course. It is immunogen affinity purified. The immunogen is A synthetic peptide made to an N-terminal portion of the human LC3 protein sequence (between residues 1-100)
-
Q: Is NB100-2220 the same or different from NBP-48614?
A: NB100-2220 is an anti-LC3 Ab. It is similar to NBP1-48614, however they are different Abs. NB100-2220 is specific for only LC3B where as NBP1-48614 is specific for only LC3A I would recommend NB100-2220 if you would like to detect LC3B as it has been in 48 published papers and it has very good reviews. NB100-2220 does detect both LCI and LCII.
-
Q: We just bought the LC3 antibody (NB100-2220) from your company, and this product arrived at our lab today. Unfortunately, I just found that the label on the antibody vial showed "pAB LC3 antibody", so we are confused with the "p", what does "P"mean, usually it means"phosphorylated". So, I am wondering what does "p" mean, as the phosphorylated antibody is not we wanted. BTW, the datasheet of this product never mentioned the "phosphorylated"
A: I am sorry for any confusion. "pAB" stands for polyclonal antibody. Our NB100-2220 is not phosphorylated.
-
Q: What are the best blocking conditions for NB100-2220?
A: The conditions we have had the most success with are 5% milk + 1% BSA as the block. Our lab also recommends doing an overnight incubation as this is how we run our QC tests in the lab at 4 degrees C.
-
Q: What is the difference in localization for LC3-I and LC3-II?
A: LC3-I is cytoplasmic, whereas LC3-II binds to the autophagic membranes.
-
Q: What is the isotype of this antibody? I would like to find an isotype control.
A: This is a polyclonal antibody from rabbit. The isotype of this antibody, and all rabbit antibodies, will be IgG.
-
Q: What is the utility of a blocking peptide? Can you recommend a blocking peptide for this LC3B antibody NB100-2220?
A:
If you are interested in using a blocking peptide for this antibody, we recommend NB100-2220PEP.
NB100-2220PEP is essentially the exact immunogen of our NB100-2220 antibody and you may use it to perform a blocking experiment to show the specificity of this antibody.
Blocking experiments show that the band that seen and blocked upon treating the antibody with blocking peptide is the specific band detected by the antibody NB100-2220.
-
Q: What proteins are recognized by this antibody? On the datasheet, the Specificity section states 'This antibody is specific for LC3B.' However, in the Gene Symbol is listed as MAP1LC3A and the protein sequence Q9H492 is for MAP1LC3A. Can you tell me which target the antibody recognizes?
A: This antibody was designed to detect both LC3I and LC3II, but we have experienced through our testing that it much more routinely picks up LC3B. It will sometimes pick up both bands, but it depends on how the cells are prepared often times if they are induced to express that second LC3A band, which is why we have it named as LC3B. We have other LC3 antibodies that do pick up both bands regularly.
-
Q: Why are there two bands present when I use LC3B antibody NB100-2220 for a western blot of LC3B?
A:
LC3 is a soluble protein with a molecular mass of ∼17 kDa and is distributed ubiquitously in eukaryotes. It is expressed as the splice variants LC3A, LC3B, and LC3C. All LC3 isoforms undergo post-translational modifications, especially PE conjugation (lipidation) during autophagy. Upon autophagic signal, the cytosolic form of LC3 (LC3-I) is conjugated to PE to form LC3-PE conjugate (LC3-II), which is recruited to the autophagosomal membranes.
For more information, you can refer to our resource page
-
Q: Can you recommend a good HRP conjugated secondary antibody for this product?
A:
We recommend secondary antibody NB7160 for use with LC3B Antibody (NB100-2220).
-
Q: Can you recommend a positive control (like a recombinant LC3 purified protein) for LC3B antibody NB100-2220? I am using the antibody on a western blot of mouse tissue.
-
Q: Does this antibody also recognizes LC3A and LC3C?
A: This antibody was raised using a synthetic peptide made to an N-terminal portion of the human LC3 protein sequence as immunogen and is expected to detect LC3B protein. The immunogenic sequence employed does not have any similarity to LC3A or LC3C and hence we do not expect any cross-reactivity. This product is one of our best sellers with great customer reviews, as well as with citations in at least 160 peer reviewed publications.
-
Q: Does this antibody recognize LC3A or LC3C too?
A: No; this antibody is specific for LC3B and is not expected to cross-react with LC3A or LC3C.
-
Q: Hello, somewhere on the LC3B antibody page I read it is recommended to use a 0.2uM membrane for western blot?
A: Yes, because LC3B-I is about 14-15 kDa and LC3B-II is even even smaller, the protein may slip through the 0.45 uM membrane and be lost during blotting. However, there has been success using 0.45 uM membranes; a 0.2 uM membrane is something to consider if no signal is detected.
-
Q:
Hello,I already have the antibody, but I was wondering if you could tell me the percent identity to a specific zebrafish LC3 protein. I know it says it works in zebrafish, but we have three and the one I am interested in is the one expressed maternally--- F1QKC7. Here is the Alignment to the human protein your antibody was made. Would you just look at it quick and tell me if the 10 aa peptide is one that is highly similar (like for example aa's 66-71). http://www.uniprot.org/align/2013102541KABHU792. LC3 Antibody (NB100-2220) It is very closely related to my maternal expressed protein. I was just wanting to confirm that it is the right thing and not background staining that I am seeing.
A: Based on the actual immunogen sequence, I am only seeing a 31% homology to the zebrafish sequence you have provided. While the homology is low, there is still a possibility that the antibody could recognize the zebrafish protein. Just for your information, the zebrafish sequence we used for validation was accession number Q7ZUD8. I can offer a few suggestions to verify specific staining in your samples: If it is possible, I would verify by western blot with your tissue. If you can validate by two applications, the staining seen is most likely specific. With the staining, I would run a secondary only or isotype control to ensure that any background staining is not coming from the secondary antibody or other interaction. If you do have access to a knock-down or knock-out, this would be the most ideal way to verify specific staining.
-
Q: I want to know how the lc3 antibody (nb100-2220) was produced and purified?
A: Of course. It is immunogen affinity purified. The immunogen is A synthetic peptide made to an N-terminal portion of the human LC3 protein sequence (between residues 1-100)
-
Q: Is NB100-2220 the same or different from NBP-48614?
A: NB100-2220 is an anti-LC3 Ab. It is similar to NBP1-48614, however they are different Abs. NB100-2220 is specific for only LC3B where as NBP1-48614 is specific for only LC3A I would recommend NB100-2220 if you would like to detect LC3B as it has been in 48 published papers and it has very good reviews. NB100-2220 does detect both LCI and LCII.
-
Q: We just bought the LC3 antibody (NB100-2220) from your company, and this product arrived at our lab today. Unfortunately, I just found that the label on the antibody vial showed "pAB LC3 antibody", so we are confused with the "p", what does "P"mean, usually it means"phosphorylated". So, I am wondering what does "p" mean, as the phosphorylated antibody is not we wanted. BTW, the datasheet of this product never mentioned the "phosphorylated"
A: I am sorry for any confusion. "pAB" stands for polyclonal antibody. Our NB100-2220 is not phosphorylated.
-
Q: What are the best blocking conditions for NB100-2220?
A: The conditions we have had the most success with are 5% milk + 1% BSA as the block. Our lab also recommends doing an overnight incubation as this is how we run our QC tests in the lab at 4 degrees C.
-
Q: What is the difference in localization for LC3-I and LC3-II?
A: LC3-I is cytoplasmic, whereas LC3-II binds to the autophagic membranes.
-
Q: What is the isotype of this antibody? I would like to find an isotype control.
A: This is a polyclonal antibody from rabbit. The isotype of this antibody, and all rabbit antibodies, will be IgG.
-
Q: What is the utility of a blocking peptide? Can you recommend a blocking peptide for this LC3B antibody NB100-2220?
A:
If you are interested in using a blocking peptide for this antibody, we recommend NB100-2220PEP.
NB100-2220PEP is essentially the exact immunogen of our NB100-2220 antibody and you may use it to perform a blocking experiment to show the specificity of this antibody.
Blocking experiments show that the band that seen and blocked upon treating the antibody with blocking peptide is the specific band detected by the antibody NB100-2220.
-
Q: What proteins are recognized by this antibody? On the datasheet, the Specificity section states 'This antibody is specific for LC3B.' However, in the Gene Symbol is listed as MAP1LC3A and the protein sequence Q9H492 is for MAP1LC3A. Can you tell me which target the antibody recognizes?
A: This antibody was designed to detect both LC3I and LC3II, but we have experienced through our testing that it much more routinely picks up LC3B. It will sometimes pick up both bands, but it depends on how the cells are prepared often times if they are induced to express that second LC3A band, which is why we have it named as LC3B. We have other LC3 antibodies that do pick up both bands regularly.
-
Q: Why are there two bands present when I use LC3B antibody NB100-2220 for a western blot of LC3B?
A:
LC3 is a soluble protein with a molecular mass of ∼17 kDa and is distributed ubiquitously in eukaryotes. It is expressed as the splice variants LC3A, LC3B, and LC3C. All LC3 isoforms undergo post-translational modifications, especially PE conjugation (lipidation) during autophagy. Upon autophagic signal, the cytosolic form of LC3 (LC3-I) is conjugated to PE to form LC3-PE conjugate (LC3-II), which is recruited to the autophagosomal membranes.
For more information, you can refer to our resource page
Loading...