Myosin Heavy Chain Antibody (MF20)
R&D Systems | Catalog # MAB4470

Key Product Details
Validated by
Species Reactivity
Validated:
Cited:
Applications
Validated:
Cited:
Label
Antibody Source
Product Specifications
Immunogen
Specificity
Clonality
Host
Isotype
Scientific Data Images for Myosin Heavy Chain Antibody (MF20)
Myosin Heavy Chain in C2C12 Mouse Cell Line.
Myosin Heavy Chain was detected in immersion fixed C2C12 mouse myoblast cell line using Mouse Anti-Human Myosin Heavy Chain Monoclonal Antibody (Catalog # MAB4470) at 10 µg/mL for 3 hours at room temperature. Cells were stained using the NorthernLights™ 557-conjugated Anti-Mouse IgG Secondary Antibody (red; Catalog # NL007) and counter-stained with DAPI (blue). View our protocol for Fluorescent ICC Staining of Cells on Coverslips.
Myosin Heavy Chain in Human Skeletal Muscle.
Myosin Heavy Chain was detected in immersion fixed paraffin-embedded sections of human skeletal muscle using Mouse Anti-Myosin Heavy Chain Monoclonal Antibody (Catalog # MAB4470) at 5 µg/mL for 1 hour at room temperature followed by incubation with the Anti-Mouse IgG VisUCyte™ HRP Polymer Antibody (Catalog # VC001). Before incubation with the primary antibody, tissue was subjected to heat-induced epitope retrieval using Antigen Retrieval Reagent-Basic (Catalog # CTS013). Tissue was stained using DAB (brown) and counterstained with hematoxylin (blue). Specific staining was localized to sarcoplasm. View our protocol for IHC Staining with VisUCyte HRP Polymer Detection Reagents.
Myosin Heavy Chain in Mouse Skeletal Muscle.
Myosin Heavy Chain was detected in perfusion fixed frozen sections of mouse skeletal muscle using Mouse Anti-Myosin Heavy Chain Monoclonal Antibody (Catalog # MAB4470) at 5 µg/mL for 1 hour at room temperature followed by incubation with the Anti-Mouse IgG VisUCyte™ HRP Polymer Antibody (Catalog # VC001). Before incubation with the primary antibody, tissue was subjected to heat-induced epitope retrieval using Antigen Retrieval Reagent-Basic (Catalog # CTS013). Tissue was stained using DAB (brown) and counterstained with hematoxylin (blue). Specific staining was localized to sarcoplasm. View our protocol for IHC Staining with VisUCyte HRP Polymer Detection Reagents.
Detection of Mouse Myosin Heavy Chain by Western Blot
Knockdown of BAMBI inhibited myogenic differentiation. All the cell samples were harvested after transfection and myogenic induction for 48 and 96 h. (a) The western blot images of BAMBI and GAPDH; (b) the efficiency of siRNA interference on the mRNA and protein expression of BAMBI; (c) the mRNA expression of MyoD at 48 h and that of MyoG and MyHC at 96 h; (d) the western blot images of MyoD at 48 h, MyHC at 96 h, and their corresponding GAPDH; (e) the protein expression of MyoD at 48 h and MyHC at 96 h; (f) immunofluorescence of MyHC in C2C12 myotubes at 96 h post differentiation, images captured at 100× magnification; (g) the populations of myotubes; (h) the differentiation index; and (i) the myotube fusion index. The results were represented as mean ± SD; n = 3; * p < 0.05; ** p < 0.01. Image collected and cropped by CiteAb from the following publication (https://www.mdpi.com/1422-0067/16/8/17734), licensed under a CC-BY license. Not internally tested by R&D Systems.
Detection of Human Myosin Heavy Chain by Immunocytochemistry/Immunofluorescence
Generation of DM1-iPSCs and their differentiation.(A) The strategy of our study: patient iPSCs were passed and differentiated at three different passage numbers into CMs or neurons giving 9 samples (left), or had a MyoD1 vector transfected and were differentiated into myocytes, giving 6 samples (right). The CTG repeat lengths were measured in each sample. (B) Six clones from three different DM1 patients expressed pluripotent stem cell markers (Oct3/4, Nanog and Sox2) in conventional PCR. beta -actin was used as a loading control. (C) Karyotypic analysis of undifferentiated iPSCS (Pt-1B). (D, left) Representative live image of CMs on day 20 (Pt-1B). A video clip is available in Supplementary Video 1. (D, right) FACS analysis of the CMs shown in the picture on the left. The X-axis indicates the percentage of cardiac troponin T (cTnT)-positive cells among the total number of CMs. The Y-axis indicates the autofluorescence of the CMs. (E) Representative immunostaining image of neurons on day 42 (Pt-1B). The left panel shows neurons that expressed Tyrosine Hydroxylase (TH) and Microtubule-associated protein 2 (Map2). The right panel shows neurons that expressed TH and Neuron-specific Class III beta -tubulin (TUJ1). (F) Representative immunostaining image of myocytes on day 7 (Pt-1B). The myocytes expressed Myosin Heavy Chain (MHC). Hoechst stains the nuclei. Image collected and cropped by CiteAb from the following publication (https://www.nature.com/articles/srep42522), licensed under a CC-BY license. Not internally tested by R&D Systems.
Detection of Mouse Myosin Heavy Chain by Western Blot
LiCl rescued the inhibitory effect of BAMBI siRNA on C2C12 myogenic differentiation. All the cell samples were harvested after transfection and myogenic induction for 48 and 96 h. (a) The mRNA expression of MyoD at 48 h and that of MyoG and MyHC at 96 h; (b) the western blot images of MyoD, MyHC, and GAPDH; (c) the protein expression of MyoD at 48 h and MyHC at 96 h; (d) immunofluorescence images of MyHC in C2C12 myotubes at 96 h post differentiation, images captured at 100× magnification; (e) the populations of myotubes; (f) the differentiation index and (g) the myotube fusion index. The results were represented as mean ± SD; n = 3; * p < 0.05; ** p < 0.01. Image collected and cropped by CiteAb from the following publication (https://www.mdpi.com/1422-0067/16/8/17734), licensed under a CC-BY license. Not internally tested by R&D Systems.
Detection of Human Myosin Heavy Chain by Immunocytochemistry/Immunofluorescence
Differentiated myotubes do not differ significantly between HD- and HF-derived skeletal muscle progenitor cells. (a) At day 7 after stimulation, myotubes were stained for the expression of MyHC with an antibody that recognizes the heavy chain of myosin II (MF20) and markers of slow MYH7 and fast MYH1/MYH2 fibers. Nuclei were labelled with DAPI (blue). Representative images are given for both HF- and HD-derived samples. Scale bars represent 50 μm. (b) Fusion coefficient is calculated as a percent of nuclei incorporated in MF20+ myotubes at day 7 after stimulation, and it does not differ between HD- and HF-derived samples. (c) mRNA expression analysis was performed for key markers of muscle development and metabolism for both HF- and HD-derived samples. Image collected and cropped by CiteAb from the following publication (https://pubmed.ncbi.nlm.nih.gov/30719048), licensed under a CC-BY license. Not internally tested by R&D Systems.
Detection of Mouse Myosin Heavy Chain by Western Blot
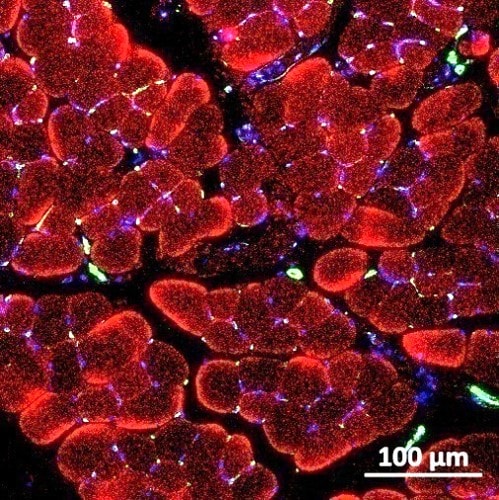
MiR-106a-5p inhibited the myogenic differentiation of C2C12 myoblasts. (A) Overexpression efficiency of miR-106a-5p 3 days (d) and 5 d post differentiation. NC: negative control; (B) The fluorescent microscopy images of C2C12 cells transfected with FAM-labeled miR-106a-5p agomir (×10). Scale bars = 500 μm; (C) Immunostaining for MyHC (red) and DAPI (blue) on 5 d post differentiation (×20). Scale bars = 100 μM; (D–F) The statistical results of differentiation index, fusion index and the populations of myotubes, respectively;1-3 indicates myotubes with 1, 2 or 3 nucleus, >4 indicates myotubes with 4 more nucleus; (G,H) The mRNA expression of MyoD, MyoG, MyHC on 3 d and 5 d post differentiation; (I,J) The mRNA expression of Myomarker and Myomixer 3 d and 5 d post differentiation; (K) The statistical results of MyoD, MyoG, MyHC proteins in Figure 2L; (L) Western blot analyzed for MyoD, MyoG, MyHC proteins 5 d post differentiation; (M) Protein levels of key molecules in PI3K-AKT pathway in C2C12 cells transfected with miR-106a-5p agomir or NC on 5 d post differentiation; (N) The statistical analysis of phosphorylated PI3K (p85 alpha ), AKT (sre473) and mTOR (ser2448). Data were presented as mean ± SEM. n = 3 per group. * p < 0.05, ** p < 0.01. Image collected and cropped by CiteAb from the following publication (https://pubmed.ncbi.nlm.nih.gov/30004470), licensed under a CC-BY license. Not internally tested by R&D Systems.
Detection of Human Myosin Heavy Chain Antibody by Immunocytochemistry/ Immunofluorescence
Generation of DM1-iPSCs and their differentiation.(A) The strategy of our study: patient iPSCs were passed and differentiated at three different passage numbers into CMs or neurons giving 9 samples (left), or had a MyoD1 vector transfected and were differentiated into myocytes, giving 6 samples (right). The CTG repeat lengths were measured in each sample. (B) Six clones from three different DM1 patients expressed pluripotent stem cell markers (Oct3/4, Nanog and Sox2) in conventional PCR. beta -actin was used as a loading control. (C) Karyotypic analysis of undifferentiated iPSCS (Pt-1B). (D, left) Representative live image of CMs on day 20 (Pt-1B). A video clip is available in Supplementary Video 1. (D, right) FACS analysis of the CMs shown in the picture on the left. The X-axis indicates the percentage of cardiac troponin T (cTnT)-positive cells among the total number of CMs. The Y-axis indicates the autofluorescence of the CMs. (E) Representative immunostaining image of neurons on day 42 (Pt-1B). The left panel shows neurons that expressed Tyrosine Hydroxylase (TH) and Microtubule-associated protein 2 (Map2). The right panel shows neurons that expressed TH and Neuron-specific Class III beta -tubulin (TUJ1). (F) Representative immunostaining image of myocytes on day 7 (Pt-1B). The myocytes expressed Myosin Heavy Chain (MHC). Hoechst stains the nuclei. Image collected and cropped by CiteAb from the following publication (https://pubmed.ncbi.nlm.nih.gov/28211918), licensed under a CC-BY license. Not internally tested by R&D Systems.
Detection of Myosin Heavy Chain in C2C12 cells by Flow Cytometry
C2C12 cells were stained with Mouse Anti-Myosin Heavy Chain Monoclonal Antibody (Catalog # mab4470, filled histogram) or isotype control antibody (Catalog # MAB004, open histogram) followed by Allophycocyanin-conjugated Anti-Mouse IgG Secondary Antibody (Catalog # F0101B). To facilitate intracellular staining, cells were fixed with Flow Cytometry Fixation Buffer (Catalog # FC004) and permeabilized with Saponin. View our protocol for Staining Intracellular Molecules.
Detection of Myosin Heavy Chain by Immunohistochemistry
Sarcomere formation in contracting human myotubes on mouse fibroblast feeders. (A) After 7–8 days of differentiation, the differentiated human myotubes (derived from HSMM) on the feeder layers of mouse 3T3L1 fibroblasts were fixed and then observed for myotubular formation by using anti-human nuclear antigen (anti-HNA) and anti-Caveolin 3 antibodies, as described in the “Methods” section. DAPI was used for nuclear staining. Scale bar = 25 μm. Three independent experiments were performed, and representative images are presented. (B) The differentiated human myotubes on the mouse fibroblast feeders were subjected to either no (panels a and b) EPS or (panels c and d) EPS treatment (1 Hz frequency, 4-ms duration, 20 V/25 mm for a total 24 h of with intermittent intervals) and then fixed for evaluating sarcomere formation status by using anti-sarcomeric-alpha -actinin (green) and anti-Caveolin 3 (red) antibodies. DAPI was used for nuclear staining (blue). Scale bar = 25 μm. Magnified images (panels b and d) of the white boxes in panels a and c, respectively, are also presented. Three independent experiments were performed and representative images are presented. Image collected and cropped by CiteAb from the following open publication (https://pubmed.ncbi.nlm.nih.gov/35058512), licensed under a CC-BY license. Not internally tested by R&D Systems.
Detection of Myosin Heavy Chain by Western Blot
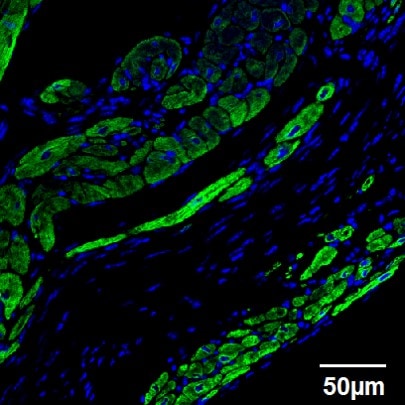
Supplementation with 2-DG reduces cachexic muscle atrophy by blocking USP and ALP pathway activation in C26 conditioned medium-treated C2C12 myotubes. (A) Western blot analysis was used to evaluate atrogin-1, MuRF-1, MHC, p-STAT3, and STAT3 expression in three groups between two cachexia cell lines models. (B) Myosin heavy-chain (MHC) expression in the cell model was evaluated by immunofluorescence staining. Scale bar: 50 µM. MHC, green; Hoechst, blue. The bar graph shows the mean gray value of different groups. (C) Western blot analysis was used to evaluate atrogin-1, MuRF-1, p-STAT3, STAT3, p62, LC3, cleaved PARP, and cleaved caspase3 expression in the cell model of the four groups. Cells were treated with 5 mM 2-DG, 20 µM cisplatin, or 25 µM chloroquine for 24 h. (D) LC3 expression in the cell model was evaluated by immunofluorescence staining. Scale bar: 50 µM. LC3, green; Hoechst, blue. The bar graph shows the mean gray value of different groups. Data are expressed as the mean ± SD, * p < 0.05, ** p < 0.01 compared with NC groups; # p < 0.05, ## p < 0.01 compared with C26 CM group or TNF alpha /IFN gamma group, n = 10. Image collected and cropped by CiteAb from the following open publication (https://pubmed.ncbi.nlm.nih.gov/36230949), licensed under a CC-BY license. Not internally tested by R&D Systems.
Detection of Myosin Heavy Chain by Western Blot
Supplementation with creatine inhibits UPS and ALS activation, thereby preventing skeletal muscle atrophy. (A) Representative HE staining showing the morphological changes in the muscles of the three groups. Average size of muscle fiber cross-sectional area in the NC mice, cachectic mice, or creatine-treated cachectic mice. Representative Masson’s trichrome staining of paraffin sections from muscle fibers of different groups of mice is shown. The bar graph shows the collagen volume fraction (CVF) measured by ImageJ. The glycogen content was determined by Periodic Acid-Schiff (PAS) staining. The histogram shows the optical density (OD) of PAS staining. (B) Gastrocnemius myosin heavy chain (MHC) expression was evaluated by immunofluorescence (IF) staining. The bar graph shows the mean gray value of different groups. Gastrocnemius sections were stained with an antibody against laminin and DAPI. The bar graph shows the mean gray value of different groups. (C) Western blot analysis was used to evaluate MHC, Atrogin-1 and MuRF-1 expression in the three groups (mean ± SD, n = 6). *p < 0.05, **p < 0.01. (D). Western blot analysis was used to evaluate p62 and LC3 expression in the three groups (mean ± SD, n = 6). *p < 0.05, **p < 0.01. (E) Western blot analysis was used to evaluate iNOS, p-Akt, p-AMPK, p-mTOR, p-4EBP1, p-S6 and p-STAT3 in the three groups (mean ± SD, n = 6). *p < 0.05, **p < 0.01. Data are expressed as the mean ± SD. Image collected and cropped by CiteAb from the following open publication (https://pubmed.ncbi.nlm.nih.gov/36569317), licensed under a CC-BY license. Not internally tested by R&D Systems.
Detection of Myosin Heavy Chain by Western Blot
Supplementation with 2-DG reduces cachexic muscle atrophy by blocking USP and ALP pathway activation in C26 conditioned medium-treated C2C12 myotubes. (A) Western blot analysis was used to evaluate atrogin-1, MuRF-1, MHC, p-STAT3, and STAT3 expression in three groups between two cachexia cell lines models. (B) Myosin heavy-chain (MHC) expression in the cell model was evaluated by immunofluorescence staining. Scale bar: 50 µM. MHC, green; Hoechst, blue. The bar graph shows the mean gray value of different groups. (C) Western blot analysis was used to evaluate atrogin-1, MuRF-1, p-STAT3, STAT3, p62, LC3, cleaved PARP, and cleaved caspase3 expression in the cell model of the four groups. Cells were treated with 5 mM 2-DG, 20 µM cisplatin, or 25 µM chloroquine for 24 h. (D) LC3 expression in the cell model was evaluated by immunofluorescence staining. Scale bar: 50 µM. LC3, green; Hoechst, blue. The bar graph shows the mean gray value of different groups. Data are expressed as the mean ± SD, * p < 0.05, ** p < 0.01 compared with NC groups; # p < 0.05, ## p < 0.01 compared with C26 CM group or TNF alpha /IFN gamma group, n = 10. Image collected and cropped by CiteAb from the following open publication (https://pubmed.ncbi.nlm.nih.gov/36230949), licensed under a CC-BY license. Not internally tested by R&D Systems.
Detection of Myosin Heavy Chain by Western Blot
Supplementation with creatine prevents myotubular atrophy by inhibiting the activation of UPS and ALS. (A) Western blot analysis was performed to evaluate the expression of MHC, Atrogin-1, MuRF-1, Myostatin, p62, LC3, p-AMPK, p-Akt, p-S6 and p-4EBP1 in the NC group, cachexia group and cachexia + Cr group (mean ± SD, n = 6). *p < 0.05, **p < 0.01, ***p < 0.001. (B) Myosin heavy chain (MHC) expression in the cell model was evaluated by IF staining. MHC, green, DAPI, blue. The bar graph shows the mean gray value of different groups. (C) LC3 expression in the cell model was evaluated by IF staining. LC3, green, DAPI, blue. The bar graph shows the mean gray value of different groups. Data are expressed as the mean ± SD, **p < 0.01. Image collected and cropped by CiteAb from the following open publication (https://pubmed.ncbi.nlm.nih.gov/36569317), licensed under a CC-BY license. Not internally tested by R&D Systems.
Detection of Myosin Heavy Chain by Western Blot
Supplementation with creatine inhibits UPS and ALS activation, thereby preventing skeletal muscle atrophy. (A) Representative HE staining showing the morphological changes in the muscles of the three groups. Average size of muscle fiber cross-sectional area in the NC mice, cachectic mice, or creatine-treated cachectic mice. Representative Masson’s trichrome staining of paraffin sections from muscle fibers of different groups of mice is shown. The bar graph shows the collagen volume fraction (CVF) measured by ImageJ. The glycogen content was determined by Periodic Acid-Schiff (PAS) staining. The histogram shows the optical density (OD) of PAS staining. (B) Gastrocnemius myosin heavy chain (MHC) expression was evaluated by immunofluorescence (IF) staining. The bar graph shows the mean gray value of different groups. Gastrocnemius sections were stained with an antibody against laminin and DAPI. The bar graph shows the mean gray value of different groups. (C) Western blot analysis was used to evaluate MHC, Atrogin-1 and MuRF-1 expression in the three groups (mean ± SD, n = 6). *p < 0.05, **p < 0.01. (D). Western blot analysis was used to evaluate p62 and LC3 expression in the three groups (mean ± SD, n = 6). *p < 0.05, **p < 0.01. (E) Western blot analysis was used to evaluate iNOS, p-Akt, p-AMPK, p-mTOR, p-4EBP1, p-S6 and p-STAT3 in the three groups (mean ± SD, n = 6). *p < 0.05, **p < 0.01. Data are expressed as the mean ± SD. Image collected and cropped by CiteAb from the following open publication (https://pubmed.ncbi.nlm.nih.gov/36569317), licensed under a CC-BY license. Not internally tested by R&D Systems.
Detection of Myosin Heavy Chain by Western Blot
Supplementation with creatine prevents myotubular atrophy by inhibiting the activation of UPS and ALS. (A) Western blot analysis was performed to evaluate the expression of MHC, Atrogin-1, MuRF-1, Myostatin, p62, LC3, p-AMPK, p-Akt, p-S6 and p-4EBP1 in the NC group, cachexia group and cachexia + Cr group (mean ± SD, n = 6). *p < 0.05, **p < 0.01, ***p < 0.001. (B) Myosin heavy chain (MHC) expression in the cell model was evaluated by IF staining. MHC, green, DAPI, blue. The bar graph shows the mean gray value of different groups. (C) LC3 expression in the cell model was evaluated by IF staining. LC3, green, DAPI, blue. The bar graph shows the mean gray value of different groups. Data are expressed as the mean ± SD, **p < 0.01. Image collected and cropped by CiteAb from the following open publication (https://pubmed.ncbi.nlm.nih.gov/36569317), licensed under a CC-BY license. Not internally tested by R&D Systems.
Detection of Myosin Heavy Chain by Western Blot
Has2os expression was increased in differentiated muscle cells. (A). The morphological changes in C2C12 cells before and after differentiation. D0 represents cells in growth medium, and D1, D3, and D5 represent cells switched into differentiation medium for 1, 3, or 5 days. Scale bar = 200 μm. (B). The mRNA expression levels of the myogenic marker MyHC, Mef2C, MyoD, and MyoG were measured before and after the differentiation of C2C12 cells. (C). The protein expression levels of myogenic markers MyHC and MEF2C were detected by Western blot. GAPDH was the internal control. (D). Relative expression in (C) were calculated. (E). The expression levels of Has2os in D0, D1, D3, and D5. GAPDH was the internal control. Values were presented as means ± SEM. The statistical significance was calculated by t-test. Image collected and cropped by CiteAb from the following open publication (https://pubmed.ncbi.nlm.nih.gov/36359891), licensed under a CC-BY license. Not internally tested by R&D Systems.
Detection of Myosin Heavy Chain by Western Blot
Hoil-1l knockout C2C12 shows impaired myotube differentiation. (A) Schematic presentation of reported mutations and Hoil-1l knockout locus of C2C12 myoblast in HOIL-1L protein domains and amino acid sequences near the KO sites. (B) Immunoblot analysis of lysates of WT and Hoil-1l knockout myoblasts on day 5. Although HOIP and SHARPIN levels were decreased, HOIL-1L expression level was remarkably decreased in KO C2C12 derived myotubes. (C) Fusion index and MHC density were calculated on day 5. All data are presented as mean ± SEM. P values from Welch’s t-test. WT vs Exon 5 KO and Exon 7 KO. *P < 0.05, **P < 0.01. (D) Western blotting shows impaired expression of MHC in Hoil-1l knockout C2C12 myotube. Image collected and cropped by CiteAb from the following open publication (https://www.nature.com/articles/s41598-024-57504-1), licensed under a CC-BY license. Not internally tested by R&D Systems.
Detection of Myosin Heavy Chain by Western Blot
The effects of CJME on CT26 conditioned medium (CM) induced-myotube atrophy. The C2C12 myoblasts were differentiated for 2 days and induced to form myotubes. (A) Effect of CJME on differentiated myotubes viability were determined using WST-1 assay. (B) Indicated CJME concentrations were used for pretreatment 1 h prior to treatment with CT26 CM for 48 h in differentiated myotubes. mRNA levels of (B) Atrogin-1 and (C) MuRF1 were determined using real-time PCR. Relative mRNA expression levels were normalized to those of GAPDH. (D) Protein levels of MyHC, Atrogin-1 and MuRF1 were analyzed via immunoblotting in cells cultured as described in B. (E) Differentiated myotubes were cultured as described in B, fixed with 4% PAF and stained with Crystal violet. Representative images of stained myotubes were shown (left). The scale bar represents 200 μm. Myotube thickness was measured using Image J 1.53 software (right) (F) Differentiated myotubes were pretreated with 20 μg/mL of CJME for 1 h and exposed to CT26 CM for various times (0, 3, 6, 12, 24, and 48 h). Then, phosphorylation of STAT1, STAT2, STAT3, ERK, JNK, p38, IKK alpha / beta and I kappa B alpha was examined using immunoblotting (left). Quantified data for STAT3 were measured using Image J 1.53 software (right) (G) Differentiated myotubes were cultured as described in B, secreted levels of IL-6 in the culture medium were measured using ELISA. Data are representative of either two independent experiments. Data are presented in terms of the mean ± standard deviation and analyzed using a one-wayANOVA or Student's t-test. P value of <0.05 (*), <0.01 (**), <0.001 (***), or <0.0001 (****) were considered statistically significant. Image collected and cropped by CiteAb from the following open publication (https://pubmed.ncbi.nlm.nih.gov/40469669), licensed under a CC-BY license. Not internally tested by R&D Systems.Applications for Myosin Heavy Chain Antibody (MF20)
Flow Cytometry
Sample: C2C12 mouse myoblast cell line
Immunocytochemistry
Sample: Immersion fixed C2C12 mouse myoblast cell line
Immunohistochemistry
Sample: Immersion fixed paraffin-embedded sections of human skeletal muscle and perfusion fixed frozen sections of mouse skeletal muscle
Western Blot
Reviewed Applications
Read 9 reviews rated 4.6 using MAB4470 in the following applications:
Flow Cytometry Panel Builder
Bio-Techne Knows Flow Cytometry
Save time and reduce costly mistakes by quickly finding compatible reagents using the Panel Builder Tool.
Advanced Features
- Spectra Viewer - Custom analysis of spectra from multiple fluorochromes
- Spillover Popups - Visualize the spectra of individual fluorochromes
- Antigen Density Selector - Match fluorochrome brightness with antigen density

Formulation, Preparation, and Storage
Purification
Reconstitution
Reconstitute at 0.5 mg/mL in sterile PBS. For liquid material, refer to CoA for concentration.
Formulation
*Small pack size (-SP) is supplied either lyophilized or as a 0.2 µm filtered solution in PBS.
Shipping
Stability & Storage
- 12 months from date of receipt, -20 to -70 °C as supplied.
- 1 month, 2 to 8 °C under sterile conditions after reconstitution.
- 6 months, -20 to -70 °C under sterile conditions after reconstitution.
Calculators
Background: Myosin Heavy Chain
Alternate Names
Additional Myosin Heavy Chain Products
Product Documents for Myosin Heavy Chain Antibody (MF20)
Certificate of Analysis
To download a Certificate of Analysis, please enter a lot or batch number in the search box below.
Note: Certificate of Analysis not available for kit components.
Product Specific Notices for Myosin Heavy Chain Antibody (MF20)
For research use only
Related Research Areas
Citations for Myosin Heavy Chain Antibody (MF20)
 Powered by Bioz
Customer Reviews for Myosin Heavy Chain Antibody (MF20) (9)
Have you used Myosin Heavy Chain Antibody (MF20)?
Submit a review and receive an Amazon gift card!
$25/€18/£15/$25CAN/¥2500 Yen for a review with an image
$10/€7/£6/$10CAN/¥1110 Yen for a review without an image
Submit a review
Customer Images
-
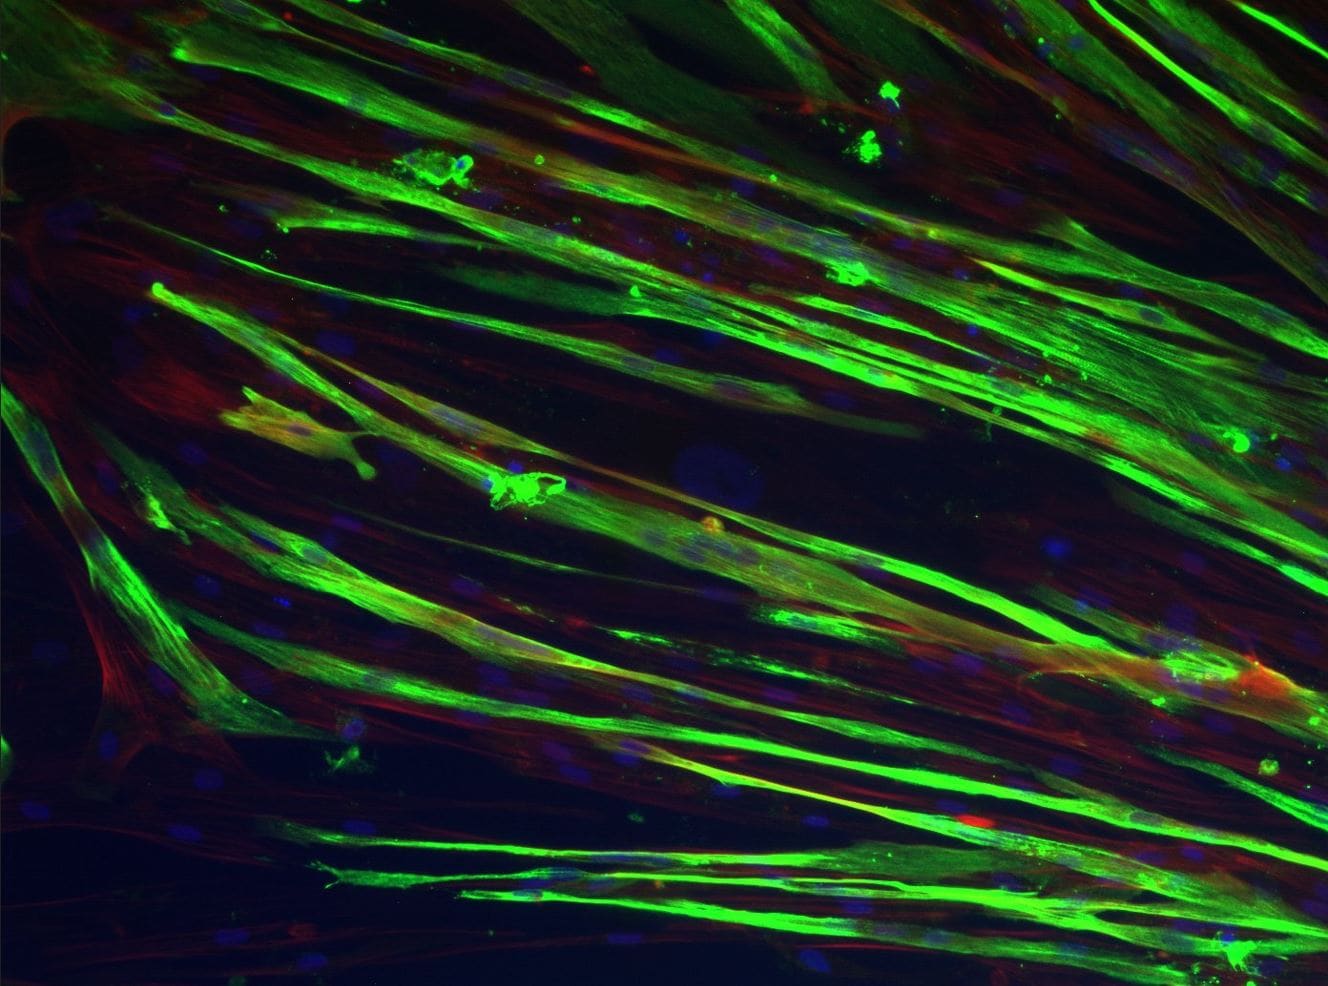
Application: ImmunocytochemistrySample Tested: Primary human myocytesSpecies: HumanVerified Customer | Posted 06/19/2023Myosin was stained with 0.5 mg/mL Myosin heavy chain antibody during 2 hours at room temperature. Green: Myosin Red: Phalloidin Blue: DAPI

-
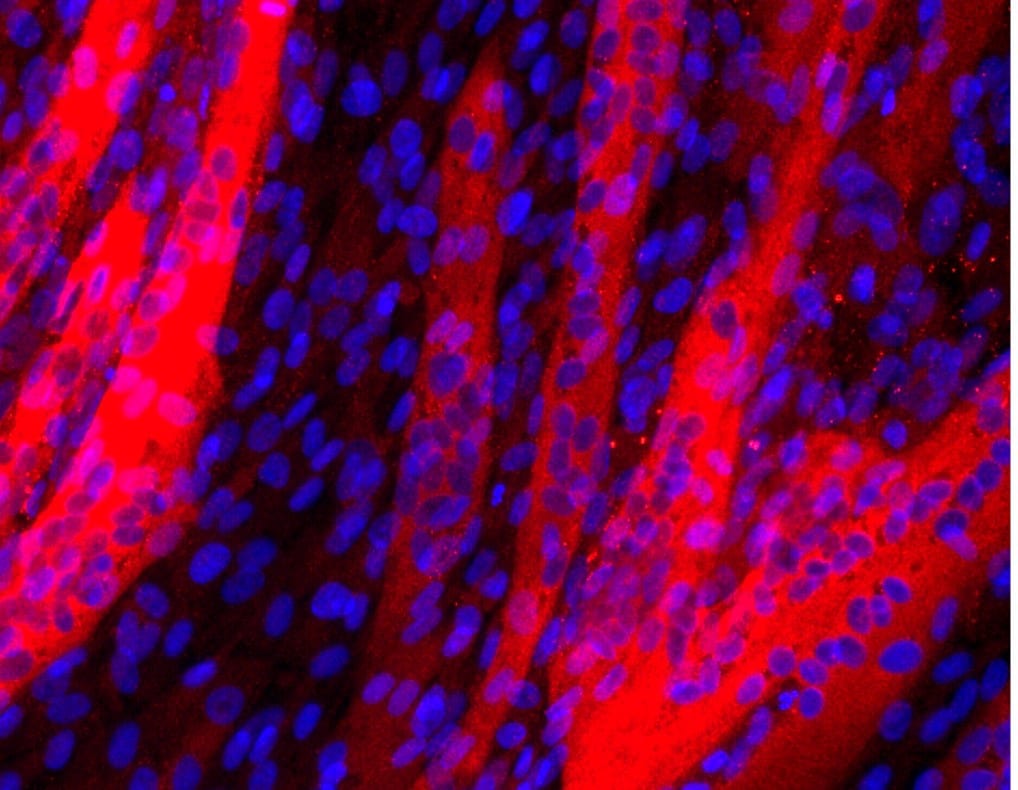
Application: Immunocytochemistry/ImmunofluorescenceSample Tested: Muscle tissueSpecies: HumanVerified Customer | Posted 03/29/2022
-
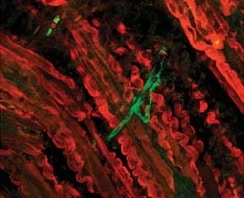
Application: ImmunohistochemistrySample Tested: Muscle tissueSpecies: MouseVerified Customer | Posted 08/02/2021Immunofluorescence, mouse muscle tissue. On the photo: Myosin Heavy Chain Antibody in red, GAP43 in green.
-
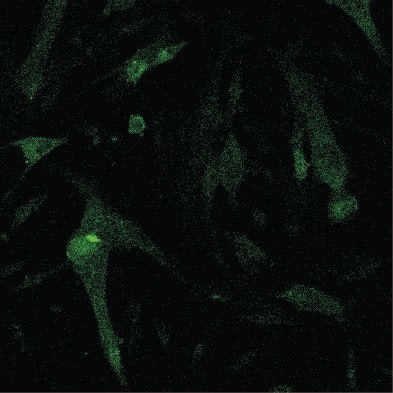
Application: Immunocytochemistry/ImmunofluorescenceSample Tested: MyotubesSpecies: horseVerified Customer | Posted 12/04/2020
-
Application: Immunocytochemistry/ImmunofluorescenceSample Tested: Skeletal muscleSpecies: MouseVerified Customer | Posted 10/29/2020
-
Application: ImmunohistochemistrySample Tested: Heart tissueSpecies: MouseVerified Customer | Posted 10/23/2020Heart tissue was fixed with paraformaldehyde and embedded with paraffin. The section was pre-treated with heart induced antigen retrieval and blocked with 10% goat serum and 3% BSA. Then the section was incubated with MAB4470 with a concentration of 10 ug/mL at 4C overnight and incubated with anti-mouse Alexa Fluo 488 secondary antiobody for 1 hour at room temperature. Nuclei were stained with DAPI.
-
Application: Western BlotSample Tested: C2C12 mouse myoblast cell line and Differentiated C2C12 myoblast cellsSpecies: MouseVerified Customer | Posted 06/06/2019
-
Application: Immunocytochemistry/ImmunofluorescenceSample Tested: Skeletal muscle tissueSpecies: HumanVerified Customer | Posted 05/10/2017
-
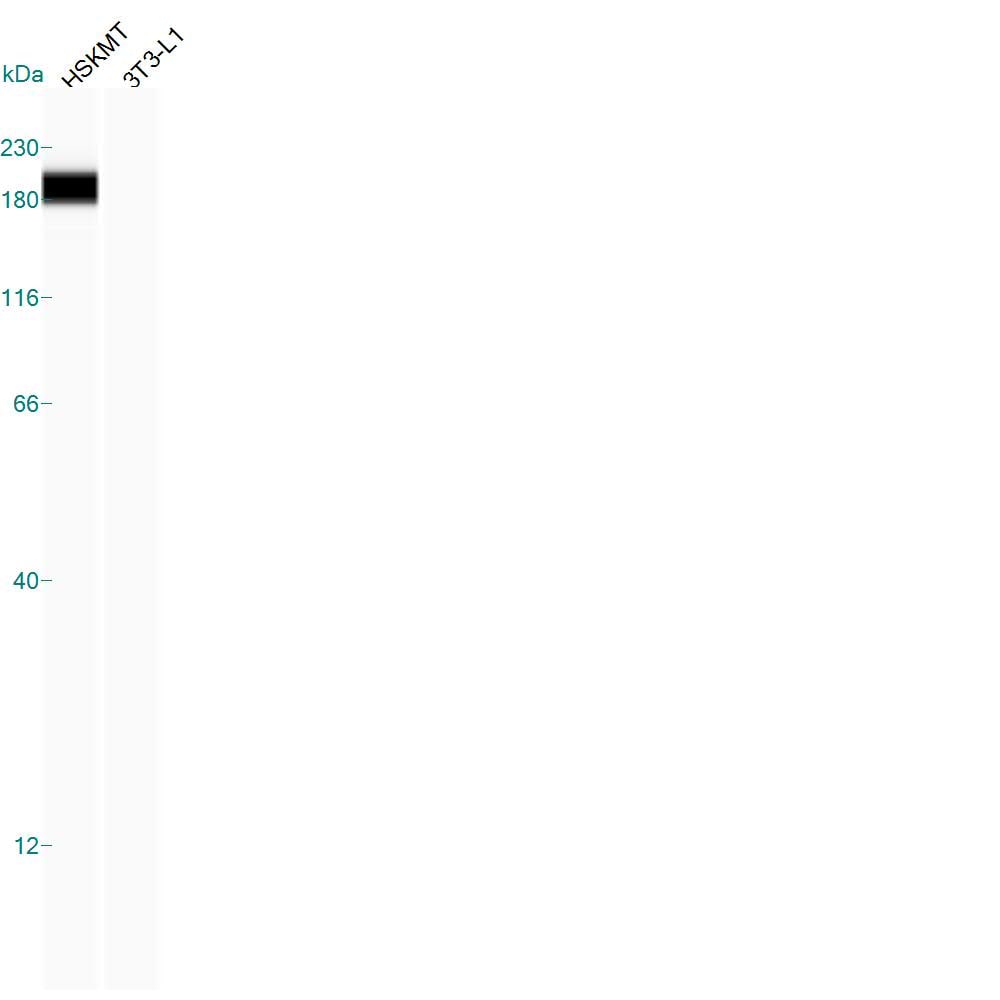
Application: Simple WesternSample Tested: Human Skeletal Muscle Lysate; 3T3-L1 cell lysateSpecies: HumanVerified Customer | Posted 02/25/2015Positive COntrol: Human Skeletal Muscle Tissue; negative control: 3T3-L1 Cell Lysate. Specific band at ~180-190 kDa.
There are no reviews that match your criteria.
Protocols
Find general support by application which include: protocols, troubleshooting, illustrated assays, videos and webinars.
- 7-Amino Actinomycin D (7-AAD) Cell Viability Flow Cytometry Protocol
- Antigen Retrieval Protocol (PIER)
- Antigen Retrieval for Frozen Sections Protocol
- Appropriate Fixation of IHC/ICC Samples
- Cellular Response to Hypoxia Protocols
- Chromogenic IHC Staining of Formalin-Fixed Paraffin-Embedded (FFPE) Tissue Protocol
- Chromogenic Immunohistochemistry Staining of Frozen Tissue
- ClariTSA™ Fluorophore Kits
- Detection & Visualization of Antibody Binding
- Extracellular Membrane Flow Cytometry Protocol
- Flow Cytometry Protocol for Cell Surface Markers
- Flow Cytometry Protocol for Staining Membrane Associated Proteins
- Flow Cytometry Staining Protocols
- Flow Cytometry Troubleshooting Guide
- Fluorescent IHC Staining of Frozen Tissue Protocol
- Graphic Protocol for Heat-induced Epitope Retrieval
- Graphic Protocol for the Preparation and Fluorescent IHC Staining of Frozen Tissue Sections
- Graphic Protocol for the Preparation and Fluorescent IHC Staining of Paraffin-embedded Tissue Sections
- Graphic Protocol for the Preparation of Gelatin-coated Slides for Histological Tissue Sections
- ICC Cell Smear Protocol for Suspension Cells
- ICC Immunocytochemistry Protocol Videos
- ICC for Adherent Cells
- IHC Sample Preparation (Frozen sections vs Paraffin)
- Immunocytochemistry (ICC) Protocol
- Immunocytochemistry Troubleshooting
- Immunofluorescence of Organoids Embedded in Cultrex Basement Membrane Extract
- Immunofluorescent IHC Staining of Formalin-Fixed Paraffin-Embedded (FFPE) Tissue Protocol
- Immunohistochemistry (IHC) and Immunocytochemistry (ICC) Protocols
- Immunohistochemistry Frozen Troubleshooting
- Immunohistochemistry Paraffin Troubleshooting
- Intracellular Flow Cytometry Protocol Using Alcohol (Methanol)
- Intracellular Flow Cytometry Protocol Using Detergents
- Intracellular Nuclear Staining Flow Cytometry Protocol Using Detergents
- Intracellular Staining Flow Cytometry Protocol Using Alcohol Permeabilization
- Intracellular Staining Flow Cytometry Protocol Using Detergents to Permeabilize Cells
- Preparing Samples for IHC/ICC Experiments
- Preventing Non-Specific Staining (Non-Specific Binding)
- Primary Antibody Selection & Optimization
- Propidium Iodide Cell Viability Flow Cytometry Protocol
- Protocol for Heat-Induced Epitope Retrieval (HIER)
- Protocol for Liperfluo
- Protocol for Making a 4% Formaldehyde Solution in PBS
- Protocol for VisUCyte™ HRP Polymer Detection Reagent
- Protocol for the Characterization of Human Th22 Cells
- Protocol for the Characterization of Human Th9 Cells
- Protocol for the Fluorescent ICC Staining of Cell Smears - Graphic
- Protocol for the Fluorescent ICC Staining of Cultured Cells on Coverslips - Graphic
- Protocol for the Preparation & Fixation of Cells on Coverslips
- Protocol for the Preparation and Chromogenic IHC Staining of Frozen Tissue Sections
- Protocol for the Preparation and Chromogenic IHC Staining of Frozen Tissue Sections - Graphic
- Protocol for the Preparation and Chromogenic IHC Staining of Paraffin-embedded Tissue Sections
- Protocol for the Preparation and Chromogenic IHC Staining of Paraffin-embedded Tissue Sections - Graphic
- Protocol for the Preparation and Fluorescent ICC Staining of Cells on Coverslips
- Protocol for the Preparation and Fluorescent ICC Staining of Non-adherent Cells
- Protocol for the Preparation and Fluorescent ICC Staining of Stem Cells on Coverslips
- Protocol for the Preparation and Fluorescent IHC Staining of Frozen Tissue Sections
- Protocol for the Preparation and Fluorescent IHC Staining of Paraffin-embedded Tissue Sections
- Protocol for the Preparation of Gelatin-coated Slides for Histological Tissue Sections
- Protocol for the Preparation of a Cell Smear for Non-adherent Cell ICC - Graphic
- Protocol: Annexin V and PI Staining by Flow Cytometry
- Protocol: Annexin V and PI Staining for Apoptosis by Flow Cytometry
- R&D Systems Quality Control Western Blot Protocol
- TUNEL and Active Caspase-3 Detection by IHC/ICC Protocol
- The Importance of IHC/ICC Controls
- Troubleshooting Guide: Fluorokine Flow Cytometry Kits
- Troubleshooting Guide: Immunohistochemistry
- Troubleshooting Guide: Western Blot Figures
- Western Blot Conditions
- Western Blot Protocol
- Western Blot Protocol for Cell Lysates
- Western Blot Troubleshooting
- Western Blot Troubleshooting Guide
- View all Protocols, Troubleshooting, Illustrated assays and Webinars
FAQs for Myosin Heavy Chain Antibody (MF20)
-
Q: Does Myosin Heavy Chain Antibody, Catalog # MAB4470, detect Myosin Heavy Chain in all mammalian species?
A: Myosin Heavy Chain is a highly conserved protein sequence. Although we have not tested every mammalian species, we expect it will bind to Myosin Heavy Chain in all mammalian species.
-
Q: What is the light chain for MAB4470?
A: The light chain of MAB4470 is kappa.
-
Q: Does Myosin Heavy Chain Antibody, Catalog # MAB4470, detect Myosin Heavy Chain in all mammalian species?
A: Myosin Heavy Chain is a highly conserved protein sequence. Although we have not tested every mammalian species, we expect it will bind to Myosin Heavy Chain in all mammalian species.
-
Q: What is the light chain for MAB4470?
A: The light chain of MAB4470 is kappa.