Myeloperoxidase/MPO Antibody
R&D Systems | Catalog # AF3667

Key Product Details
Validated by
Biological Validation
Species Reactivity
Validated:
Human, Mouse
Cited:
Human, Mouse, Rat, Hamster, Primate, Rabbit, Transgenic Mouse, Xenograft
Applications
Validated:
Immunohistochemistry, Western Blot, Dual RNAscope ISH-IHC Compatible, Immunocytochemistry, Simple Western
Cited:
Immunohistochemistry, Immunohistochemistry-Paraffin, Immunohistochemistry-Frozen, Western Blot, ELISA, Flow Cytometry, Immunocytochemistry, Immunocytochemistry/ Immunofluorescence, ELISA Capture, ELISA Development, Functional Assay
Label
Unconjugated
Antibody Source
Polyclonal Goat IgG
Loading...
Product Specifications
Immunogen
Mouse myeloma cell line NS0-derived recombinant mouse MPO
Met16-Thr718
Accession # P11247
Met16-Thr718
Accession # P11247
Specificity
Detects human and mouse Myeloperoxidase/MPO in Western blots. In direct ELISAs, less than 1% cross-reactivity with recombinant mouse EPPO is observed.
Clonality
Polyclonal
Host
Goat
Isotype
IgG
Scientific Data Images for Myeloperoxidase/MPO Antibody
Detection of Human/Mouse Myeloperoxidase/MPO by Western Blot.
Western blot shows lysates of HL-60 human acute promyelocytic leukemia cell line, human neutrophil cells, and mouse spleen tissue. PVDF membrane was probed with 0.5 µg/mL of Goat Anti-Human/Mouse Myeloperoxidase/MPO Antigen Affinity-purified Polyclonal Antibody (Catalog # AF3667) followed by HRP-conjugated Anti-Goat IgG Secondary Antibody (HAF019). A specific band was detected for Myeloperoxidase/MPO at approximately 60 kDa (as indicated). This experiment was conducted under reducing conditions and using Immunoblot Buffer Group 2.
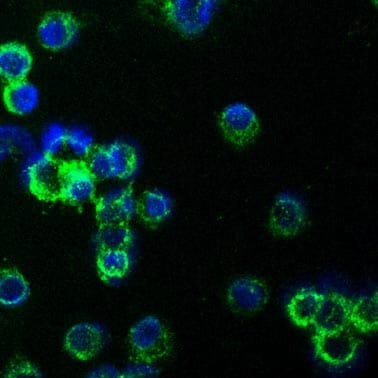
Myeloperoxidase/MPO in Mouse Splenocytes.
Myeloperoxidase/MPO was detected in immersion fixed mouse splenocytes using Goat Anti-Human/Mouse Myeloperoxidase/MPO Antigen Affinity-purified Polyclonal Antibody (Catalog # AF3667) at 15 µg/mL for 3 hours at room temperature. Cells were stained using the NorthernLights™ 557-conjugated Anti-Goat IgG Secondary Antibody (red; NL001) and counterstained with DAPI (blue). Specific staining was localized to cytoplasm. View our protocol for Fluorescent ICC Staining of Non-adherent Cells.For human Immunocytochemistry samples, we recommend Mouse Anti-Human Myeloperoxidase/ MPO Monoclonal Antibody (MAB3174).
Myeloperoxidase/MPO in Mouse Spleen Tissue.
Myeloperoxidase/MPO was detected in immersion fixed paraffin-embedded sections of mouse spleen tissue using Goat Anti-Human/Mouse Myeloperoxidase/MPO Antigen Affinity-purified Polyclonal Antibody (Catalog # AF3667) at 1 µg/mL for 1 hour at room temperature followed by incubation with the Anti-Goat IgG VisUCyte™ HRP Polymer Antibody (VC004). Tissue was stained using DAB (brown) and counterstained with hematoxylin (blue). Specific staining was localized to lymphocytes. Staining was performed using our IHC Staining with VisUCyte HRP Polymer Detection Reagents.For human Immunohistochemistry samples, we recommend Mouse Anti-Human Myeloperoxidase/ MPO Monoclonal Antibody (MAB3174).
Detection of Mouse Myeloperoxidase/MPO by Simple WesternTM.
Simple Western lane view shows lysates of mouse spleen tissue, loaded at 0.2 mg/mL. A specific band was detected for Myeloperoxidase/MPO at approximately 67 kDa (as indicated) using 5 µg/mL of Goat Anti-Human/Mouse Myeloperoxidase/MPO Antigen Affinity-purified Polyclonal Antibody (Catalog # AF3667) followed by 1:50 dilution of HRP-conjugated Anti-Goat IgG Secondary Antibody (HAF109). This experiment was conducted under reducing conditions and using the 12-230 kDa separation system.
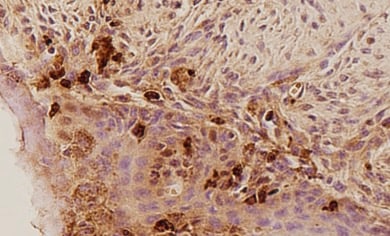
Detection of Human Myeloperoxidase/MPO by Immunohistochemistry
SAA levels positively correlate with tumour-associated neutrophil infiltration. (A) Representative images of MPO-positive neutrophils in a lung adenocarcinoma tumour section (original magnification ×200). (B) Neutrophils are significantly elevated in tumours compared to control tissue biopsies, which was confirmed by (C) paired analysis of tumour and adjacent control lung tissue. (D) Circulating SAA levels were elevated in lung adenocarcinoma patients as determined by ELISA. (E) SAA transcript levels were not increased in tumours as measured by RTqPCR and confirmed by (F) sub-analysis of the paired from the tumour and adjacent control tissue samples. (G) Tissue sections were stained for SAA, which identified positive staining within seromucinous glands and tumour-associated macrophages (original magnification ×200). (H) Spearman correlation was used to assess associations between SAA transcript levels and tumour infiltrating neutrophil density (r = 0.51, *** p < 0.001). **** p < 0.0001, ** p < 0.01, ## p < 0.01. Image collected and cropped by CiteAb from the following publication (https://pubmed.ncbi.nlm.nih.gov/34203378), licensed under a CC-BY license. Not internally tested by R&D Systems.
Detection of Mouse Myeloperoxidase/MPO by Immunocytochemistry/Immunofluorescence
Epicutaneous lugdunin recruits phagocytic cells. a Schematic overview of the mouse experiments: 6–8-week-old female C5BL/6 wild-type (WT), MyD88-ko, or 5xTLR-ko mice were epicutaneously treated with 1.5 µg lugdunin or phosphate-buffered saline (PBS) as a control. After 24 h, mice were euthanized, immune cells were isolated from treated skin areas, and immune cell composition was analyzed by flow cytometry. b Shown is the mean percentage of CD45+ live cells in mouse skin of 10 C57BL/6 WT mice ± s.e.m. One mouse is represented as two dots analyzed by two different stainings. c Pie charts show the mean percentage of the different immune cell subsets in the skin of 10 WT mice after 24 h of PBS or lugdunin treatment. d Shown are representative flow cytometry data (left panel) and the mean percentage of neutrophils (Ly6C+Ly6G+) and monocytes (Ly6C+Ly6G−) pregated on CD11b+CD45+ live cells (see Supplementary Fig. 3a, f for the gating strategy) in mouse skin ± s.e.m. One dot represents one mouse. *P < 0.05. e Representative myeloperoxidase (MPO)-stained paraffin-embedded mouse skin sections. Scale bar, 100 µM. Source data are provided as a Source Data file Image collected and cropped by CiteAb from the following publication (https://pubmed.ncbi.nlm.nih.gov/31227691), licensed under a CC-BY license. Not internally tested by R&D Systems.
Detection of Mouse Myeloperoxidase/MPO by Western Blot
Levels of CTGF, TGF-beta, MPO, and VEGF in silicone implant-induced capsular tissues determined by western blotting (a). A low signal was obtained for CTGF (b) and TGF-beta (c) protein in PN-KO mice (n = 6), whereas a strong signal was detected in the C57BL/6 mice (n = 6). Compared with the control group (n = 6), the levels of MPO (d) and VEGF (e) protein were downregulated in the PN-KO group (n = 6). Relative expression levels normalized to the housekeeping gene beta -actin. ∗∗p < 0.001. Image collected and cropped by CiteAb from the following publication (https://pubmed.ncbi.nlm.nih.gov/29854742), licensed under a CC-BY license. Not internally tested by R&D Systems.
Detection of Mouse Myeloperoxidase/MPO by Western Blot
LCN2 mAb limited blood–brain barrier leakage and infiltration of neutrophils after tMCAo. Representative images (A) and quantification (B) of Evans blue extravasation in the ipsilateral hemispheres of mice treated with control IgG (con) and LCN2 mAb (n = 5 per group) after one hour of tMCAo and 23 h after reperfusion. The concentration of Evans blue dye in the ipsilateral hemispheres of mice treated with LCN2 mAb was significantly decreased (** p < 0.01) as compared with that in the ipsilateral hemispheres of mice treated with control IgG (two-tailed, unpaired t test); (C) The expression level of the tight junction protein claudin-5 was analyzed after treatments with control IgG and LCN2 mAb (n = 4 per group). The ipsilateral (i) and contralateral (c) hemispheres isolated at 23 h after tMCAo were analyzed by Western blotting using antibodies against claudin-5. Representative Western blot showing the expression of claudin-5 (~22 kDa) in brain homogenates. beta -actin served as a loading control; (D) The level of claudin-5 immunoreactivity normalized to beta -actin (claudin-5/actin) in the ipsilateral hemispheres in mice treated with LCN2 mAb was significantly higher than that in the ipsilateral hemispheres of mice that received the control IgG (* p < 0.05, one-tailed, unpaired t test); (E,F) Neutrophil infiltration was analyzed by measuring the levels of MPO in brain homogenates. The ipsilateral (i) and contralateral (c) hemispheres of mice treated with control IgG (con) and LCN2 mAb (n = 4 per group) isolated at 23 h after tMCAo were analyzed by Western blotting using antibodies against MPO; (E) Representative Western blots show the expression of MPO heavy chain (~55 kD) in brain homogenates; (F) The level of MPO immunoreactivity normalized to beta -actin (MPO/actin) was significantly reduced in the ipsilateral hemispheres of mice treated with LCN2 mAb (* p < 0.05, one-tailed, unpaired t test) as compared with that in the ipsilateral hemisphere of mice that received control IgG
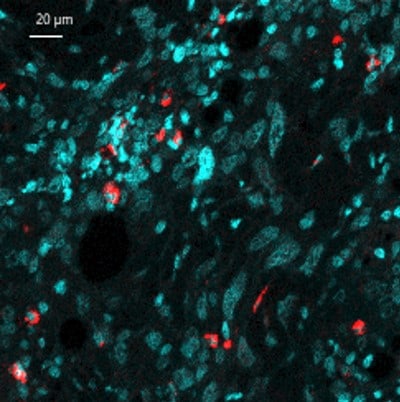
Detection of Myeloperoxidase/MPO in Mouse Spleen.
Formalin-fixed paraffin-embedded tissue sections of mouse spleen were probed for MPO mRNA (ACD RNAScope Probe, catalog #603091; Fast Red chromogen, ACD catalog # 322750). Adjacent tissue section was processed for immunohistochemistry using goat anti-mouse MPO polyclonal antibody (R&D Systems catalog # AF3667) at 1ug/mL with overnight incubation at 4 degrees Celsius followed by incubation with anti-goat IgG VisUCyte HRP Polymer Antibody (Catalog # VC004) and DAB chromogen (yellow-brown). Tissue was counterstained with hematoxylin (blue). Specific staining was localized to cell surface.
Detection of Human Human/Mouse Myeloperoxidase/MPO Antibody by Immunohistochemistry
Immunofluorescence staining reveals that flagellum-deficiency abolishes P. aeruginosa-induced NET formation.Human PMNs were exposed to wild-type (WT) or flagellum-deficient strains of P. aeruginosa PAK flgC and PAO1 fliC, and NET release was documented. (A) Immunofluorescence staining of myeloperoxidase (MPO, green), citrullinated histone H4 (citH4, red), extracellular DNA (DAPI, blue) and their merged images are shown. Representative results, n = 3. (B) Quantitation of immunofluorescence images shown in panel (A). Based on nuclear morphology and co-staining with MPO and citH4, NET-forming PMNs were identified and their numbers quantitated compared to the total cell population (expressed as percentage of total). Mean+/-S.E.M., n = 3. One-way ANOVA, Tukey’s post hoc test. *, p<0.05; **, p<0.01. Nonstim., nonstimulated; WT, wild-type. Image collected and cropped by CiteAb from the following publication (https://pubmed.ncbi.nlm.nih.gov/27855208), licensed under a CC-BY license. Not internally tested by R&D Systems.
Detection of Human Myeloperoxidase/MPO by Immunohistochemistry
Postoperative AIC stimulates NETs release both in peripheral blood and abdominal infectious site.A Left panel: representative immunofluorescence co-staining of DNA (Hochest and Sytox), Cit-H3 (citrullinated histone-3) and MPO (myeloperoxidase) to assess NETs formation in the neutrophils isolated from peripheral blood of control, Non-AIC, AIC and AIC + DNase I groups; Right panel: plasma and serum levels of MPO–DNA in GC patients with control, Non-AIC and AIC; B Preoperative and postoperative serum MPO–DNA levels between Non-AIC and AIC groups; C Representative SEM (scan electron microscopy) of neutrophils isolated from preoperative and postoperative ascites fluid between Non-AIC and AIC groups. Green arrows point to extracellular meshes of NETs and white arrows point to neutrophils; D Preoperative and postoperative ascites fluid MPO–DNA levels between Non-AIC and AIC groups; E Representative images of HE and immunofluorescence staining of DNA, Cit-H3, and MPO in omental tissues among AIC, Non-AIC, and control groups; F Quantification of NETs in omental tissues among AIC, Non-AIC, and control groups. Data represent the mean ± S.D. in A, F (n = 10 per group); one-way ANOVA with Tukey test was used in A, F; paired and unpaired Student’s t-tests were used in B, D (n = 10 per group). Source data are provided as a Source Data file. Image collected and cropped by CiteAb from the following open publication (https://pubmed.ncbi.nlm.nih.gov/35197446), licensed under a CC-BY license. Not internally tested by R&D Systems.
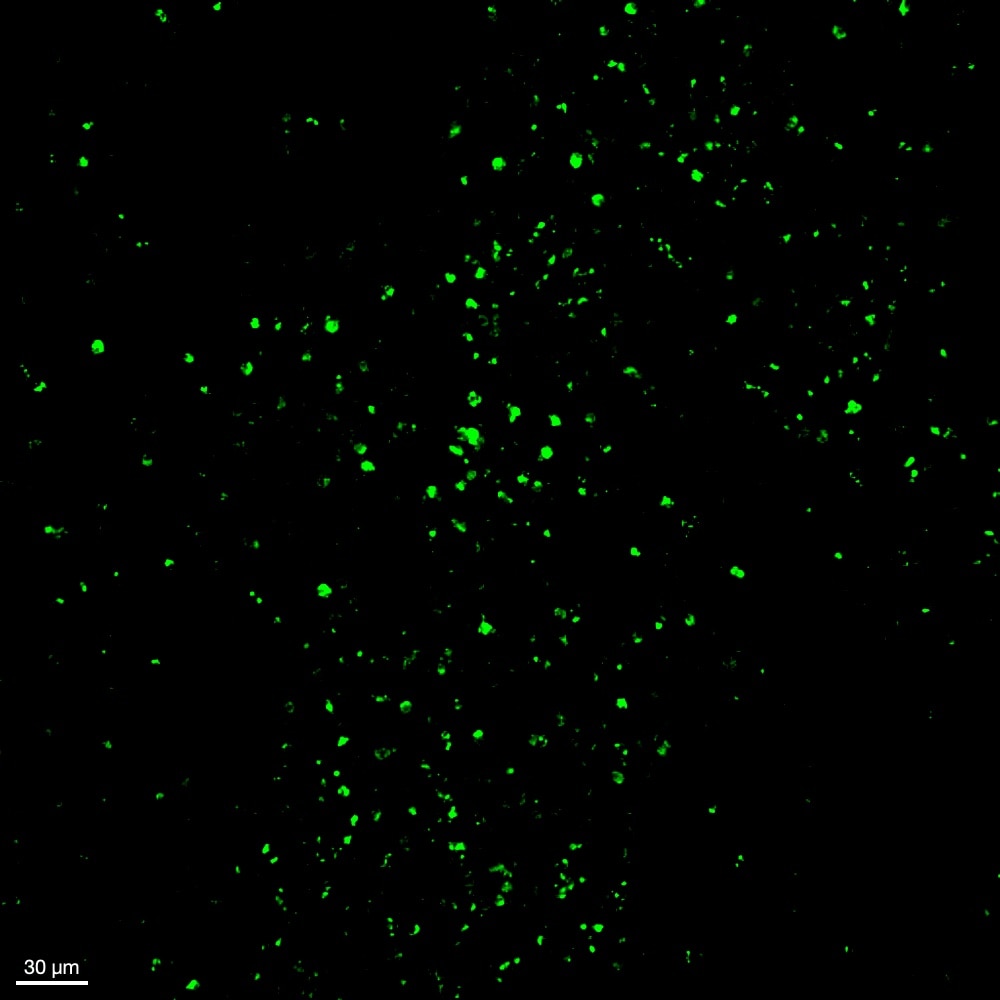
Detection of Rat Myeloperoxidase/MPO by Immunohistochemistry
CXCR4 expressed at neutrophils mediates NET formation in rats. (D) Representative images of immunolabeling with CitH3, MPO,&DAPI at 20 mm distal to the injury site 12 h after injury. Dashed lines indicate the border of the epineurium&the parenchyma. * are high-magnification images of boxed areas in the epineurium. Arrows indicate triple immunolabeled NETs. Scale bar: 10 μm. Image collected & cropped by CiteAb from the following open publication (https://pubmed.ncbi.nlm.nih.gov/35961782), licensed under a CC-BY license. Not internally tested by R&D Systems.
Detection of Rat Myeloperoxidase/MPO by Immunohistochemistry
Migration inhibitory factor (MIF) secreted from neutrophils promotes NET formation in rats. (D) Representative images of immunolabeling with CitH3, MPO,&DAPI at 20 mm distal to the injury site 12 h after injury. Dashed lines indicate the border of the epineurium&the parenchyma. Images marked with * are high-magnification images of boxed areas in the epineurium. Arrows indicate triple immunolabeled NETs. Treatment with iso-1 dramatically inhibited NET formation. Scale bar: 10 μm. Image collected & cropped by CiteAb from the following open publication (https://pubmed.ncbi.nlm.nih.gov/35961782), licensed under a CC-BY license. Not internally tested by R&D Systems.
Detection of Rat Myeloperoxidase/MPO by Immunohistochemistry
Inhibition of NET formation promotes the macrophage infiltration from the epineurium into the parenchyma in rats. (C) Representative images of immunolabeling with CitH3, MPO,&DAPI at 20 mm distal to the injury site. Dashed lines indicate the border of the epineurium&the parenchyma. Images marked with * are high-magnification views of the boxed areas at the epineurium. Arrows indicate neutrophils releasing NETs. Treatment with Cl-amidine or DNase I inhibited NET formation. Scale bars: 100&10 μm in low-&high-magnification images, respectively. Image collected & cropped by CiteAb from the following open publication (https://pubmed.ncbi.nlm.nih.gov/35961782), licensed under a CC-BY license. Not internally tested by R&D Systems.
Detection of Myeloperoxidase/MPO by Western Blot
DNase I or CI-amidine administration reduced airway hyperresponsiveness and alleviated airway inflammation (A) Experimental assay schematic for in vivo experiments. (B) AHR was measured 24 h after the last challenge, enhanced pause (Penh) values were used as an indicator of lung function. (C) Hematoxylin and eosin (H&E) staining of lung tissue. Scale bar = 50 μm. (D) Paraffin acid-Schiff (PAS) staining of lung. Scale bar = 20 μm. (E) Quantification of inflammation infiltration score of the H&E staining. (F) Quantification of mucus-producing goblet cells of the PAS staining. (G) The total number of cells and the differential number of cells (eosinophils and neutrophils) were quantified 48 h after the last challenge in the BALF. (H, I) Western blot analysis to measure MPO and CitH3 protein expression level in lung tissue of four groups of mice. Expression is relative to beta -Tubulin. Cropped blots are shown, and supplementary Fig. S3 and S6 presents the full-length blots. Data were shown as mean ± SEM; n = 4–6. Significance between groups was calculated using one-way ANOVA with Tukey’s post hoc method. *p < 0.05, **p < 0.01 and ***p < 0.001 Image collected and cropped by CiteAb from the following open publication (https://pubmed.ncbi.nlm.nih.gov/36271366), licensed under a CC-BY license. Not internally tested by R&D Systems.
Detection of Myeloperoxidase/MPO by Western Blot
Neutrophilic mouse model induced by CFA combined with LPS showed enhanced NETs formation capacity. (A) At 48 h after the last challenge, the percentage of neutrophil populations in CD45(+) leukocytes in mouse peripheral blood and bone marrow were determined by flow cytometry. The representative images in each group are shown. (B) Statistical analysis of the percentage of CD11b(+)Ly6G(+) neutrophils in CD45(+) leukocyte gate of mouse peripheral blood and bone marrow by flow cytometry. (C) Neutrophils were purified from mouse bone marrow and stimulated with PMA (100 nM) or vehicle control for 4 h. Then, neutrophils were stained for myeloperoxidase (MPO, red), citrullinated histone 3 (CitH3, green), and DNA (DAPI, blue) and confocal by immunofluorescence microscope for analysis. Representative images of NETs immunofluorescence. Scale bar = 20 μm. (D) Percentage of NETs area normalized to MPO positive signal in mouse bone marrow neutrophils after PMA stimulation. (E) Representative z-axis images of the NETs immunofluorescence in 0.1LPS + CFA group. Scale bar = 10 μm. (F, G) Western blot analysis the protein expression level of MPO and CitH3 in lung tissue of four groups of mice. Expression is relative to beta -Tubulin. Cropped blots are shown, and supplementary Fig. S2 and S5 presents the full-length blots. Data were shown as mean ± SEM; n = 4 or 6. Significance between groups was calculated using one-way ANOVA with Tukey’s post hoc method. *p < 0.05, **p < 0.01 and ***p < 0.001 Image collected and cropped by CiteAb from the following open publication (https://pubmed.ncbi.nlm.nih.gov/36271366), licensed under a CC-BY license. Not internally tested by R&D Systems.
Detection of Myeloperoxidase/MPO by Western Blot
Abundant NETs occur in neutrophilic asthma models. (A) Neutrophil expression in CD45(+) leucocytes in mouse peripheral blood and bone marrow were determined by flow cytometry within 48 h after the last challenge. The representative images in each group are shown. (B) Quantification: the percentage of CD11b(+)Ly6G(+) neutrophils in the CD45(+) leucocytes gate of mouse peripheral blood and bone marrow by flow cytometry. (C) In vitro NET-formation assays with purified neutrophils of mouse bone marrow neutrophils stimulated with PMA (100 nM) or RPMI 1640 for 4 h. Then the neutrophils were stained PI and analyzed by immunofluorescence confocal microscopy. Representative immunofluorescence images of NETs, Scale bar = 20 μm. (D) Comparison of the percentage of NETosis cells in each group upon PMA stimulation and control (Ctrl) stimulation. (E) After stimulated with PMA, the neutrophils were stained for myeloperoxidase (MPO, red), citrullinated histone 3 (CitH3, green) and DAPI (nuclear staining, blue) and analyzed by immunofluorescence confocal microscopy. Representative immunofluorescence images of NETs, Scale bar = 20 μm. (F) Percentage of NETs area normalized to MPO positive signal in mouse bone marrow neutrophils after PMA stimulation. (G, H) Western blot was used to detect the levels of MPO and CitH3 protein in lung tissue of five groups of mice. Expression is relative to beta -Tubulin. Cropped blots are shown, and supplementary Fig. S1 and S4 presents the full-length blots. Data were shown as mean ± SEM; n = 4. Significance between groups was calculated using one-way ANOVA with Tukey’s post hoc method. *p < 0.05, **p < 0.01 and ***p < 0.001 Image collected and cropped by CiteAb from the following open publication (https://pubmed.ncbi.nlm.nih.gov/36271366), licensed under a CC-BY license. Not internally tested by R&D Systems.
Detection of Myeloperoxidase/MPO by Western Blot
Neutrophilic mouse model induced by CFA combined with LPS showed enhanced NETs formation capacity. (A) At 48 h after the last challenge, the percentage of neutrophil populations in CD45(+) leukocytes in mouse peripheral blood and bone marrow were determined by flow cytometry. The representative images in each group are shown. (B) Statistical analysis of the percentage of CD11b(+)Ly6G(+) neutrophils in CD45(+) leukocyte gate of mouse peripheral blood and bone marrow by flow cytometry. (C) Neutrophils were purified from mouse bone marrow and stimulated with PMA (100 nM) or vehicle control for 4 h. Then, neutrophils were stained for myeloperoxidase (MPO, red), citrullinated histone 3 (CitH3, green), and DNA (DAPI, blue) and confocal by immunofluorescence microscope for analysis. Representative images of NETs immunofluorescence. Scale bar = 20 μm. (D) Percentage of NETs area normalized to MPO positive signal in mouse bone marrow neutrophils after PMA stimulation. (E) Representative z-axis images of the NETs immunofluorescence in 0.1LPS + CFA group. Scale bar = 10 μm. (F, G) Western blot analysis the protein expression level of MPO and CitH3 in lung tissue of four groups of mice. Expression is relative to beta -Tubulin. Cropped blots are shown, and supplementary Fig. S2 and S5 presents the full-length blots. Data were shown as mean ± SEM; n = 4 or 6. Significance between groups was calculated using one-way ANOVA with Tukey’s post hoc method. *p < 0.05, **p < 0.01 and ***p < 0.001 Image collected and cropped by CiteAb from the following open publication (https://pubmed.ncbi.nlm.nih.gov/36271366), licensed under a CC-BY license. Not internally tested by R&D Systems.
Detection of Myeloperoxidase/MPO by Western Blot
Abundant NETs occur in neutrophilic asthma models. (A) Neutrophil expression in CD45(+) leucocytes in mouse peripheral blood and bone marrow were determined by flow cytometry within 48 h after the last challenge. The representative images in each group are shown. (B) Quantification: the percentage of CD11b(+)Ly6G(+) neutrophils in the CD45(+) leucocytes gate of mouse peripheral blood and bone marrow by flow cytometry. (C) In vitro NET-formation assays with purified neutrophils of mouse bone marrow neutrophils stimulated with PMA (100 nM) or RPMI 1640 for 4 h. Then the neutrophils were stained PI and analyzed by immunofluorescence confocal microscopy. Representative immunofluorescence images of NETs, Scale bar = 20 μm. (D) Comparison of the percentage of NETosis cells in each group upon PMA stimulation and control (Ctrl) stimulation. (E) After stimulated with PMA, the neutrophils were stained for myeloperoxidase (MPO, red), citrullinated histone 3 (CitH3, green) and DAPI (nuclear staining, blue) and analyzed by immunofluorescence confocal microscopy. Representative immunofluorescence images of NETs, Scale bar = 20 μm. (F) Percentage of NETs area normalized to MPO positive signal in mouse bone marrow neutrophils after PMA stimulation. (G, H) Western blot was used to detect the levels of MPO and CitH3 protein in lung tissue of five groups of mice. Expression is relative to beta -Tubulin. Cropped blots are shown, and supplementary Fig. S1 and S4 presents the full-length blots. Data were shown as mean ± SEM; n = 4. Significance between groups was calculated using one-way ANOVA with Tukey’s post hoc method. *p < 0.05, **p < 0.01 and ***p < 0.001 Image collected and cropped by CiteAb from the following open publication (https://pubmed.ncbi.nlm.nih.gov/36271366), licensed under a CC-BY license. Not internally tested by R&D Systems.Applications for Myeloperoxidase/MPO Antibody
Application
Recommended Usage
Dual RNAscope ISH-IHC Compatible
5-15 µg/mL
Sample: Immersion fixed paraffin-embedded sections of mouse spleen
Sample: Immersion fixed paraffin-embedded sections of mouse spleen
Immunocytochemistry
5-15 µg/mL
Sample: Immersion fixed mouse splenocytes
For human Immunocytochemistry samples, we recommend Mouse Anti-Human Myeloperoxidase/ MPO Monoclonal Antibody (Catalog # MAB3174)
Sample: Immersion fixed mouse splenocytes
For human Immunocytochemistry samples, we recommend Mouse Anti-Human Myeloperoxidase/ MPO Monoclonal Antibody (Catalog # MAB3174)
Immunohistochemistry
1-15 µg/mL
Sample: Immersion fixed paraffin-embedded sections of mouse spleen tissue subjected to Antigen Retrieval Reagent-Basic (Catalog # CTS013)
For human Immunohistochemistry samples, we recommend Mouse Anti-Human Myeloperoxidase/ MPO Monoclonal Antibody (Catalog # MAB3174)
Sample: Immersion fixed paraffin-embedded sections of mouse spleen tissue subjected to Antigen Retrieval Reagent-Basic (Catalog # CTS013)
For human Immunohistochemistry samples, we recommend Mouse Anti-Human Myeloperoxidase/ MPO Monoclonal Antibody (Catalog # MAB3174)
Simple Western
5 µg/mL
Sample: Mouse spleen tissue
Sample: Mouse spleen tissue
Western Blot
0.5 µg/mL
Sample: HL‑60 human acute promyelocytic leukemia cell line, human neutrophil cells, and mouse spleen tissue
Sample: HL‑60 human acute promyelocytic leukemia cell line, human neutrophil cells, and mouse spleen tissue
Reviewed Applications
Read 7 reviews rated 4.9 using AF3667 in the following applications:
Formulation, Preparation, and Storage
Purification
Antigen Affinity-purified
Reconstitution
Reconstitute at 0.2 mg/mL in sterile PBS. For liquid material, refer to CoA for concentration.
Loading...
Formulation
Lyophilized from a 0.2 μm filtered solution in PBS with Trehalose. See Certificate of Analysis for details.
*Small pack size (-SP) is supplied either lyophilized or as a 0.2 µm filtered solution in PBS.
*Small pack size (-SP) is supplied either lyophilized or as a 0.2 µm filtered solution in PBS.
Shipping
Lyophilized product is shipped at ambient temperature. Liquid small pack size (-SP) is shipped with polar packs. Upon receipt, store immediately at the temperature recommended below.
Stability & Storage
Use a manual defrost freezer and avoid repeated freeze-thaw cycles.
- 12 months from date of receipt, -20 to -70 °C as supplied.
- 1 month, 2 to 8 °C under sterile conditions after reconstitution.
- 6 months, -20 to -70 °C under sterile conditions after reconstitution.
Calculators
Background: Myeloperoxidase/MPO
Alternate Names
MPO
Gene Symbol
MPO
UniProt
Additional Myeloperoxidase/MPO Products
Product Documents for Myeloperoxidase/MPO Antibody
Certificate of Analysis
To download a Certificate of Analysis, please enter a lot or batch number in the search box below.
Note: Certificate of Analysis not available for kit components.
Product Specific Notices for Myeloperoxidase/MPO Antibody
For research use only
Related Research Areas
Citations for Myeloperoxidase/MPO Antibody
 Powered by Bioz
Customer Reviews for Myeloperoxidase/MPO Antibody (7)
4.9 out of 5
7 Customer Ratings
Have you used Myeloperoxidase/MPO Antibody?
Submit a review and receive an Amazon gift card!
$25/€18/£15/$25CAN/¥2500 Yen for a review with an image
$10/€7/£6/$10CAN/¥1110 Yen for a review without an image
Submit a review
Customer Images
Showing
1
-
5 of
7 reviews
Showing All
Filter By:
-
Application: Immunocytochemistry/ImmunofluorescenceSample Tested: Spleen tissueSpecies: MouseVerified Customer | Posted 01/24/2023

-
Application: ImmunohistochemistrySample Tested: EpitheliumSpecies: MouseVerified Customer | Posted 06/27/2021
-
Application: Imaging Mass CytometrySample Tested: FFPESpecies: HumanVerified Customer | Posted 10/05/2020Mass Cytometry - Image of human cutaneous squamous cell carcinoma tumor stained with Anti-Myeloperoxydase antibody [polyclonal] (in red).
-
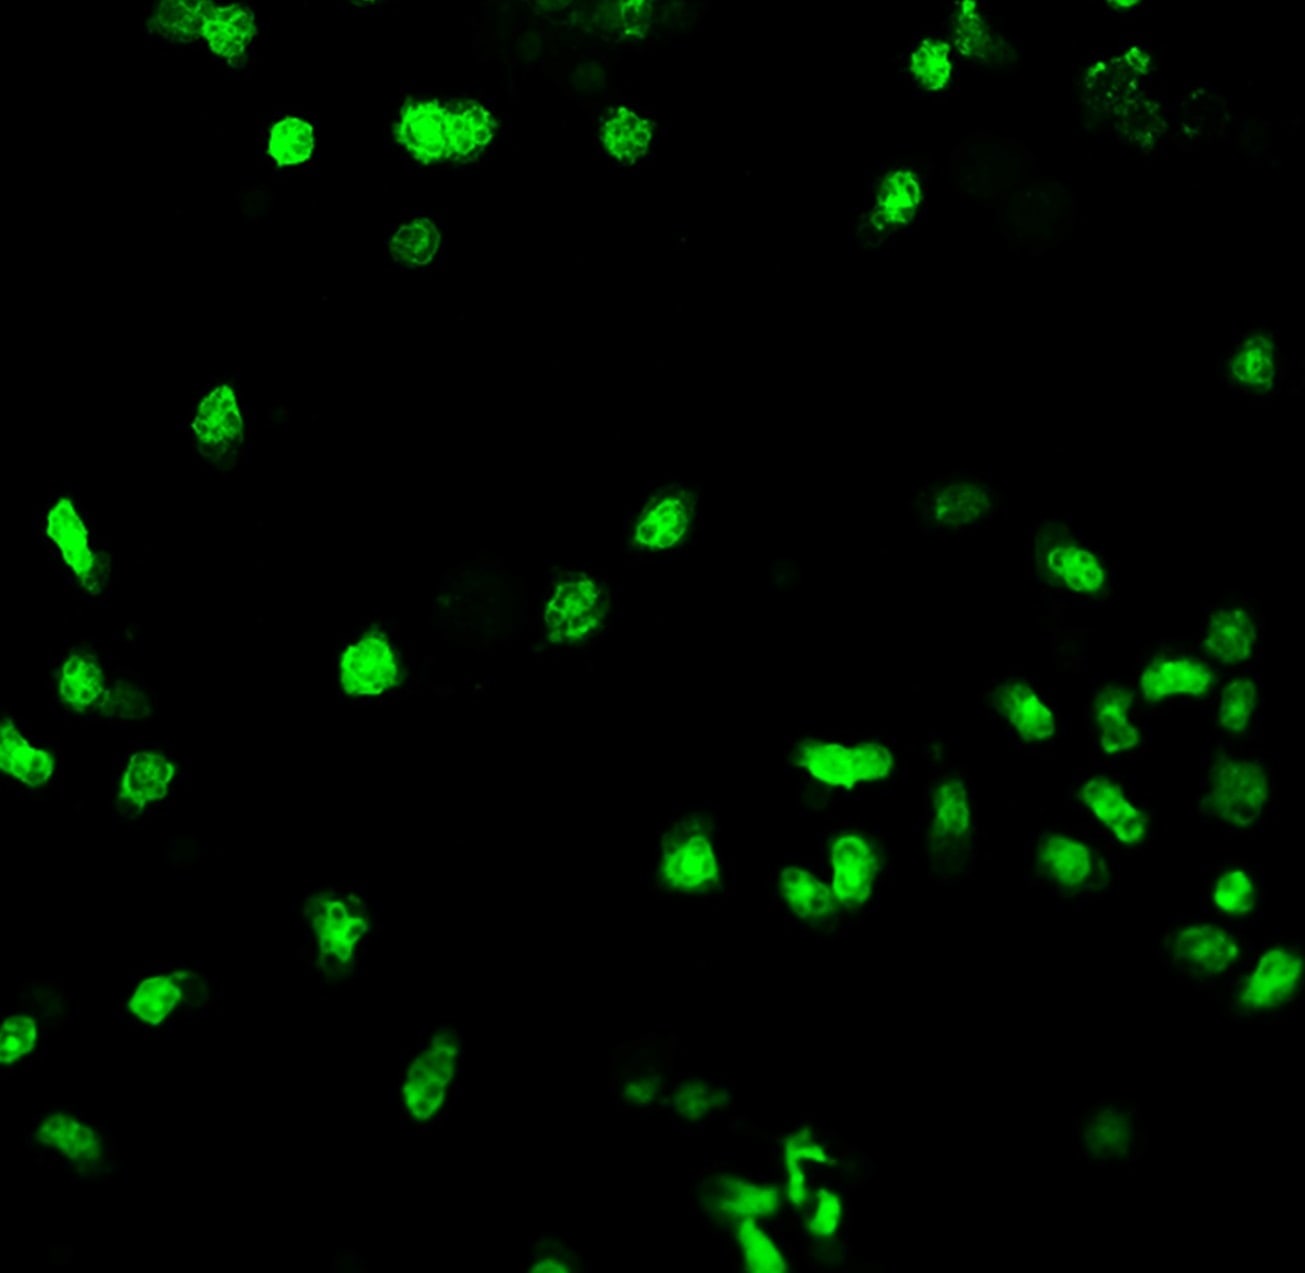
Application: Immunocytochemistry/ImmunofluorescenceSample Tested: Peritoneal macrophagesSpecies: MouseVerified Customer | Posted 07/27/2019DAPI-blue MPO-green
-
Application: Immunofluorescence - paraffinSample Tested: human tonsilSpecies: HumanVerified Customer | Posted 04/12/2019FFPE human tonsil, MPO polyclonal, 1:100pH9 antigen retrieval
-
Application: Immunocytochemistry/ImmunofluorescenceSample Tested: Bone marrow cellsSpecies: MouseVerified Customer | Posted 09/30/2018
-
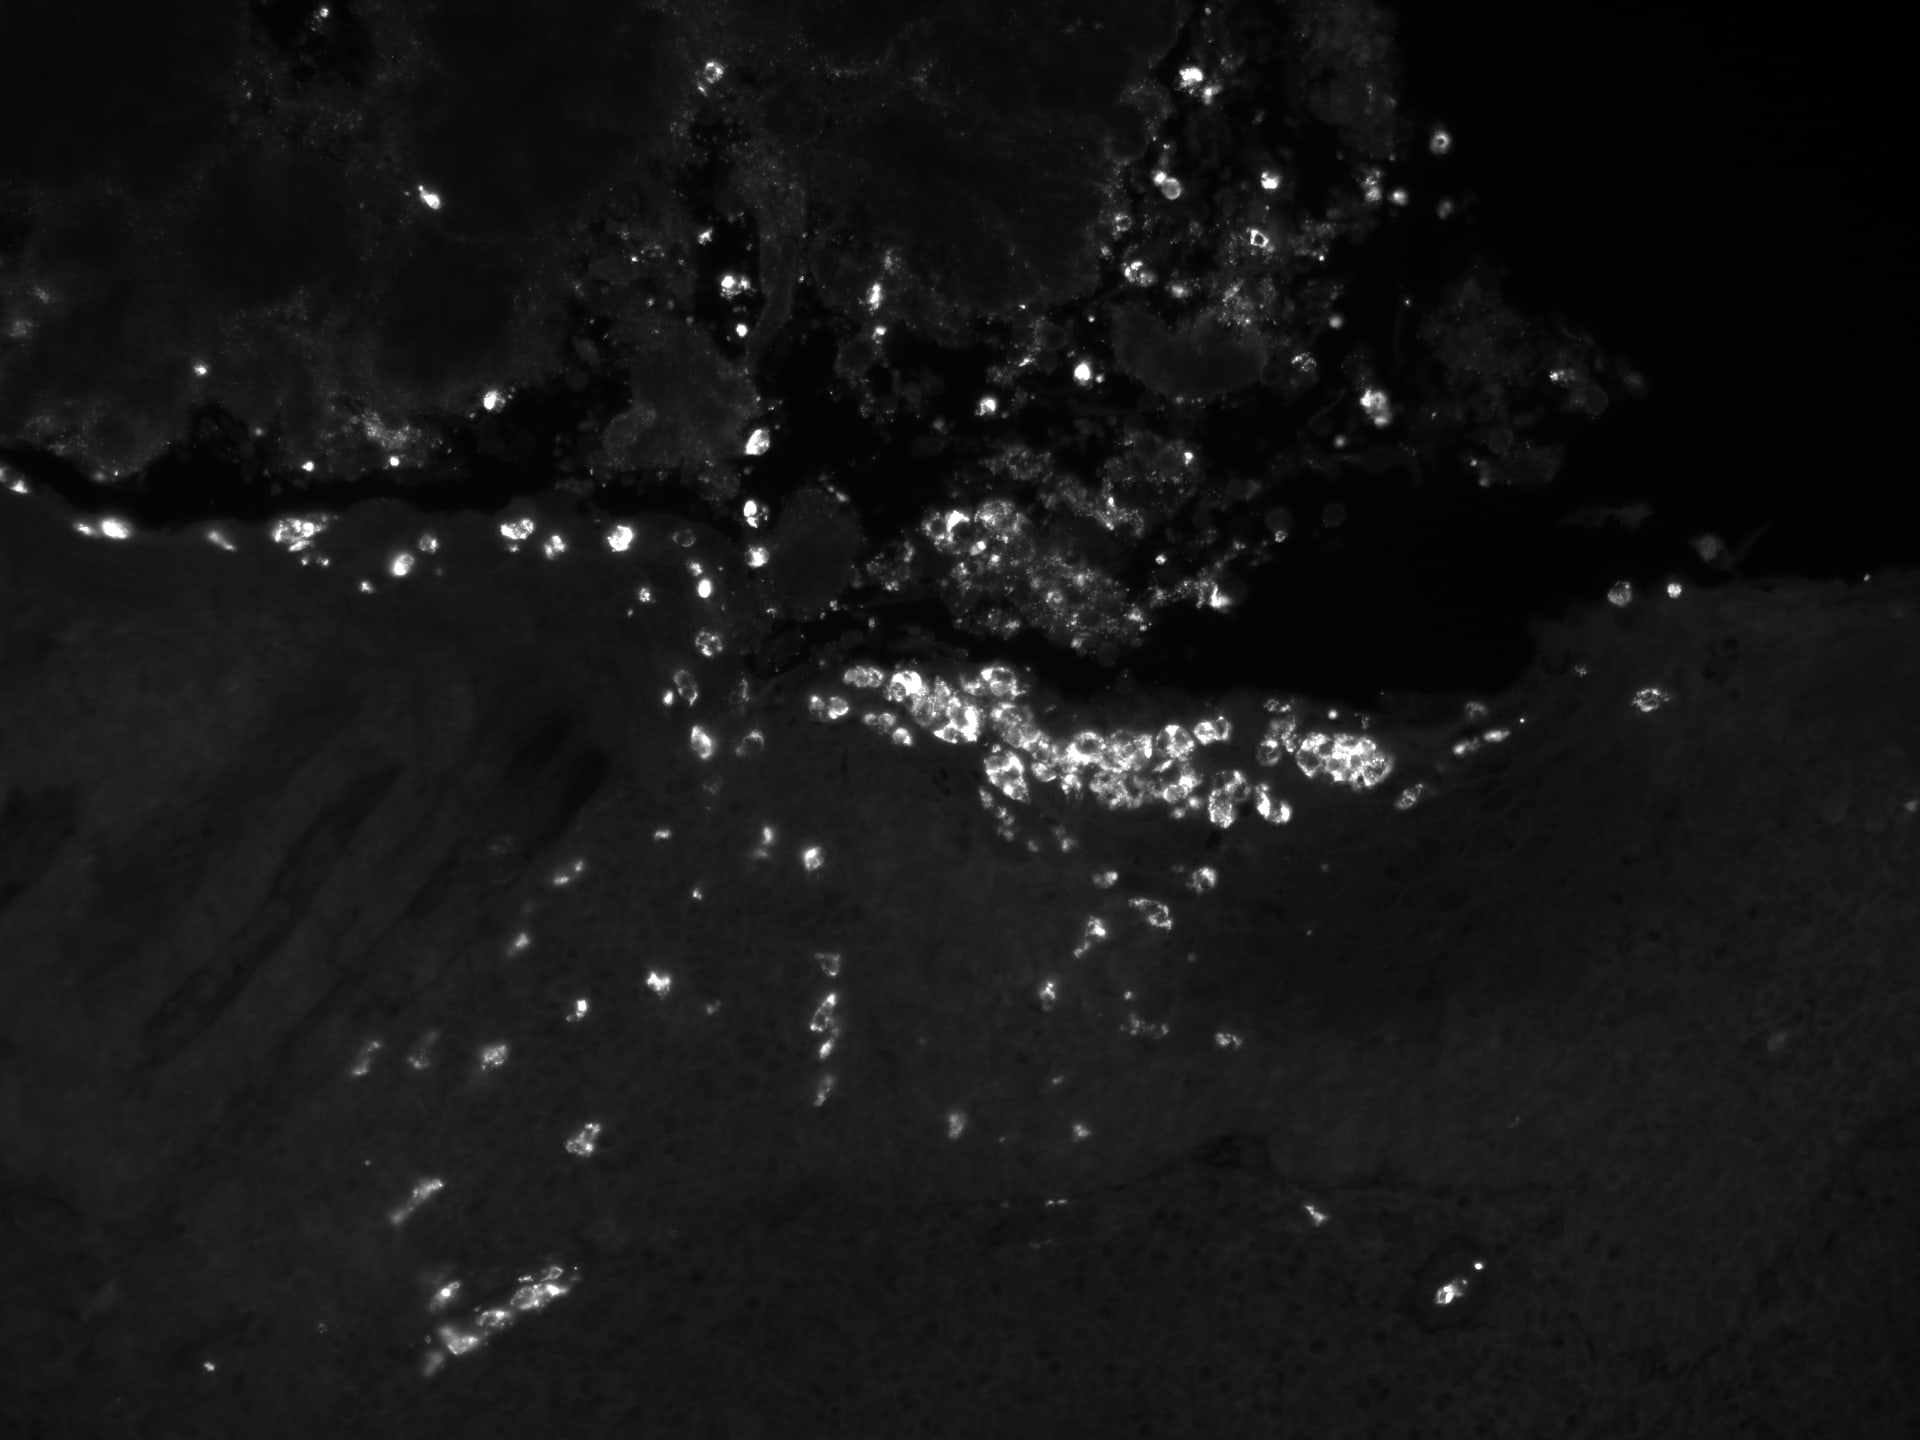
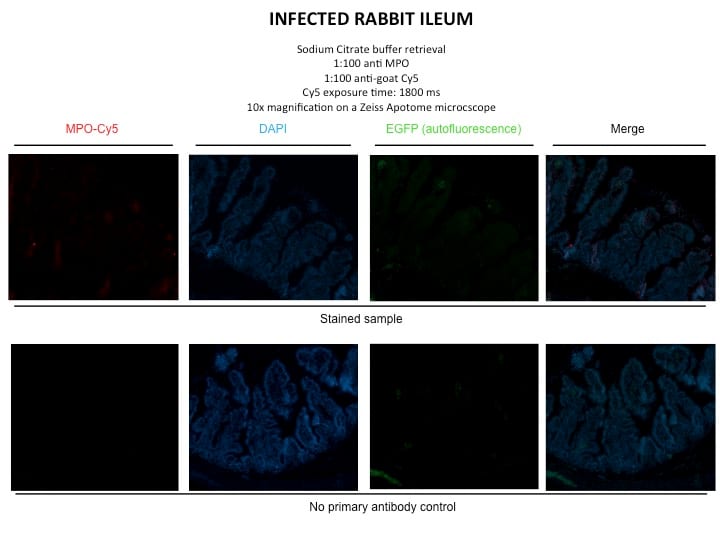
Application: Immunohistochemistry-ParaffinSample Tested: Small intestineSpecies: RabbitVerified Customer | Posted 01/11/2017We have tested the antibody for use in rabbit. PFA-fixed ileum embedded in paraffin was used, sections were 7 micrometer thick. Details about antigen retrieval are available upon request and outlined in the attached image. We also performed WB analysis with these rabbit samples. Image available upon request. Before trying with rabbit, we used samples from mouse (previously tested species) to confirm that the antibody is working in our hands. Details available upon request. Please don't hesitte to contact us in case of questions. We woud like to participate in the Innovator Reward. Thanks.
There are no reviews that match your criteria.
Protocols
Find general support by application which include: protocols, troubleshooting, illustrated assays, videos and webinars.
- Antigen Retrieval Protocol (PIER)
- Antigen Retrieval for Frozen Sections Protocol
- Appropriate Fixation of IHC/ICC Samples
- Cellular Response to Hypoxia Protocols
- Chromogenic IHC Staining of Formalin-Fixed Paraffin-Embedded (FFPE) Tissue Protocol
- Chromogenic Immunohistochemistry Staining of Frozen Tissue
- ClariTSA™ Fluorophore Kits
- Detection & Visualization of Antibody Binding
- Fluorescent IHC Staining of Frozen Tissue Protocol
- Graphic Protocol for Heat-induced Epitope Retrieval
- Graphic Protocol for the Preparation and Fluorescent IHC Staining of Frozen Tissue Sections
- Graphic Protocol for the Preparation and Fluorescent IHC Staining of Paraffin-embedded Tissue Sections
- Graphic Protocol for the Preparation of Gelatin-coated Slides for Histological Tissue Sections
- ICC Cell Smear Protocol for Suspension Cells
- ICC Immunocytochemistry Protocol Videos
- ICC for Adherent Cells
- IHC Sample Preparation (Frozen sections vs Paraffin)
- ISH-IHC Protocol for Chromogenic Detection on Formalin Fixed Paraffin Embedded (FFPE) Tissue
- Immunocytochemistry (ICC) Protocol
- Immunocytochemistry Troubleshooting
- Immunofluorescence of Organoids Embedded in Cultrex Basement Membrane Extract
- Immunofluorescent IHC Staining of Formalin-Fixed Paraffin-Embedded (FFPE) Tissue Protocol
- Immunohistochemistry (IHC) and Immunocytochemistry (ICC) Protocols
- Immunohistochemistry Frozen Troubleshooting
- Immunohistochemistry Paraffin Troubleshooting
- Preparing Samples for IHC/ICC Experiments
- Preventing Non-Specific Staining (Non-Specific Binding)
- Primary Antibody Selection & Optimization
- Protocol for Heat-Induced Epitope Retrieval (HIER)
- Protocol for Making a 4% Formaldehyde Solution in PBS
- Protocol for VisUCyte™ HRP Polymer Detection Reagent
- Protocol for the Fluorescent ICC Staining of Cell Smears - Graphic
- Protocol for the Fluorescent ICC Staining of Cultured Cells on Coverslips - Graphic
- Protocol for the Preparation & Fixation of Cells on Coverslips
- Protocol for the Preparation and Chromogenic IHC Staining of Frozen Tissue Sections
- Protocol for the Preparation and Chromogenic IHC Staining of Frozen Tissue Sections - Graphic
- Protocol for the Preparation and Chromogenic IHC Staining of Paraffin-embedded Tissue Sections
- Protocol for the Preparation and Chromogenic IHC Staining of Paraffin-embedded Tissue Sections - Graphic
- Protocol for the Preparation and Fluorescent ICC Staining of Cells on Coverslips
- Protocol for the Preparation and Fluorescent ICC Staining of Non-adherent Cells
- Protocol for the Preparation and Fluorescent ICC Staining of Stem Cells on Coverslips
- Protocol for the Preparation and Fluorescent IHC Staining of Frozen Tissue Sections
- Protocol for the Preparation and Fluorescent IHC Staining of Paraffin-embedded Tissue Sections
- Protocol for the Preparation of Gelatin-coated Slides for Histological Tissue Sections
- Protocol for the Preparation of a Cell Smear for Non-adherent Cell ICC - Graphic
- R&D Systems Quality Control Western Blot Protocol
- TUNEL and Active Caspase-3 Detection by IHC/ICC Protocol
- The Importance of IHC/ICC Controls
- Troubleshooting Guide: Immunohistochemistry
- Troubleshooting Guide: Western Blot Figures
- Western Blot Conditions
- Western Blot Protocol
- Western Blot Protocol for Cell Lysates
- Western Blot Troubleshooting
- Western Blot Troubleshooting Guide
- View all Protocols, Troubleshooting, Illustrated assays and Webinars
Loading...
Associated Pathways
