Members of Lipocalin family share a highly conserved fold with an eight-stranded antiparallel beta barrel, and act as a transporters, carrying small molecules to specific cells. Lipocalin-2, also known as Neutrophil Gelatinase-Associated Lipocalin (NGAL), was originally identified as a component of neutrophil granules. It is a 25 kDa protein existing in monomeric and homo- and heterodimeric forms, the latter as a dimer with human neutrophil gelatinases (MMP-9). Its expression has been observed in most tissues normally exposed to microorganism, and its synthesis is induced in epithelial cells during inflammation. Lipocalin-2 has been implicated in a variety of processes including cell differentiation, tumorigenesis, and apoptosis. Studies indicate that Lipocalin-2 binds a bacterial catecholate sidropore bound to ferric ion such as enterobactin with a subnanomolar dissociation constant (Kd = 0.41 nM). The bound ferric enterobactin complex breaks down slowly in a month into dihydroxybenzoyl serine and dihydroxybenzoic acid (DHBA). It also binds to a ferric DHBA complex with much less Kd values (7.9 nM). Secretion of Lipocalin‑2 in immune cells increases by stimulation of Toll-like receptor as an acute phase response to infection. As a result, it acts as a potent bacteriostatic reagent by sequestering iron. Moreover, Lipocalin-2 can alter the invasive and metastatic behavior of Ras-transformed breast cancer cells in vitro and in vivo by reversing epithelial to mesenchymal transition inducing activity of Ras, through restoration of E-cadherin expression, via effects on the Ras-MAPK signaling pathway.

Key Product Details
Species Reactivity
Validated:
Human, Mouse, Rat
Cited:
Human, Mouse, Rat, Equine
Applications
Validated:
Immunohistochemistry, Western Blot, Simple Western
Cited:
Immunohistochemistry, Immunohistochemistry-Paraffin, Immunohistochemistry-Frozen, Western Blot, Immunocytochemistry, Immunoprecipitation
Label
Unconjugated
Antibody Source
Polyclonal Goat IgG
Loading...
Product Specifications
Immunogen
Mouse myeloma cell line NS0-derived Recombinant Human Lipocalin‑2/NGAL
Gln21-Gly198
Accession # P80188
Gln21-Gly198
Accession # P80188
Specificity
Detects human Lipocalin-2/NGAL in direct ELISAs and Western blots.
Clonality
Polyclonal
Host
Goat
Isotype
IgG
Scientific Data Images for Lipocalin-2/NGAL Antibody
Detection of Human Lipocalin‑2/NGAL by Western Blot.
Western blot shows lysates of Capan-1 human pancreatic adenocarcinoma cell line and human pancreas tissue. PVDF membrane was probed with 0.2 µg/mL of Goat Anti-Human/Mouse/Rat Lipocalin-2/NGAL Antigen Affinity-purified Polyclonal Antibody (Catalog # AF1757) followed by HRP-conjugated Anti-Goat IgG Secondary Antibody (Catalog # HAF109). A specific band was detected for Lipocalin-2/NGAL at approximately 22 kDa (as indicated). This experiment was conducted under reducing conditions and using Immunoblot Buffer Group 1.
Detection of Mouse and Rat Lipocalin-2/NGAL by Western Blot.
Western blot shows lysates of mouse and rat bone marrow. PVDF membrane was probed with 0.2 µg/mL of Goat Anti-Human/Mouse/Rat Lipocalin-2/NGAL Antigen Affinity-purified Polyclonal Antibody (Catalog # AF1757) followed by HRP-conjugated Anti-Goat IgG Secondary Antibody (Catalog # HAF017). A specific band was detected for Lipocalin-2/NGAL at approximately 22 kDa (as indicated). This experiment was conducted under reducing conditions and using Immunoblot Buffer Group 1.
Detection of Human Lipocalin‑2/NGAL by Simple WesternTM.
Simple Western lane view shows lysates of Capan-1 human pancreatic adenocarcinoma cell line, loaded at 0.2 mg/mL. A specific band was detected for Lipocalin-2/NGAL at approximately 34 kDa (as indicated) using 2 µg/mL of Goat Anti-Human/Mouse/Rat Lipocalin-2/NGAL Antigen Affinity-purified Polyclonal Antibody (Catalog # AF1757) followed by 1:50 dilution of HRP-conjugated Anti-Goat IgG Secondary Antibody (Catalog # HAF109). This experiment was conducted under reducing conditions and using the 12-230 kDa separation system.
Detection of Human Lipocalin-2/NGAL by Western Blot
Enhanced expression of antimicrobial effectors by HO53 and HO56 stimulation in BCi cells. Samples were collected after 24 h (black bars) and 48 h (grey bars) post stimulation with Entinostat (10 μM), HO53 (75 μM) and HO56 (75 μM). Followed by expression analysis at mRNA and protein level by qRT-PCR and ELISA/Western blot, respectively. (a) Expression of LCN2 (lipocalin 2) at mRNA and (b) protein (lipocalin 2, NGAL) level in cell lysates. The representative Western blot is selected from one of the 3 independent experiments. GAPDH was used as a loading control. Full-length blots are presented in Supplementary Figure S10b. (c) Fold change of HBD1 (human beta -defensin 1) mRNA in comparison to control (Ctrl) and (d) secretion of hBD-1 peptide measured by ELISA in cell culture supernatants. (e) S100A8 expression was analyzed by qRT-PCR. TUBB (tubulin-beta ) was the reference gene in qRT-PCR. Each bar represents mean value of 3 independent experiments ± SEM; statistical significance was calculated in comparison to the control group using two-way ANOVA with Dunnett’s multiple comparisons test; *p < 0.05, **p < 0.01, ***p < 0.001, ****p < 0.0001. Significant changes are highlighted. Image collected and cropped by CiteAb from the following publication (https://pubmed.ncbi.nlm.nih.gov/31068616), licensed under a CC-BY license. Not internally tested by R&D Systems.
Lipocalin‑2/NGAL in Human Pancreas Tissue
Lipocalin‑2/NGAL was detected in immersion fixed paraffin-embedded sections of human pancreas using Goat Anti-Human/Mouse/Rat Lipocalin‑2/NGAL Antigen Affinity-purified Polyclonal Antibody (Catalog # af1757) at 5 µg/ml for 1 hour at room temperature followed by incubation with the Anti-Goat IgG VisUCyte™ HRP Polymer Antibody (Catalog # VC004). Before incubation with the primary antibody, tissue was subjected to heat-induced epitope retrieval using VisUCyte Antigen Retrieval Reagent-Basic (Catalog # VCTS021). Tissue was stained using DAB (brown) and counterstained with hematoxylin (blue). Specific staining was localized to the cytoplasm. View our protocol for Chromogenic IHC Staining of Paraffin-embedded Tissue Sections.
Detection of Lipocalin-2/NGAL by Western Blot
LCN2 expression in pancreatic neoplastic lesions and PDAC cell lines.(A) The LCN2 immunostaining pattern for normal (n = 31), PanIN1 (n = 22), PanIN-2 (n = 13), PanIN -3 and PDAC (n = 82). Mean scores and the SEM for LCN2 immunostaining are noted below the sections. (B) LCN2 gene expression was examined in 21 different PDAC cell lines. Relative expression was normalized using loading controls and then normalized to the H6c7 ratio. (C) Representative immunoblots of LCN2 and GAPDH protein expression in PDAC cell lines. Image collected and cropped by CiteAb from the following open publication (https://pubmed.ncbi.nlm.nih.gov/23056397), licensed under a CC-BY license. Not internally tested by R&D Systems.
Detection of Lipocalin-2/NGAL by Western Blot
The knockdown and overexpression of LCN2 expression in PDAC cell lines.(A) LCN2 mRNA expression was suppressed using three different retroviral shRNA constructs (KD) in H6c7KrT cells. (B) Representative immunoblots of LCN2 protein expression in H6c7KrT cells, where GAPDH was used as a loading control. (C) LCN2 expression was downregulated in BxPC3 and HPAF-II cells. In PANC1 cells LCN2 was overexpressed by a lentiviral expression construct. (D) Representative immunoblots of LCN2 protein expression in BxPC3, HPAF-II, and PANC1 cells. Image collected and cropped by CiteAb from the following open publication (https://pubmed.ncbi.nlm.nih.gov/23056397), licensed under a CC-BY license. Not internally tested by R&D Systems.
Detection of Lipocalin-2/NGAL by Western Blot
LCN2 promotes adhesion, invasion, and gemcitabine resistance in PDAC cells.Adhesion assays on the (A) H6c7 KrT, (B) BxPC3, HPAF-II, and PANC1 cell lines. Fold changes were calculated by comparing the KD to NS or LCN2 to EV (n = 3). The fold changes in invasive ability were calculated by comparing the effects of the shRNA constructs against the NS control, or LCN2 overexpression compared to the EV control. Invasive ability was assessed in (C) H6c7KrT cells (n = 3), (D) BxPC3, HPAF-II, and PANC1 cells (n = 6) were seeded onto Matrigel or collagen IV coated membranes. To assess MMP-9 activity gelatin zymography was performed on the conditioned media from (E) H6c7 KrT cells, (F) BxPC3, HPAF-II, and PANC1 cell lines (n = 3). (G) PI exclusion assays for cell death (n = 6) and (H) immunoblot analysis after 72 hours treatment by gemcitabine on the BxPC3, HPAF-II, and PANC1 cell lines (n = 3). (Gem., gemcitabine; C3, caspase 3; CC3, cleaved caspase 3; * denotes significant differences between the test and control samples student t-tests or one-way ANOVA and Bonferroni’s post hoc tests where appropriate.). Image collected and cropped by CiteAb from the following open publication (https://pubmed.ncbi.nlm.nih.gov/23056397), licensed under a CC-BY license. Not internally tested by R&D Systems.
Detection of Lipocalin-2/NGAL by Western Blot
LCN2 promotes resistance to gemcitabine and angiogenesis.Effect of gemcitabine on the growth of tumors formed by (A) BxPC3-NS and –LCN2KD2 cell lines and (B) with PANC1-EV and –LCN2 cell lines [*denotes significance between vehicle treated cell lines (n = 10 per group, p<0.0001, mixed model multiple regression) †denotes significance between vehicle and gemcitabine treated mice injected with BxPC3 LCN2KD2 (n = 10 per group, p = 0.0003, mixed model multiple regression)]. (C) Protein lysates isolated from BxPC3 and PANC1 xenografts were assayed for caspase-3 cleavage after gemcitabine treatment (n = 10). (D) Representative histological images of xenografts formed by BxPC3 NS and –LCN2KD2, and PANC1-EV and –LCN2 cells after H&E, and immunostaining for LCN2, Ki67, and murine CD31. (E) Vascular density in five hot spots at high magnification in the BxPC3 NS and –LCN2KD2, and PANC1-EV and –LCN2 xenografts. The mRNA expression of (F) HIF1A and (G) VEGF in the BxPC3 and PANC1 xenografts. Gene expression was compared between KD and NS, or LCN2 and EV. [*denotes significance between KD and NS, or LCN2 and EV (n = 20; p<0.05, student t-test)]. Image collected and cropped by CiteAb from the following open publication (https://pubmed.ncbi.nlm.nih.gov/23056397), licensed under a CC-BY license. Not internally tested by R&D Systems.
Detection of Lipocalin-2/NGAL by Western Blot
The knockdown and overexpression of LCN2 expression in PDAC cell lines.(A) LCN2 mRNA expression was suppressed using three different retroviral shRNA constructs (KD) in H6c7KrT cells. (B) Representative immunoblots of LCN2 protein expression in H6c7KrT cells, where GAPDH was used as a loading control. (C) LCN2 expression was downregulated in BxPC3 and HPAF-II cells. In PANC1 cells LCN2 was overexpressed by a lentiviral expression construct. (D) Representative immunoblots of LCN2 protein expression in BxPC3, HPAF-II, and PANC1 cells. Image collected and cropped by CiteAb from the following open publication (https://pubmed.ncbi.nlm.nih.gov/23056397), licensed under a CC-BY license. Not internally tested by R&D Systems.
Detection of Lipocalin-2/NGAL by Western Blot
IL-6-specific up-regulation of LCN2 is dependent on NF-kappa B activation in human CRC cells(A) After stimulation with 50 ng/ml IL-6 for the indicated time, cytosolic and nuclear extracts of DLD-1 cells were prepared and used to determine the translocation of p65 from the cytosol to the nucleus. Actin and lamin B were used as loading controls. (B) After transfection with LCN2 siRNA, DLD-1 cells were stimulated with 50 ng/ml IL-6. Then the level of LCN2 in the cytosol and p65 in the nucleus were analyzed by Western blotting. Actin and lamin B were used as loading controls. (C) The cells were stimulated after transfection with p65 siRNA, then the levels of LCN2 and p65 were analyzed by Western blotting (upper panel). Cells were stimulated with IL-6 after pretreatment with PT and BAY11-7082 (NF-kappa B-specific inhibitor). Then, the levels of LCN2 and p65 were detected using Western blot analysis (lower panel). Actin was used as a loading control. All images are representatives from at least three independent experiments. Image collected and cropped by CiteAb from the following open publication (https://pubmed.ncbi.nlm.nih.gov/35470375), licensed under a CC-BY license. Not internally tested by R&D Systems.
Detection of Lipocalin-2/NGAL by Western Blot
IL-6 specifically up-regulated LCN2 protein and mRNA levels in human CRC cells(A,B) After stimulation with IL-6, protein and mRNA of DLD-1 cells were isolated. Then, Western blotting and reverse-transcriptase PCR were performed. The top images are Western blots and lower images are reverse-transcriptase PCR. (C) Human CRC cell lines, SW480 and HT-29, were stimulated with 50 ng/ml IL-6 for 24 h, then the levels of LCN2 protein and mRNA were detected. All images are representatives from at least three independent experiments. Image collected and cropped by CiteAb from the following open publication (https://pubmed.ncbi.nlm.nih.gov/35470375), licensed under a CC-BY license. Not internally tested by R&D Systems.
Detection of Human Lipocalin-2/NGAL by Western Blot
ADAM8 and LCN2 levels correlate in Panc89- and MB-231-derived extracellular vesicles (EV). Representative Western blots (A) of EVs derived from either Panc89 hA8 WT or KO cells, and cell lysate (CL) of Panc89 hA8 WT cells, and (B) of EVs derived from either MB-231 hA8 WT or MB-231 KO cells show the detection of ADAM8, MMP-9, LCN2, and Flotillin-1 in the upper part. Diagrams below illustrate the quantification and downregulation of LCN2 secretion (relative to Flotillin-1 secretion) in EVs isolated from Panc89 (hA8 WT or hA8 KO 1) or MB-231 (hA8 WT or hA8 KO) cells (n = 3). Data are presented as mean values ± S.D. ** p < 0.01. Image collected and cropped by CiteAb from the following open publication (https://pubmed.ncbi.nlm.nih.gov/35216088), licensed under a CC-BY license. Not internally tested by R&D Systems.
Detection of Human Lipocalin-2/NGAL by Western Blot
Co-culture of THP1-derived macrophages with Panc89 hA8 WT and KO cells. (A) The schematic model depicts the interactions of THP1-derived macrophages (green, M0) and Panc89 cells with or without ADAM8 (red). Created with BioRender.com. (B) ADAM8 mRNA expression in both Panc89 hA8 WT and KO is not affected by M0, whereas LCN2 mRNA expression. Data are presented as mean values ± S.D. *** p < 0.001. (C) is upregulated after co-culture in an ADAM8-dependent manner. Data are presented as mean values ± S.D. *** p < 0.001. (D) The graph illustrates the upregulation of MMP-9 mRNA expression in both Panc89 hA8 WT and KO after co-culture (n = 2). Data are presented as mean values ± S.D. *** p < 0.001. (E) Representative immunoblot shows the detection of ADAM8, MMP-9, and LCN2 with or without co-culture. In addition to the qPCR results, MMP-9 and LCN2 are upregulated after co-culture at the protein level (n = 2). (F) Representative zymography of Panc89 hA8 WT and KO cells with or without co-culture demonstrates less active MMP-9 in Panc89 hA8 KO cells than in Panc89 hA8 WT cells after co-culture. (G) Quantification of active MMP-9 refers to total MMP-9 in zymography of Panc89 hA8 WT and KO cells after co-culture (n = 2). Data are presented as mean values ± S.D. * p < 0.05. Representative images of Panc89 cells before and after co-culture are shown in (H); scale bar, 100 μm. After co-culture, morphological changes are visible in both Panc89 hA8 WT and KO cells. Image collected and cropped by CiteAb from the following open publication (https://pubmed.ncbi.nlm.nih.gov/35216088), licensed under a CC-BY license. Not internally tested by R&D Systems.
Detection of Lipocalin-2/NGAL by Western Blot
IL-6-induced LCN2 regulates cell survival and anti-apoptotic molecules mediated by the NF-kB/STAT3 pathway(A) After transfection with p65, STAT3 and LCN2 siRNA, DLD-1 cells were stimulated with 50 ng/ml IL-6 for 24 h, total extracts of DLD-1 cells were prepared and used to determine the phosphorylation of PI3k/AKT/mTOR. Actin was used as a loading control. (B) Total extracts prepared by the same methods were analyzed to determine the protein levels that are target gene products of STAT3 and NF-kB. Actin was used as a loading control. All images are representatives from at least three independent experiments. Image collected and cropped by CiteAb from the following open publication (https://pubmed.ncbi.nlm.nih.gov/35470375), licensed under a CC-BY license. Not internally tested by R&D Systems.
Detection of Human Lipocalin-2/NGAL by Western Blot
Downstream signaling of EGFR is affected by ADAM8 KO in Panc89 cells. (A) Representative immunoblot of EGFR and MAPK phosphorylation, and LCN2 expression after treatment with recombinant LCN2 (rLCN2) and recombinant transforming growth factor-alpha (rTGF-alpha ) for 1 h. (B) Quantification of LCN2 shows the downregulation of LCN2 expression in Panc89 hA8 KO cells. The addition of rLCN2 does not increase LCN2 expression in Panc89 hA8 KO cells, whereas rTGF-alpha alone or combined with rLCN2 adjusts LCN2 expression to Panc89 hA8 WT levels. (C) Quantification of p-EGFR illustrates no significant changes in EGFR phosphorylation of Panc89 hA8 KO compared to Panc89 hA8 WT cells. (D) The diagram displays the quantification of p-MAPK. The phosphorylation of MAPK is significantly downregulated in Panc89 hA8 KO cells. rTGF-alpha stimulation decreases MAPK phosphorylation in both Panc89 hA WT and KO cells. Data are presented as mean values ± S.D. * p < 0.05, ** p < 0.01 (n = 2). Image collected and cropped by CiteAb from the following open publication (https://pubmed.ncbi.nlm.nih.gov/35216088), licensed under a CC-BY license. Not internally tested by R&D Systems.
Detection of Human Lipocalin-2/NGAL by Western Blot
Co-culture of THP1-derived and polarized macrophages with Panc89 hA8 WT and KO cells. (A) Western blot illustrates the detection of ADAM8, MMP-9, and LCN2 in Panc89 hA8 WT and KO control cells (Ø) and after co-culture with M0, M1, and M2 macrophages (two time points: 0 h and 1 h). ADAM8 is upregulated in Panc89 hA8 WT cells after co-culture with M2-polarized macrophages. Panc89 cells show the highest MMP-9 expression after co-culture with M0, but M1 macrophages also upregulate MMP-9. LCN2 is dependent on ADAM8 when upregulated in Panc89 cells after co-culture with M0 and M2 macrophages but independent of ADAM8 in Panc89 cells co-cultured with M1 macrophages. (B) ADAM8, (C) MMP-9, and (D) LCN2 ELISA of Panc89 hA8 WT and KO cell-derived supernatants of control cells and after co-culture with M0, M1, and M2 (two time points: 0 h and 1 h). In accordance with the immunoblot results of (A), ADAM8 is upregulated in supernatants derived from Panc89 hA8 WT cells after co-culture with M2 macrophages (B). At the same time, macrophages increase MMP-9 secretion from an undetectable level to almost 80,000 pg/mL in Panc89 hA8 WT and 60,000 pg/mL in Panc89 hA8 KO cells. M1 and M2 macrophages increase MMP-9 secretion of Panc89 independent of ADAM8, but not as high as in Panc89 cells co-cultured with M0. In contrast, LCN2 is upregulated in Panc89 hA8 WT cells by M0 and M1, but not by M2 macrophages. In the absence of ADAM8, Panc89 hA8 KO cells show low LCN2 secretion in control cells and after co-culture with M0 and M2 macrophages. Only after co-culture with M1 macrophages is the LCN2 secretion level increased (n = 1). Data are presented as mean values ± S.D. Image collected and cropped by CiteAb from the following open publication (https://pubmed.ncbi.nlm.nih.gov/35216088), licensed under a CC-BY license. Not internally tested by R&D Systems.
Detection of Lipocalin-2/NGAL by Western Blot
IL-6 specifically up-regulated LCN2 protein and mRNA levels in human CRC cells(A,B) After stimulation with IL-6, protein and mRNA of DLD-1 cells were isolated. Then, Western blotting and reverse-transcriptase PCR were performed. The top images are Western blots and lower images are reverse-transcriptase PCR. (C) Human CRC cell lines, SW480 and HT-29, were stimulated with 50 ng/ml IL-6 for 24 h, then the levels of LCN2 protein and mRNA were detected. All images are representatives from at least three independent experiments. Image collected and cropped by CiteAb from the following open publication (https://pubmed.ncbi.nlm.nih.gov/35470375), licensed under a CC-BY license. Not internally tested by R&D Systems.
Detection of Human Lipocalin-2/NGAL by Western Blot
ADAM8 and LCN2 levels correlate in Panc89- and MB-231-derived extracellular vesicles (EV). Representative Western blots (A) of EVs derived from either Panc89 hA8 WT or KO cells, and cell lysate (CL) of Panc89 hA8 WT cells, and (B) of EVs derived from either MB-231 hA8 WT or MB-231 KO cells show the detection of ADAM8, MMP-9, LCN2, and Flotillin-1 in the upper part. Diagrams below illustrate the quantification and downregulation of LCN2 secretion (relative to Flotillin-1 secretion) in EVs isolated from Panc89 (hA8 WT or hA8 KO 1) or MB-231 (hA8 WT or hA8 KO) cells (n = 3). Data are presented as mean values ± S.D. ** p < 0.01. Image collected and cropped by CiteAb from the following open publication (https://pubmed.ncbi.nlm.nih.gov/35216088), licensed under a CC-BY license. Not internally tested by R&D Systems.
Detection of Human Lipocalin-2/NGAL by Western Blot
ADAM8 regulates LCN2 levels in tumor cell lines MB-231 and Panc89. The Human Protease/Protease Inhibitory Array demonstrates downregulation of ADAM8 (A), MMP-9 (B), and LCN2 (C) in supernatants derived from MB-231 hA8 KO cells. (D) mRNA expression and (E) representative Western blot of LCN2 in MB-231 hA8 WT and hA8 KO cells confirm results from (C) (n = 2). (F) mRNA expression and (G) representative Western blot of LCN2 in Panc89 hA8 WT, KO 1, and KO 2 cells demonstrate decreased LCN2 expression in hA8 KO cells (n = 2). Data are presented as mean values ± S.D., ** p < 0.01, *** p < 0.001. (H) Recombinant LCN2 (1 ng, 10 ng, 100 ng) does not affect protease activity of recombinant ADAM8 using a CD23 substrate (PepDAB# 13). Image collected and cropped by CiteAb from the following open publication (https://pubmed.ncbi.nlm.nih.gov/35216088), licensed under a CC-BY license. Not internally tested by R&D Systems.
Detection of Lipocalin-2/NGAL by Western Blot
IL-6-specific up-regulation of LCN2 is dependent on STAT3 activation in human CRC cells(A) After stimulation with 50 ng/ml IL-6 for the indicated time, cytosolic and nuclear extracts of DLD-1 cells were prepared and used to determine the translocation of p-STAT3. Actin and lamin B were used as loading controls. (B) After transfection with LCN2 siRNA, DLD-1 cells were stimulated with 50 ng/ml IL-6. Then the level of LCN2 in cytosol and p-STAT3 in the nucleus were analyzed by Western blotting. Actin and lamin B were used as loading controls. (C) The cells were stimulated after transfection with STAT3 siRNA, then the level of LCN2 and p-STAT3 were analyzed by Western blotting (upper panel). After pretreatment with 5 μM stattic (STAT3-specific inhibitor), the cells were stimulated with IL-6. Then, the level of LCN2 and p-STAT3 were detected using Western blotting analysis (lower panel). Actin was used as a loading control. All images are representatives from at least three independent experiments. Image collected and cropped by CiteAb from the following open publication (https://pubmed.ncbi.nlm.nih.gov/35470375), licensed under a CC-BY license. Not internally tested by R&D Systems.
Detection of Human Lipocalin-2/NGAL by Western Blot
ADAM8 regulates LCN2 levels in tumor cell lines MB-231 and Panc89. The Human Protease/Protease Inhibitory Array demonstrates downregulation of ADAM8 (A), MMP-9 (B), and LCN2 (C) in supernatants derived from MB-231 hA8 KO cells. (D) mRNA expression and (E) representative Western blot of LCN2 in MB-231 hA8 WT and hA8 KO cells confirm results from (C) (n = 2). (F) mRNA expression and (G) representative Western blot of LCN2 in Panc89 hA8 WT, KO 1, and KO 2 cells demonstrate decreased LCN2 expression in hA8 KO cells (n = 2). Data are presented as mean values ± S.D., ** p < 0.01, *** p < 0.001. (H) Recombinant LCN2 (1 ng, 10 ng, 100 ng) does not affect protease activity of recombinant ADAM8 using a CD23 substrate (PepDAB# 13). Image collected and cropped by CiteAb from the following open publication (https://pubmed.ncbi.nlm.nih.gov/35216088), licensed under a CC-BY license. Not internally tested by R&D Systems.
Detection of Lipocalin-2/NGAL by Western Blot
IL-6-specific up-regulation of LCN2 is dependent on NF-kappa B activation in human CRC cells(A) After stimulation with 50 ng/ml IL-6 for the indicated time, cytosolic and nuclear extracts of DLD-1 cells were prepared and used to determine the translocation of p65 from the cytosol to the nucleus. Actin and lamin B were used as loading controls. (B) After transfection with LCN2 siRNA, DLD-1 cells were stimulated with 50 ng/ml IL-6. Then the level of LCN2 in the cytosol and p65 in the nucleus were analyzed by Western blotting. Actin and lamin B were used as loading controls. (C) The cells were stimulated after transfection with p65 siRNA, then the levels of LCN2 and p65 were analyzed by Western blotting (upper panel). Cells were stimulated with IL-6 after pretreatment with PT and BAY11-7082 (NF-kappa B-specific inhibitor). Then, the levels of LCN2 and p65 were detected using Western blot analysis (lower panel). Actin was used as a loading control. All images are representatives from at least three independent experiments. Image collected and cropped by CiteAb from the following open publication (https://pubmed.ncbi.nlm.nih.gov/35470375), licensed under a CC-BY license. Not internally tested by R&D Systems.
Detection of Lipocalin-2/NGAL by Western Blot
The expression of LCN2 was specifically induced in colon tissue of AOM/DSS-induced CAC mouse models The mice were given 7.4 mg/kg body weight of AOM and 3% DSS and subsequently killed (normal = 10, AOM/DSS = 12 mice). (A) Macroscopic appearance was captured for detecting tumor formation in the colon. (B) H&E staining (magnification ×10) of colonic mucosal tissue sections from mice were photographed using microscopy (upper panel). Colon length and body weight were statistically analyzed (lower panel). Data shown are presented as the mean ± SE. **P<0.01 versus control and CAC group. (C) After homogenizing colonic tissues, levels of LCN2 in tissue were detected by ELISA as described in the ‘Materials and methods’ section. Data shown are presented as the mean ± SE. **P<0.01 versus the control and CAC groups. (D) Total tissue extracts were prepared after killing and analyzed using LCN2 and actin antibody by Western blotting. Actin was used as a loading control. (E) IHC images of LCN2 expression in the colonic tissues from control and CAC mice are shown and the positively binding cells are shown in brown. The numbers of positive cells in the tumor samples were counted. Values represent means ± SEs. ***P<0.001 vs. the normal group. Image collected and cropped by CiteAb from the following open publication (https://pubmed.ncbi.nlm.nih.gov/35470375), licensed under a CC-BY license. Not internally tested by R&D Systems.
Detection of Lipocalin-2/NGAL by Western Blot
IL-6-specific up-regulation of LCN2 is dependent on STAT3 activation in human CRC cells(A) After stimulation with 50 ng/ml IL-6 for the indicated time, cytosolic and nuclear extracts of DLD-1 cells were prepared and used to determine the translocation of p-STAT3. Actin and lamin B were used as loading controls. (B) After transfection with LCN2 siRNA, DLD-1 cells were stimulated with 50 ng/ml IL-6. Then the level of LCN2 in cytosol and p-STAT3 in the nucleus were analyzed by Western blotting. Actin and lamin B were used as loading controls. (C) The cells were stimulated after transfection with STAT3 siRNA, then the level of LCN2 and p-STAT3 were analyzed by Western blotting (upper panel). After pretreatment with 5 μM stattic (STAT3-specific inhibitor), the cells were stimulated with IL-6. Then, the level of LCN2 and p-STAT3 were detected using Western blotting analysis (lower panel). Actin was used as a loading control. All images are representatives from at least three independent experiments. Image collected and cropped by CiteAb from the following open publication (https://pubmed.ncbi.nlm.nih.gov/35470375), licensed under a CC-BY license. Not internally tested by R&D Systems.
Human Lipocalin-2 / NGAL ELISA Standard Curve
Recombinant Human Lipocalin‑2/NGAL (Catalog # 1757-LC) was serially diluted and captured by Rat Anti-Human Lipocalin‑2/NGAL Monoclonal Antibody (Catalog # MAB17571) coated on a Clear Polystyrene Microplate (Catalog # DY990). Goat Anti-Human/Mouse/Rat Lipocalin‑2/NGAL Antigen Affinity-purified Polyclonal Antibody (Catalog # AF1757) was biotinylated and incubated with the protein captured on the plate. Detection of the standard curve was achieved by incubating Streptavidin-HRP (Catalog # DY998)Applications for Lipocalin-2/NGAL Antibody
Application
Recommended Usage
Immunohistochemistry
5-15 µg/mL
Sample: Immersion fixed paraffin-embedded sections of human pancreas
Sample: Immersion fixed paraffin-embedded sections of human pancreas
Simple Western
2 µg/mL
Sample: Capan‑1 human pancreatic adenocarcinoma cell line
Sample: Capan‑1 human pancreatic adenocarcinoma cell line
Western Blot
0.2 µg/mL
Sample: Capan‑1 human pancreatic adenocarcinoma cell line and human pancreas tissue
Sample: Capan‑1 human pancreatic adenocarcinoma cell line and human pancreas tissue
Reviewed Applications
Read 2 reviews rated 4 using AF1757 in the following applications:
Formulation, Preparation, and Storage
Purification
Antigen Affinity-purified
Reconstitution
Reconstitute at 0.2 mg/mL in sterile PBS. For liquid material, refer to CoA for concentration.
Loading...
Formulation
Lyophilized from a 0.2 μm filtered solution in PBS with Trehalose. See Certificate of Analysis for details.
*Small pack size (-SP) is supplied either lyophilized or as a 0.2 µm filtered solution in PBS.
*Small pack size (-SP) is supplied either lyophilized or as a 0.2 µm filtered solution in PBS.
Shipping
Lyophilized product is shipped at ambient temperature. Liquid small pack size (-SP) is shipped with polar packs. Upon receipt, store immediately at the temperature recommended below.
Stability & Storage
Use a manual defrost freezer and avoid repeated freeze-thaw cycles.
- 12 months from date of receipt, -20 to -70 °C as supplied.
- 1 month, 2 to 8 °C under sterile conditions after reconstitution.
- 6 months, -20 to -70 °C under sterile conditions after reconstitution.
Calculators
Background: Lipocalin-2/NGAL
Long Name
Neutrophil Gelatinase-associated Lipocalin
Alternate Names
24p3, LCN2, Lipocalin2, MSFI, NGAL, Oncogene 24p3, p25, Siderocalin, Uterocalin
Gene Symbol
LCN2
UniProt
Additional Lipocalin-2/NGAL Products
Product Documents for Lipocalin-2/NGAL Antibody
Certificate of Analysis
To download a Certificate of Analysis, please enter a lot or batch number in the search box below.
Note: Certificate of Analysis not available for kit components.
Product Specific Notices for Lipocalin-2/NGAL Antibody
For research use only
Related Research Areas
Citations for Lipocalin-2/NGAL Antibody
 Powered by Bioz
Customer Reviews for Lipocalin-2/NGAL Antibody (2)
4 out of 5
2 Customer Ratings
Have you used Lipocalin-2/NGAL Antibody?
Submit a review and receive an Amazon gift card!
$25/€18/£15/$25CAN/¥2500 Yen for a review with an image
$10/€7/£6/$10CAN/¥1110 Yen for a review without an image
Submit a review
Customer Images
Showing
1
-
2 of
2 reviews
Showing All
Filter By:
-
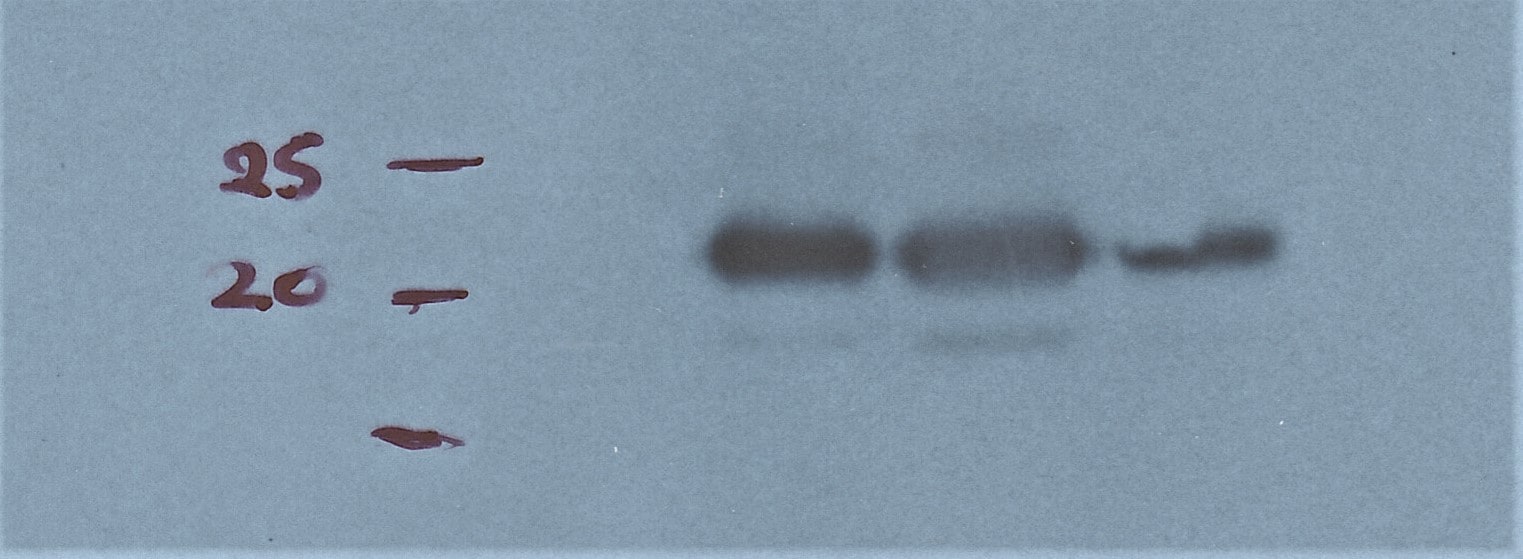
Application: Western BlotSample Tested: HEK293T human embryonic kidney cell lineSpecies: HumanVerified Customer | Posted 02/16/2018Recombinant human LCN2 expressed in HEK-293T cells. Test during isolation and purification process. 1st band: 1st eluate (15ug) 2nd band: 2nd eluate (15ug) 3rd band: bead slurry Dilution: 1:10000

-
Application: ELISASample Tested: EDTA PlasmaSpecies: HumanVerified Customer | Posted 12/06/2017
There are no reviews that match your criteria.
Protocols
Find general support by application which include: protocols, troubleshooting, illustrated assays, videos and webinars.
- Antigen Retrieval Protocol (PIER)
- Antigen Retrieval for Frozen Sections Protocol
- Appropriate Fixation of IHC/ICC Samples
- Cellular Response to Hypoxia Protocols
- Chromogenic IHC Staining of Formalin-Fixed Paraffin-Embedded (FFPE) Tissue Protocol
- Chromogenic Immunohistochemistry Staining of Frozen Tissue
- ClariTSA™ Fluorophore Kits
- Detection & Visualization of Antibody Binding
- Fluorescent IHC Staining of Frozen Tissue Protocol
- Graphic Protocol for Heat-induced Epitope Retrieval
- Graphic Protocol for the Preparation and Fluorescent IHC Staining of Frozen Tissue Sections
- Graphic Protocol for the Preparation and Fluorescent IHC Staining of Paraffin-embedded Tissue Sections
- Graphic Protocol for the Preparation of Gelatin-coated Slides for Histological Tissue Sections
- IHC Sample Preparation (Frozen sections vs Paraffin)
- Immunofluorescent IHC Staining of Formalin-Fixed Paraffin-Embedded (FFPE) Tissue Protocol
- Immunohistochemistry (IHC) and Immunocytochemistry (ICC) Protocols
- Immunohistochemistry Frozen Troubleshooting
- Immunohistochemistry Paraffin Troubleshooting
- Preparing Samples for IHC/ICC Experiments
- Preventing Non-Specific Staining (Non-Specific Binding)
- Primary Antibody Selection & Optimization
- Protocol for Heat-Induced Epitope Retrieval (HIER)
- Protocol for Making a 4% Formaldehyde Solution in PBS
- Protocol for VisUCyte™ HRP Polymer Detection Reagent
- Protocol for the Preparation & Fixation of Cells on Coverslips
- Protocol for the Preparation and Chromogenic IHC Staining of Frozen Tissue Sections
- Protocol for the Preparation and Chromogenic IHC Staining of Frozen Tissue Sections - Graphic
- Protocol for the Preparation and Chromogenic IHC Staining of Paraffin-embedded Tissue Sections
- Protocol for the Preparation and Chromogenic IHC Staining of Paraffin-embedded Tissue Sections - Graphic
- Protocol for the Preparation and Fluorescent IHC Staining of Frozen Tissue Sections
- Protocol for the Preparation and Fluorescent IHC Staining of Paraffin-embedded Tissue Sections
- Protocol for the Preparation of Gelatin-coated Slides for Histological Tissue Sections
- R&D Systems Quality Control Western Blot Protocol
- TUNEL and Active Caspase-3 Detection by IHC/ICC Protocol
- The Importance of IHC/ICC Controls
- Troubleshooting Guide: Immunohistochemistry
- Troubleshooting Guide: Western Blot Figures
- Western Blot Conditions
- Western Blot Protocol
- Western Blot Protocol for Cell Lysates
- Western Blot Troubleshooting
- Western Blot Troubleshooting Guide
- View all Protocols, Troubleshooting, Illustrated assays and Webinars
Loading...