The platelet-derived growth factor (PDGF) family consists of proteins derived from four genes (PDGF-A, -B, -C, and -D) that form disulfide-linked homodimers (PDGF-AA, -BB, -CC, and -DD) and a heterodimer (PDGF-AB) (1, 2). These proteins regulate diverse cellular functions by binding to and inducing the homo- or hetero-dimerization of two receptors (PDGF R alpha and R beta ). Whereas alpha / alpha homo-dimerization is induced by PDGF-AA, -BB, -CC, and -AB, alpha / beta hetero-dimerization is induced by PDGF-AB, -BB, -CC, and -DD, and beta / beta homo-dimerization is induced only by PDGF-BB and -DD (1-4). Both PDGF R alpha and R beta are members of the class III subfamily of receptor tyrosine kinases (RTK) that also includes the receptors for M-CSF, SCF, and Flt-3 ligand. All class III RTKs are characterized by the presence of five immunoglobulin-like domains in their extracellular region and a split kinase domain in their intracellular region. Ligand-induced receptor dimerization results in autophosphorylation in trans resulting in the activation of several intracellular signaling pathways that can lead to cell proliferation, cell survival, cytoskeletal rearrangement, and cell migration. Many cell types, including fibroblasts and smooth muscle cells, express both the alpha and beta receptors. Others have only the alpha receptors (oligodendrocyte progenitor cells, mesothelial cells, liver sinusoidal endothelial cells, astrocytes, platelets, and megakaryocytes) or only the beta receptors (myoblasts, capillary endothelial cells, pericytes, T cells, myeloid hematopoietic cells, and macrophages) (1, 2). Recombinant mouse and human soluble PDGF R beta bind PDGF with high affinity and are potent PDGF antagonists.
Mouse PDGF R alpha Antibody
R&D Systems | Catalog # AF1062

Key Product Details
Validated by
Species Reactivity
Validated:
Cited:
Applications
Validated:
Cited:
Label
Antibody Source
Product Specifications
Immunogen
Leu25-Glu524 (Asp65Glu, Gly439Ala, Thr440Ala)
Accession # P26618
Specificity
Clonality
Host
Isotype
Endotoxin Level
Scientific Data Images for Mouse PDGF R alpha Antibody
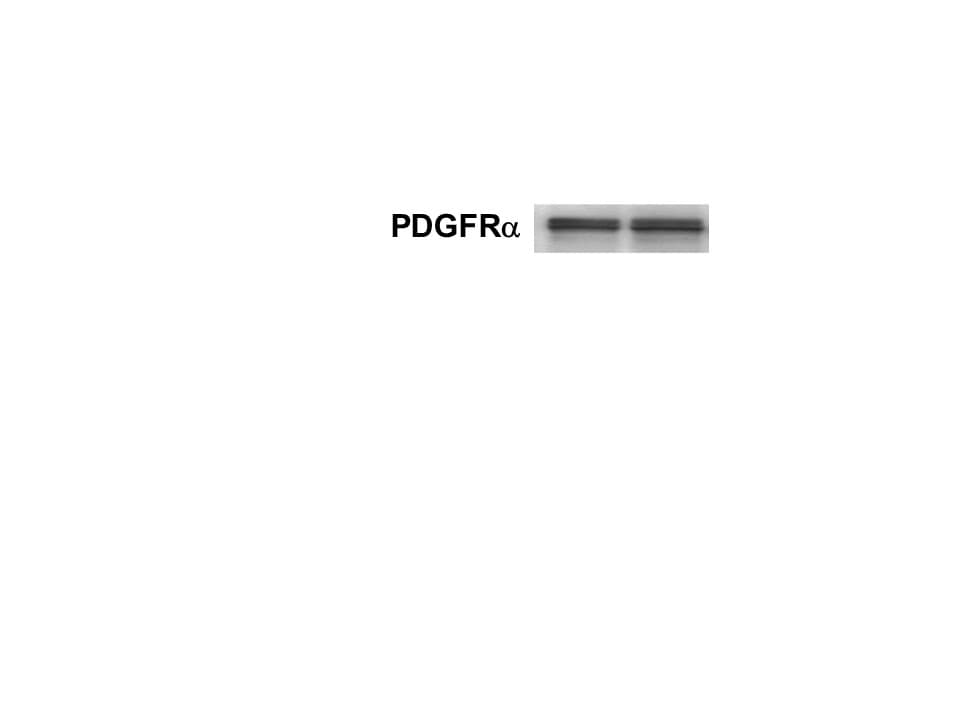
Detection of Mouse PDGF R alpha by Western Blot.
Western blot shows lysates of mouse uterus tissue and mouse lung tissue. PVDF membrane was probed with 1 µg/mL of Goat Anti-Mouse PDGF Ra Antigen Affinity-purified Polyclonal Antibody (Catalog # AF1062) followed by HRP-conjugated Anti-Goat IgG Secondary Antibody (HAF017). Specific bands were detected for PDGF Ra at approximately 160-200 kDa (as indicated). This experiment was conducted under reducing conditions and using Immunoblot Buffer Group 1.
PDGF R alpha in Mouse Embryo.
PDGF Ra was detected in immersion fixed frozen sections of mouse embryo using Goat Anti-Mouse PDGF Ra Antigen Affinity-purified Polyclonal Antibody (Catalog # AF1062) at 15 µg/mL overnight at 4 °C. Tissue was stained using the Anti-Goat HRP-DAB Cell & Tissue Staining Kit (brown; CTS008) and counterstained with hematoxylin (blue). View our protocol for Chromogenic IHC Staining of Frozen Tissue Sections.
PDGF R alpha in Mouse Embryo.
PDGF Ra was detected in immersion fixed frozen sections of mouse embryo using 15 µg/mL Goat Anti-Mouse PDGF Ra Antigen Affinity-purified Polyclonal Antibody (Catalog # AF1062) overnight at 4 °C. Tissue was stained with the Anti-Goat HRP-DAB Cell & Tissue Staining Kit (brown; CTS008) and counterstained with hematoxylin (blue). Specific labeling was localized to the plasma membrane of mesenchymal cells. View our protocol for Chromogenic IHC Staining of Frozen Tissue Sections.
Cell Proliferation Induced by PDGF‑AA and Neutralization by Mouse PDGF R alpha Antibody.
Recombinant Human PDGF-AA (221-AA) stimulates proliferation in the NR6R-3T3 mouse fibroblast cell line in a dose-dependent manner (orange line), as measured by Resazurin (AR002. Proliferation elicited by Recombinant Human PDGF-AA (250 ng/mL) is neutralized (green line) by increasing concentrations of Goat Anti-Mouse PDGF Ra Antigen Affinity-purified Polyclonal Antibody (Catalog # AF1062). The ND50 is typically 0.2-1.6 µg/mL.
Detection of Rat PDGF R alpha by Immunocytochemistry/Immunofluorescence.
Extracellularly applied recombinant human a-syn PFFs induced cytoplasmic a-syn-immunoreactive inclusions in primary BCAS1(+) cell cultures. Immunostaining of oligodendroglial cells incubated with 1?µM a-syn PFFs for 24?h from days 3 (upper) and 4 (lower) after differentiation induction showing the ubiquitous development of thioflavin S-labeled inclusions in PDGFRa(+) cells and BCAS1(+) cells. In contrast, few BCAS1(-)/MBP(+) cells developed thioflavin S-labeled inclusions. Scale bar?=?50?µm. Image collected and cropped by CiteAb from the following publication (https://pubmed.ncbi.nlm.nih.gov/32727582), licensed under a CC-BY licence.
Detection of Mouse PDGF R alpha by Immunocytochemistry/Immunofluorescence.
Rspo3 mRNAs are localized on telopodes that extend away from the cell bodies of the mouse VTTs. VTTs are marked by Lgr5 mRNA (red dots), Rspo3 mRNA (green dots) is localized away from the cell body, PDGFRa antibody mark VTTs cell bodies and telopodes. Scale bar–10?µm, in inset, green arrows point to Rspo3 mRNAs (green dots) localized on PDGFRa telopodes (blue). Telocyte cell body is marked by white dashed line. inset Scale bar–5?µm. Image collected and cropped by CiteAb from the following publication (https://pubmed.ncbi.nlm.nih.gov/32321913), licensed under a CC-BY licence. and PDGFRa (red). Scale bar: 25?µm. Image collected and cropped by CiteAb from the following publication (https://www.nature.com/articles/srep40397), licensed under a CC-BY licence.")
Leptin promotes OPC proliferation. Representative image of cultured OPCs stained with antibodies against LepRb (green) and PDGFRa (red). Scale bar: 25?µm. Image collected and cropped by CiteAb from the following publication (https://www.nature.com/articles/srep40397), licensed under a CC-BY licence.
OPC expresses leptin receptors. Representative images of mouse spinal cord sections, which were double-labeled for LepRb (green) in combination with PDGFRa (red). Spinal cord sections were obtained 7 days after LPC injection; the graph shows quantification (n?=?3). P?=?0.007573 (LepRb flox vs intact CKO), 0.0108779 (LepRb flox vs LPC CKO), ANOVA with Tukey’s post-hoc test. Scale bar: 25?µm. Image collected and cropped by CiteAb from the following publication (https://www.nature.com/articles/srep40397), licensed under a CC-BY licence.
Detection of Mouse PDGF R alpha by Immunocytochemistry/Immunofluorescence.
LPC injection does not enhance leptin expression in the CNS. Representative images of LepRb (green) expression in combination with PDGFRa, GFAP NeuN, and CD11b (red) in the mouse spinal cord with or without LPC injection. Spinal cord sections were obtained 3 days after LPC injection. Graph indicates the relative intensity of leptin protein expression in indicated cell type (n?=?3). P?=?0.287452 (PDGFRa), 0.181059 (GFAP), 0.199972 (NeuN), Student’s t-test, n.s. indicates no significant difference. *P?<?0.05, **P?<?0.01, error bars represent SEM. Scale bar: 25?µm. Image collected and cropped by CiteAb from the following publication (https://www.nature.com/articles/srep40397), licensed under a CC-BY licence.
Detection of Mouse PDGF R alpha by Immunohistochemistry.
PDGFRa driven mouse brain tumor model. Example of early stage tumor growth, as revealed by IHC for proliferation marker Ki67 and PDGFRa. Note high density of Ki67+ proliferating cells in tumor area, increased expression level of PDGFRa, and invasive migration of tumor cells through corpus callosum into contralateral hemisphere. Scale bar: 50 µm. Image collected and cropped by CiteAb from the following publication (https://pubmed.ncbi.nlm.nih.gov/25683249), licensed under a CC-BY licence.
Detection of Mouse PDGF R alpha by Immunocytochemistry/Immunofluorescence.
af1062_mouse-pdgf-r-alpha-affinity-purified-polyclonal-ab-212024165018.jpg
Detection of Mouse PDGF R alpha by Immunocytochemistry/Immunofluorescence.
Endogenous leptin sustains spontaneous OPC proliferation. Representative images of mouse spinal cord sections, which were prepared 7 days (left panels) and 14 days (right panels) after LPC injection and double labeled for BrdU in combination with PDGFRa (upper panels), GSTp (upper panels) and olig2 (lower panels). BrdU was administrated during 3–7 days after LPC injection; the graph shows quantification (n?=?5–8). P?=?0.042915 (PDGFRa and BrdU labeled cells), 0.013560 (Olig2 and BrdU labeled cells 7 days after injection), 0.012111 (GSTp and BrdU labeled cells), 0.009797 (Olig2 and BrdU labeled cells 14 days after injection), Student’s t-test. Scale bar: 50?µm. Image collected and cropped by CiteAb from the following publication (https://www.nature.com/articles/srep40397), licensed under a CC-BY licence.
Detection of Mouse PDGF R alpha by Immunocytochemistry/Immunofluorescence.
Etv5 is necessary and sufficient for proliferation and cell fate bias downstream of Cic loss. Cic-null mouse NSCs (CicnullEmpty), Cic-null mouse NSCs with dominant negative Etv5 (CicnullDN-Etv5), and Cic-wildtype mouse NSCs overexpressing Etv5 (Etv5 overpression) were grown in lineage-directed culture conditions and assessed for their ability to differentiate to oligodendrocytes as determined by immunostaining for Olig2, Pdgfra, and Mbp. Scale bar: 10?µm. Image collected and cropped by CiteAb from the following publication (https://pubmed.ncbi.nlm.nih.gov/31043608), licensed under a CC-BY licence.
Detection of Mouse PDGF R alpha by Immunocytochemistry/Immunofluorescence.
Transplantation of CD11b/LIF transgenic BMCs reduces the numbers of FAPs in dystrophic muscle but does not affect phenotype. To quantify the number of FAPs, transgenic mouse muscle sections were co-labeled with antibodies to PDGFRa (red) and CD31, CD45 (green). Arrowheads indicate FAPs (CD31-CD45-PDGFRa+). Bar?=?50?µm. Image collected and cropped by CiteAb from the following publication (https://pubmed.ncbi.nlm.nih.gov/31243277), licensed under a CC-BY licence.
Detection of Mouse PDGF R alpha by Immunocytochemistry/Immunofluorescence.
Lgr5 is expressed abundantly in mouse villus tip telocytes. d) Lgr5 mRNA (red dots) expressed in PDGFRa+ VTTs that co-express Bmp4 mRNA (green dots). Scale bar–10?µm. Red arrows point to Lgr5 and Bmp4 double positive cells. e) Blow up of the region boxed in d). Scale bar–5?µm. Image collected and cropped by CiteAb from the following publication (https://pubmed.ncbi.nlm.nih.gov/32321913), licensed under a CC-BY licence.
Detection of Mouse PDGFR alpha by Immunohistochemistry
PDGFR alpha driven brain tumors display features of high grade glioma.(a–g) Histopathological analysis of tumor areas by H&E staining shows a high concentration of mitotic figures (a, arrows), high cellularity and nuclear atypia (b), perineuronal satellitosis (c; N, neuronal nuclei), perivascular growth (d), intrafascicular growth (e), subarachnoid spreading (f), and areas of incipient necrosis (g; arrows point to pyknotic nuclei). (h–k) IF labeling of brain tumor sections for cell type specific markers. Nuclei labeled with DAPI are shown in blue. Tumor cells with high PDGFR alpha expression were highly proliferative, as seen by proliferation marker Ki67 (h), and express the OPC cell lineage markers Olig2, Sox2, Sox10, and Ng2, as well as the neural stem cell marker Nestin (i–k). Tumor cells were negative for immunosignal of astroglial marker GFAP, mature oligodendrocyte marker APC-CC1, and neuronal marker NeuN (l–n). Scale bars: 10 μm (a–g), 20 μm (h–n). Image collected and cropped by CiteAb from the following publication (https://pubmed.ncbi.nlm.nih.gov/25683249), licensed under a CC-BY license. Not internally tested by R&D Systems.
Detection of Mouse PDGFR alpha by Immunohistochemistry
PDGFR alpha driven brain tumor model.(a) Schematic diagram of PDGFR alpha J/K knock-in alleles. ATG, start codon; SA, splice acceptor; STOP, PGK-neo cassette. (b) Kaplan-Meier survival curves of 4 mouse mutant cohorts with brain tumors. Mice generally succumbed to subcutaneous fibrosarcomas, and brain tumors were detected by histological analysis. (c) Example of early stage tumor growth, as revealed by IHC for proliferation marker Ki67 and PDGFR alpha. Note high density of Ki67+ proliferating cells in tumor area, increased expression level of PDGFR alpha, and invasive migration of tumor cells through corpus callosum into contralateral hemisphere. (d) H&E staining of an advanced brain tumor growth (asterisk in tumor centre, dashed line demarcates expansion). Scale bars: 50 μm (c, d). Image collected and cropped by CiteAb from the following publication (https://pubmed.ncbi.nlm.nih.gov/25683249), licensed under a CC-BY license. Not internally tested by R&D Systems.
Detection of Mouse PDGFR alpha by Immunocytochemistry/Immunofluorescence
Etv5 is necessary and sufficient for proliferation and cell fate bias downstream of Cic loss. Cic-null mouse NSCs (CicnullEmpty), Cic-null mouse NSCs with dominant negative Etv5 (CicnullDN-Etv5), and Cic-wildtype mouse NSCs overexpressing Etv5 (Etv5 overpression) were grown in lineage-directed culture conditions and assessed for their ability to differentiate to oligodendrocytes as determined by immunostaining for Olig2, Pdgfra, and Mbp. Scale bar: 10?µm. Image collected and cropped by CiteAb from the following publication (https://pubmed.ncbi.nlm.nih.gov/31043608), licensed under a CC-BY licence.
Detection of Mouse PDGFR alpha by Immunocytochemistry/Immunofluorescence
LPC injection does not enhance leptin expression in the CNS.(a) Representative images of MBP expression in a mouse spinal cord 14 days after LPC injection are shown; the graph shows quantification of the demyelinating area in the dorsal spinal cord (n = 3–4). P = 0.001542, Student’s t-test. (b) Representative images of NeuN expression in a mouse spinal cord 14 days after LPC injection; the graph shows quantification of the density of NeuN-positive cells in the spinal cord (n = 3). P = 0.299940, Student’s t-test, n.s. indicates no significant difference. (c) Quantification of leptin protein expression in indicated organs. Tissues were obtained from the mice 3 days after LPC injection (n = 3 for control, 4 for LPC injection). P = 0.318966 (adipose tissue), 0.10446 (brain stem), 0.332281 (cerebellum), 0.345245 (liver), 0.453104 (kidney), 0.098135 (heart), 0.335722 (lung), 0.236771 (muscle), 0.44662 (spleen), 0.465966 (stomach). Student’s t-test. n.s. indicates no significant difference. (d) Quantification of spinal cord leptin protein 3 days after LPC injection (n = 3 for control, 4 for LPC injection). P = 0.026865, Student’s t-test. (e) Quantification of spinal cord leptin mRNA 3 days after LPC injection (n = 6). P = 0.324930, Student’s t-test, n.s. indicates no significant difference. (f) Representative images of LepRb (green) expression in combination with PDGFR alpha, GFAP NeuN, and CD11b (red) in the mouse spinal cord with or without LPC injection. Spinal cord sections were obtained 3 days after LPC injection. Graph indicates the relative intensity of leptin protein expression in indicated cell type (n = 3). P = 0.287452 (PDGFR alpha ), 0.181059 (GFAP), 0.199972 (NeuN), Student’s t-test, n.s. indicates no significant difference. *P < 0.05, **P < 0.01, error bars represent SEM. Scale bars; 100 μm for (a and b), 25 μm for (f). Image collected and cropped by CiteAb from the following publication (https://www.nature.com/articles/srep40397), licensed under a CC-BY license. Not in
Detection of Mouse PDGFR alpha by Immunocytochemistry/Immunofluorescence
Leptin promotes OPC proliferation.(a) Representative image of cultured OPCs stained with antibodies against LepRb (green) and PDGFR alpha (red). Scale bar: 25 μm. (b) Relative BrdU incorporation into the OPC obtained from the brain (left graph) and spinal cord (right graph). Cells were treated with recombinant leptin for 48 h (n = 4). (Left graph) P = 0.005993 (control vs 10 ng/mL), 0.045616 (control vs 100 ng/mL), (Right graph) P = 0.004456 (control vs 10 ng/mL), 0.017859 (control vs 100 ng/mL). (c) Relative BrdU incorporation into the OPC after leptin stimulation (10 ng/ml) with U0126 (20 μM), a MEK inhibitor (n = 4 for brain OPCs, n = 3 for spinal cord OPCs). (Left graph) P = 0.019753 (control vs leptin), 0.039433 (leptin vs leptin + U0126), (Right graph) P = 0.045545 (control vs leptin), 0.04486 (leptin vs leptin + U0126). (d) Representative images of western blotting (upper panels) and quantitative analysis of ERK phosphorylation (lower graph) are shown. OPCs were treated with leptin (10 ng/ml) under indicated periods (n = 3). P = 0.006352 (2 min), 0.016571 (5 min), 0.017675 (10 min), 0.024100 (15 min), 0.081342 (30 min). *P < 0.05, **P < 0.01, ANOVA with Tukey’s post-hoc test. Image collected and cropped by CiteAb from the following publication (https://www.nature.com/articles/srep40397), licensed under a CC-BY license. Not internally tested by R&D Systems.
Detection of Rat PDGFR alpha by Immunocytochemistry/Immunofluorescence
Extracellularly applied recombinant human alpha -syn PFFs induced cytoplasmic alpha -syn-immunoreactive inclusions in primary BCAS1(+) cell cultures. a Confocal images of BCAS1(+) cells, which were incubated with 1 μM alpha -syn PFFs for 24 h from day 4 after differentiation induction, showing the intracellular inclusions labeled with both anti-alpha -syn antibody and thioflavin S. Scale bar = 5 μm. b Immunostaining of oligodendroglial cells incubated with 1 μM alpha -syn PFFs for 24 h from days 3 (upper) and 4 (lower) after differentiation induction showing the ubiquitous development of thioflavin S-labeled inclusions in PDGFR alpha (+) cells and BCAS1(+) cells. In contrast, few BCAS1(−)/MBP(+) cells developed thioflavin S-labeled inclusions. Scale bar = 50 μm. c The percentages of oligodendroglial cells containing thioflavin S-labeled inclusions were compared between BCAS1(−)/PDGFR alpha (+) cells and BCAS1(+)/PDGFR alpha (+) cells (upper, performed on day 3), and between BCAS1(+)/MBP(+) cells and BCAS1(−)/MBP(+) cells (lower, performed on day 4). N = 4, respectively, independent culture, Mann–Whitney, p* < 0.05 Image collected and cropped by CiteAb from the following publication (https://pubmed.ncbi.nlm.nih.gov/32727582), licensed under a CC-BY license. Not internally tested by R&D Systems.
Detection of Mouse PDGFR alpha by Immunocytochemistry/Immunofluorescence
Transplantation of CD11b/LIF transgenic BMCs reduces the numbers of FAPs in dystrophic muscle but does not affect phenotype. a QPCR analysis shows that TA muscles from LIF BMT/mdx recipients have reduced Pdgfra gene expression. N = 7 or 8 for WT BMT/mdx and LIF BMT/mdx data sets, respectively, * indicates significantly different from WT BMT/mdx recipients at P < 0.05. P-values based on two-tailed t-test. For all histograms in the figure, the bars indicate mean ± sem. b To quantify the number of FAPs, muscle sections were co-labeled with antibodies to PDGFR alpha (red) and CD31, CD45 (green). Arrowheads indicate FAPs (CD31-CD45-PDGFR alpha +). Bar = 50 μm. c Fewer FAPs (CD31-CD45-PDGFR alpha +) in TA cross-sections of LIF BMT/mdx recipients compared to WT BMT/mdx recipients. N = 5 for each data set. d There was no detectible change in phenotype of PDGFR alpha + cells assayed for co-expression of the fibrogenic marker HSP47. e FACS plots demonstrating strategy for sorting FAPs (Hoechst + CD11b-CD31-CD45-PDGFR alpha +). Fibroblasts derived from FAPs were stimulated with LIF (10 ng/ml) and/or TGF beta 1 (10 ng/ml) for 3 h (f–h) or 3 days (i–k) and assayed by QPCR for Ctgf (f, i), Fn1 (g, j), and Col1a1 (h, k). N = 4 technical replicates for each data set. Significant findings were verified with biological replicates of cells sorted from independent donors. * Indicates significantly different from control cultures, # indicates significantly different from TGF beta 1 treated cultures, and Φ indicates significantly different from LIF-treated cultures at P < 0.05. P-values based on ANOVA with Tukey’s multiple comparison test. Source data are provided as a Source Data file Image collected and cropped by CiteAb from the following publication (https://pubmed.ncbi.nlm.nih.gov/31243277), licensed under a CC-BY license. Not internally tested by R&D Systems.
Detection of Mouse PDGFR alpha by Immunocytochemistry/Immunofluorescence
Lgr5 is expressed abundantly in villus tip telocytes.a smFISH of Lgr5, DAPI in blue, Scale bar–20 µm. b Blow up of villus tip, Scale bar–10 µm. In a, b thin white arrows point at autofluorescent blobs. c blow up of crypt, Scale bar–10 µm. Red arrows in b–c point to Lgr5 positive cells. dLgr5 mRNA (red dots) expressed in PDGFRa+ VTTs that co-express Bmp4 mRNA (green dots). Scale bar–10 µm. Red arrows point to Lgr5 and Bmp4 double positive cells. e Blow up of the region boxed in d. Scale bar–5 µm. fLgr5 mRNA concentrations in VTTs are comparable to those in Lgr5+ crypt base columnar cells (n = 25 cells examined over 2 mice for each region). Boxes show 25–75 percentiles of the smFISH expression, horizontal red lines are medians. Whiskers, extend to the most extreme data point within 1.5× the interquartile range (IQR) from the box; g) Rspo3 mRNAs are localized on telopodes that extend away from the cell bodies of the VTTs. VTTs are marked by Lgr5 mRNA (red dots), Rspo3 mRNA (green dots) is localized away from the cell body, PDGFRa antibody mark VTTs cell bodies and telopodes. Scale bar–10 µm, in inset, green arrows point to Rspo3 mRNAs (green dots) localized on PDGFRa telopodes (blue). Telocyte cell body is marked by white dashed line. inset Scale bar–5 µm. Image collected and cropped by CiteAb from the following publication (https://pubmed.ncbi.nlm.nih.gov/32321913), licensed under a CC-BY license. Not internally tested by R&D Systems.
Detection of Mouse PDGFR alpha by Immunohistochemistry
PDGFR alpha driven brain tumors display features of high grade glioma.(a–g) Histopathological analysis of tumor areas by H&E staining shows a high concentration of mitotic figures (a, arrows), high cellularity and nuclear atypia (b), perineuronal satellitosis (c; N, neuronal nuclei), perivascular growth (d), intrafascicular growth (e), subarachnoid spreading (f), and areas of incipient necrosis (g; arrows point to pyknotic nuclei). (h–k) IF labeling of brain tumor sections for cell type specific markers. Nuclei labeled with DAPI are shown in blue. Tumor cells with high PDGFR alpha expression were highly proliferative, as seen by proliferation marker Ki67 (h), and express the OPC cell lineage markers Olig2, Sox2, Sox10, and Ng2, as well as the neural stem cell marker Nestin (i–k). Tumor cells were negative for immunosignal of astroglial marker GFAP, mature oligodendrocyte marker APC-CC1, and neuronal marker NeuN (l–n). Scale bars: 10 μm (a–g), 20 μm (h–n). Image collected and cropped by CiteAb from the following publication (https://pubmed.ncbi.nlm.nih.gov/25683249), licensed under a CC-BY license. Not internally tested by R&D Systems.
Detection of Mouse PDGFR alpha by Immunocytochemistry/Immunofluorescence
Lgr5 is expressed abundantly in villus tip telocytes.a smFISH of Lgr5, DAPI in blue, Scale bar–20 µm. b Blow up of villus tip, Scale bar–10 µm. In a, b thin white arrows point at autofluorescent blobs. c blow up of crypt, Scale bar–10 µm. Red arrows in b–c point to Lgr5 positive cells. dLgr5 mRNA (red dots) expressed in PDGFRa+ VTTs that co-express Bmp4 mRNA (green dots). Scale bar–10 µm. Red arrows point to Lgr5 and Bmp4 double positive cells. e Blow up of the region boxed in d. Scale bar–5 µm. fLgr5 mRNA concentrations in VTTs are comparable to those in Lgr5+ crypt base columnar cells (n = 25 cells examined over 2 mice for each region). Boxes show 25–75 percentiles of the smFISH expression, horizontal red lines are medians. Whiskers, extend to the most extreme data point within 1.5× the interquartile range (IQR) from the box; g) Rspo3 mRNAs are localized on telopodes that extend away from the cell bodies of the VTTs. VTTs are marked by Lgr5 mRNA (red dots), Rspo3 mRNA (green dots) is localized away from the cell body, PDGFRa antibody mark VTTs cell bodies and telopodes. Scale bar–10 µm, in inset, green arrows point to Rspo3 mRNAs (green dots) localized on PDGFRa telopodes (blue). Telocyte cell body is marked by white dashed line. inset Scale bar–5 µm. Image collected and cropped by CiteAb from the following publication (https://pubmed.ncbi.nlm.nih.gov/32321913), licensed under a CC-BY license. Not internally tested by R&D Systems.
Detection of Mouse PDGFR alpha by Immunocytochemistry/Immunofluorescence
OPC expresses leptin receptors.(a) Representative images of spinal cord sections, which were double-labeled for LepRb (green) in combination with PDGFR alpha (red). Spinal cord sections were obtained 7 days after LPC injection; the graph shows quantification (n = 3). P = 0.007573 (LepRb flox vs intact CKO), 0.0108779 (LepRb flox vs LPC CKO), ANOVA with Tukey’s post-hoc test. (b) Relative expression of leptin receptors mRNA in PDGFR alpha -positive OPC obtained from the brain of PDGFR alpha -creERT:: Lepr flox/flox mice and +/+::Lepr flox/flox mice (n = 5,6). P = 0.005878 (LepRa), 0.010306 (LepRb), 0.001535 (LepRc), 0.003169 (LepRd), 0.030459 (LepRe), Student’s t-test. (c) Representative images of spinal cord sections which were double labeled for BrdU in combination with PDGFR alpha (left panels) and GSTπ (right panels). Sections were prepared 7 days (left panels) and 14 days (right panels) after LPC injection. BrdU was administrated during 3–7 days after LPC injection; the graph shows quantification (n = 5–8). P = 0.029791(PDGFR alpha and BrdU labeled cells), 0.028870 (GSTπ and BrdU labeled cells), Student’s t-test. (d) Representative images of PDGFR alpha expression in the intact spinal cord of PDGFR alpha -creERT:: Lepr flox/flox mice and +/+::Lepr flox/flox mice; the graph shows quantification (n = 3–4). P = 0.404999, Student’s t-test, n.s. indicates no significant difference. (e) Representative images of APC expression in the intact spinal cord of PDGFR alpha -creERT:: Lepr flox/flox mice and +/+::Lepr flox/flox mice; the graph shows quantification (n = 3). P = 0.495667, Student’s t-test, n.s. indicates no significant difference. (f) Representative spinal cord section of PDGFR alpha -creERT:: Lepr flox/flox mice, which were prepared 14 days after LPC injection and stained with MBP; the graph shows quantification of the demyelinating area in the dorsal spinal cord (n = 7 for control, 10 for CKO). P = 0.030688, Student’s t-test. (g) Representative spinal cord sections which were labeled for CD11b. Sections were
Detection of Mouse PDGFR alpha by Immunocytochemistry/Immunofluorescence
Endogenous leptin sustains spontaneous OPC proliferation.(a) Representative images of spinal cord sections, which were prepared 7 days (left panels) and 14 days (right panels) after LPC injection and double labeled for BrdU in combination with PDGFR alpha (upper panels), GSTπ (upper panels) and olig2 (lower panels). BrdU was administrated during 3–7 days after LPC injection; the graph shows quantification (n = 5–8). P = 0.042915 (PDGFR alpha and BrdU labeled cells), 0.013560 (Olig2 and BrdU labeled cells 7 days after injection), 0.012111 (GSTπ and BrdU labeled cells), 0.009797 (Olig2 and BrdU labeled cells 14 days after injection), Student’s t-test. (b) Representative spinal cord sections, which were prepared 14 days after LPC injection and stained with MBP are shown; the graph shows quantification (n = 6). P = 0.025243, Student’s t-test. (c) Representative images of spinal cord section, which were prepared 7 days after LPC injection and labeled for CD11b; the graph shows quantification (n = 4). P = 0.213763, Student’s t-test, n.s. indicates no significant difference. *P < 0.05, **P < 0.01, error bars represent SEM. Scale bar: 50 μm for high magnification images in a, 100 μm for others. Image collected and cropped by CiteAb from the following publication (https://www.nature.com/articles/srep40397), licensed under a CC-BY license. Not internally tested by R&D Systems.
Detection of Mouse PDGFR alpha by Immunohistochemistry
PDGFR alpha driven brain tumors display features of high grade glioma.(a–g) Histopathological analysis of tumor areas by H&E staining shows a high concentration of mitotic figures (a, arrows), high cellularity and nuclear atypia (b), perineuronal satellitosis (c; N, neuronal nuclei), perivascular growth (d), intrafascicular growth (e), subarachnoid spreading (f), and areas of incipient necrosis (g; arrows point to pyknotic nuclei). (h–k) IF labeling of brain tumor sections for cell type specific markers. Nuclei labeled with DAPI are shown in blue. Tumor cells with high PDGFR alpha expression were highly proliferative, as seen by proliferation marker Ki67 (h), and express the OPC cell lineage markers Olig2, Sox2, Sox10, and Ng2, as well as the neural stem cell marker Nestin (i–k). Tumor cells were negative for immunosignal of astroglial marker GFAP, mature oligodendrocyte marker APC-CC1, and neuronal marker NeuN (l–n). Scale bars: 10 μm (a–g), 20 μm (h–n). Image collected and cropped by CiteAb from the following publication (https://pubmed.ncbi.nlm.nih.gov/25683249), licensed under a CC-BY license. Not internally tested by R&D Systems.
Detection of PDGF R alpha in 3T3-L1 cells by Flow Cytometry
3T3-L1 cells were stained with Goat Anti-Mouse PDGF R alpha Antigen Affinity-purified Polyclonal Antibody (Catalog # AF1062, filled histogram) or isotype control antibody (Catalog # 4-001-A, open histogram) followed by Allophycocyanin-conjugated Anti-Goat IgG Secondary Antibody (Catalog # F0108). View our protocol for Staining Membrane-associated Proteins.
Detection of Mouse PDGFR alpha by Immunohistochemistry
PDGFR alpha and ciliary axonemes early in development. (A) High-resolution microscopy and (B,C) 3D IHC reconstructions of 15 µm wildtype tissue show phosphorylated PDGFR alpha (red) present along ciliary axonemes (acetylated tubulin, green) (arrowheads highlighted in C) at E13. By P0, the receptor localizes to the endocardium where cilia are absent (arrows). Image collected and cropped by CiteAb from the following open publication (https://pubmed.ncbi.nlm.nih.gov/33805717), licensed under a CC-BY license. Not internally tested by R&D Systems.
Detection of Mouse PDGFR alpha by Immunohistochemistry
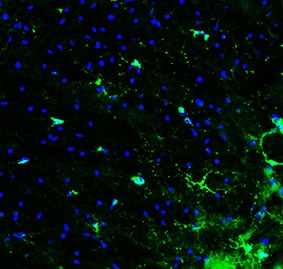
Impact of LPC surgery on mice subjected to running wheel. (A) Workflow and representative eriochrome cyanine-stained sections with lesion in the ventrolateral white matter delineated by dashed lines. Figure was drawn using BioRender. (B) Representative images of LPC lesion (left) and contralateral normal appearing white matter (right) 4 days post injury stained for mature oligodendrocytes (CC1) in red, OPCs (PDGFR alpha ) in green, oligodendrocyte lineage cells (OLIG2) in white, and DNA (DAPI) in blue. (C) Representative images of LPC lesion 4 days post injury stained for myelin and myelin debris (MBP) in red, axons (NFH) in green, and astrocytes (GFAP) in white, and DNA (DAPI) in blue. In both (B) and (C), the lesion is outlined by the irregular dashed line while the non-involved contralateral site is denoted by the rectangle dashed line. Scale bar represents 100 μm. Image collected and cropped by CiteAb from the following open publication (https://pubmed.ncbi.nlm.nih.gov/33790323), licensed under a CC-BY license. Not internally tested by R&D Systems.
Detection of Mouse PDGFR alpha by Immunohistochemistry
PDGFR alpha and ciliary axonemes early in development. (A) High-resolution microscopy and (B,C) 3D IHC reconstructions of 15 µm wildtype tissue show phosphorylated PDGFR alpha (red) present along ciliary axonemes (acetylated tubulin, green) (arrowheads highlighted in C) at E13. By P0, the receptor localizes to the endocardium where cilia are absent (arrows). Image collected and cropped by CiteAb from the following open publication (https://pubmed.ncbi.nlm.nih.gov/33805717), licensed under a CC-BY license. Not internally tested by R&D Systems.
Detection of Mouse PDGFR alpha by Immunohistochemistry
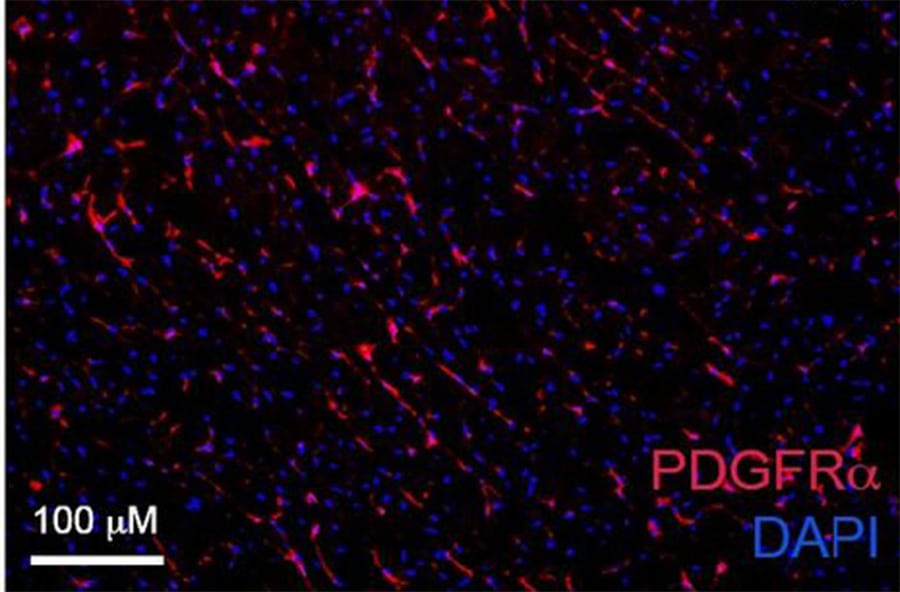
Reduced number of MSCs at the periodontitis site in aged mice. Immunofluorescence images show the number of platelet-derived growth factor receptor alpha (PDGFR alpha )+ MSCs (red) in the furcation area in young and aged mice. Cell nuclei were stained with DAPI (blue). Bar: 100 µm. The graph shows the quantitative analysis indicating that the number of PDGFR alpha + Mesenchymal stem cells (MSCs) is decreased in aged mice, more prominently at day-10 after ligation. The bar graph represents the mean ± standard deviation of at least three independent samples. * p < 0.05, ** p < 0.01, *** p < 0.001, two-way ANOVA, Tukey test (n = 3). Image collected and cropped by CiteAb from the following open publication (https://pubmed.ncbi.nlm.nih.gov/33143068), licensed under a CC-BY license. Not internally tested by R&D Systems.
Detection of Mouse PDGFR alpha by Immunohistochemistry
Nuclear entry of SIRT2 in OPCs during remyelination is impaired in the aged mice in vivo.a Primary culture of various types of cells from P0 rat cortex. b qRT-PCR of seven members of sirtuins in primary cultured OPCs and mature oligodendrocytes from the cortex of P0 rat (n = 3). c qRT-PCR of sirt2 in primary cultured various types of cells from the cortex of P0 rat (n = 3). d–f Immunofluorescence and quantification of SIRT2+ cells in the cortex of mice at different ages (n = 3). Scale bar, 10 μm (d), 50 μm (upper panel images of f), 5 μm (lower panel images of f). g–h Immunofluorescence of SIRT2 in the cortex of marmosets at postnatal day 3 (P3, g) or age of 8 years (h). Scale bar, 50 μm. i Immunohistochemistry of SIRT2 in the cortex of human at age of 53 years. Scale bar, 20 μm. j, k Relative SIRT2 protein level in brains of WT young (6 M) and old (18 M) mice (n = 3). l–o Immunofluorescence and quantification of SIRT2+ OPCs and nuclear SIRT2+ OPCs in corpus callosum of WT young and old mice (n = 3). NL, non-lesion, L, demyelination lesion induced by LPC at 5 dpl. Scale bar, 10 μm. All data are presented as mean ± SEM. *p < 0.05, **p < 0.01, ***p < 0.001 by two-tailed t-test (k) or one-way ANOVA followed by Tukey’s post hoc test (m–o). In all instances ***p < 0.001. n.s. no significance. In (k), **p = 0.004; in (m), **p = 0.002 (L-Young vs. L-Old); in (n), **p = 0.007 (L-Young vs. L-Old). Image collected and cropped by CiteAb from the following open publication (https://pubmed.ncbi.nlm.nih.gov/35264567), licensed under a CC-BY license. Not internally tested by R&D Systems.
Detection of Mouse PDGFR alpha by Immunohistochemistry
PDGFR alpha and ciliary axonemes early in development. (A) High-resolution microscopy and (B,C) 3D IHC reconstructions of 15 µm wildtype tissue show phosphorylated PDGFR alpha (red) present along ciliary axonemes (acetylated tubulin, green) (arrowheads highlighted in C) at E13. By P0, the receptor localizes to the endocardium where cilia are absent (arrows). Image collected and cropped by CiteAb from the following open publication (https://pubmed.ncbi.nlm.nih.gov/33805717), licensed under a CC-BY license. Not internally tested by R&D Systems.
Detection of Mouse PDGF R alpha by Immunohistochemistry.
Primary goat anti-mouse PDGFRa (1:300) with Donkey anti-goat AF647 (1:500) on adult mouse pancreas. Image from a verified customer review.
Detection of Mouse PDGF R alpha by Immunohistochemistry
MI day 7 fibroblasts showed an anti-angiogenic myofibroblast phenotype profile. a Volcano plot and major upregulated processes. bThbs1 expression was significantly increased; n = 3 per group. c LV infarct region from MI day 7 stained for cardiac fibroblast marker PDGFR alpha (green), Thbs1 (red), and DAPI (blue). Thbs1 was significantly increased within regions staining positive for PDGFR alpha ; n = 4 day 0, n = 5 MI day 7. d Immunoblot analysis of Thbs1 in cardiac fibroblast secretome. MI significantly increased cardiac fibroblast secretion of Thbs1 at MI day 7; n = 3 per group; densitometry normalized to total membrane stain. *p < 0.05 versus day 0; $p < 0.05 versus MI day 3 Image collected and cropped by CiteAb from the following open publication (https://pubmed.ncbi.nlm.nih.gov/30635789), licensed under a CC-BY license. Not internally tested by R&D Systems.Applications for Mouse PDGF R alpha Antibody
Flow Cytometry
Sample: 3T3-L1 mouse embryonic fibroblast adipose-like cell line
Immunohistochemistry
Sample: Immersion fixed frozen sections of mouse embryo
Western Blot
Sample: Mouse uterus tissue and mouse lung tissue
Neutralization
Reviewed Applications
Read 17 reviews rated 4.6 using AF1062 in the following applications:
Flow Cytometry Panel Builder
Bio-Techne Knows Flow Cytometry
Save time and reduce costly mistakes by quickly finding compatible reagents using the Panel Builder Tool.
Advanced Features
- Spectra Viewer - Custom analysis of spectra from multiple fluorochromes
- Spillover Popups - Visualize the spectra of individual fluorochromes
- Antigen Density Selector - Match fluorochrome brightness with antigen density

Formulation, Preparation, and Storage
Purification
Reconstitution
Reconstitute at 0.2 mg/mL in sterile PBS. For liquid material, refer to CoA for concentration.
Formulation
*Small pack size (-SP) is supplied either lyophilized or as a 0.2 µm filtered solution in PBS.
Shipping
Stability & Storage
- 12 months from date of receipt, -20 to -70 °C as supplied.
- 1 month, 2 to 8 °C under sterile conditions after reconstitution.
- 6 months, -20 to -70 °C under sterile conditions after reconstitution.
Calculators
Background: PDGF R alpha
References
- Betsholtz, C. et al. (2001) BioEssays 23:494.
- Ostman, A. and A.H. Heldin (2001) Advances in Cancer Research 80:1.
- Gilbertson, D. et al. (2001) J. Biol. Chem. 276:27406.
- LaRochells, W.J. et al. (2001) Nature Cell Biol. 3:517.
Long Name
Alternate Names
Gene Symbol
UniProt
Additional PDGF R alpha Products
Product Documents for Mouse PDGF R alpha Antibody
Certificate of Analysis
To download a Certificate of Analysis, please enter a lot or batch number in the search box below.
Note: Certificate of Analysis not available for kit components.
Product Specific Notices for Mouse PDGF R alpha Antibody
For research use only
Citations for Mouse PDGF R alpha Antibody
 Powered by Bioz
Customer Reviews for Mouse PDGF R alpha Antibody (17)
Have you used Mouse PDGF R alpha Antibody?
Submit a review and receive an Amazon gift card!
$25/€18/£15/$25CAN/¥2500 Yen for a review with an image
$10/€7/£6/$10CAN/¥1110 Yen for a review without an image
Submit a review
Customer Images
-
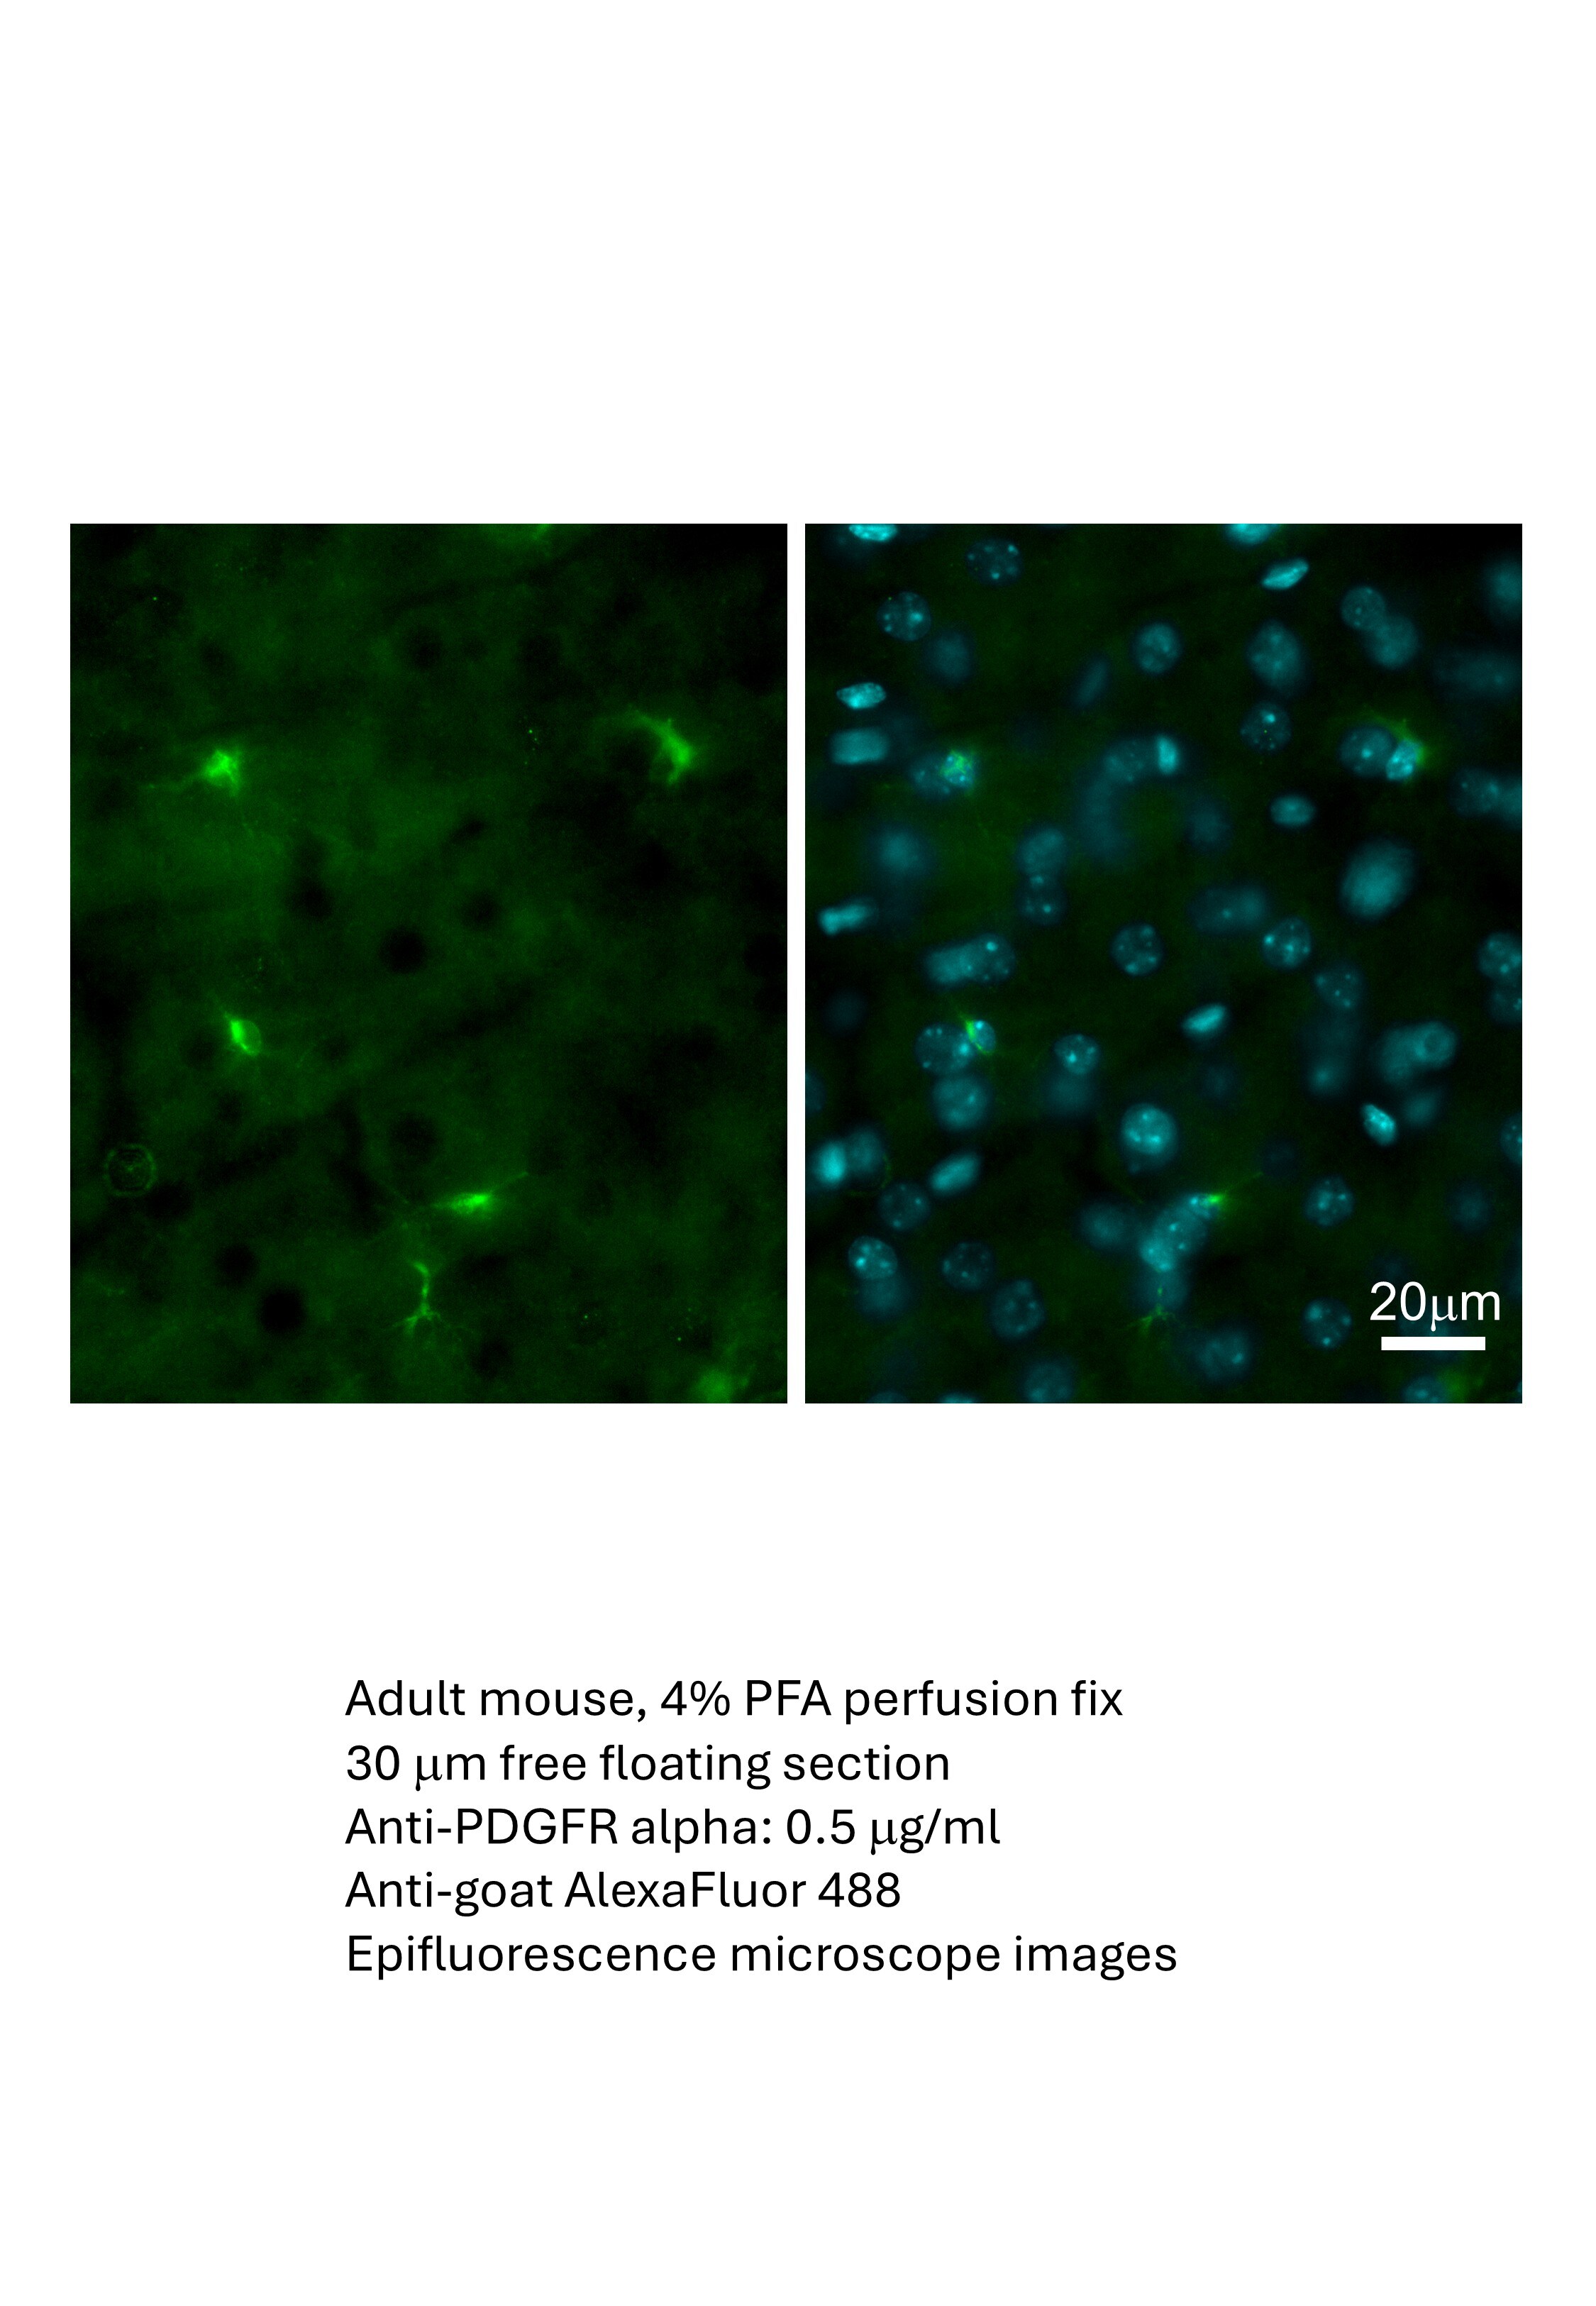
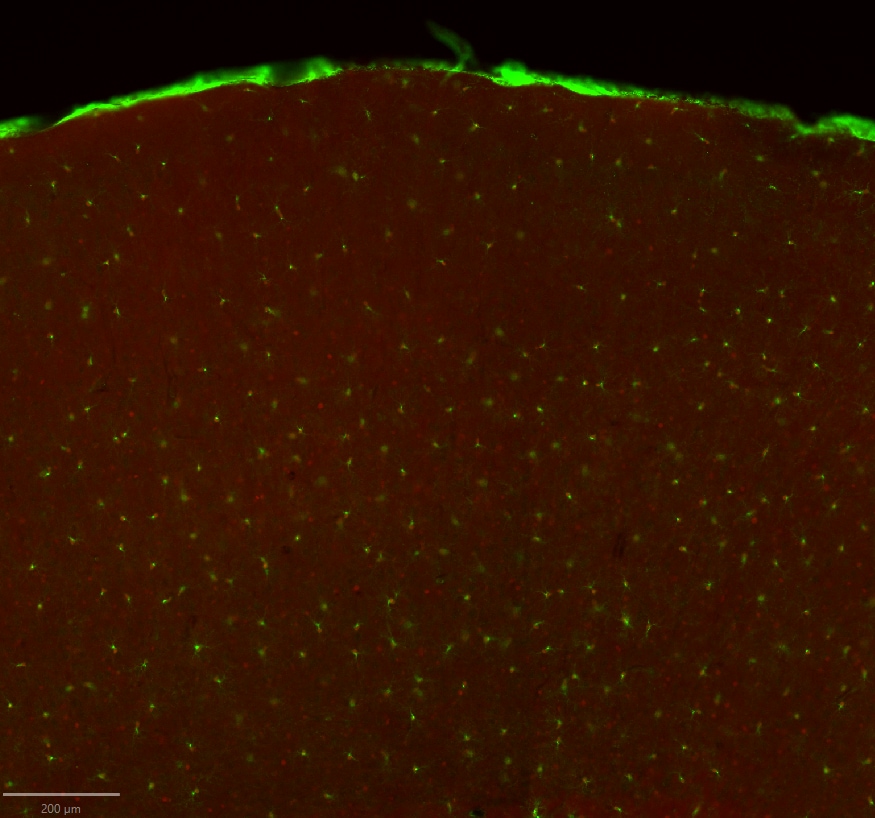
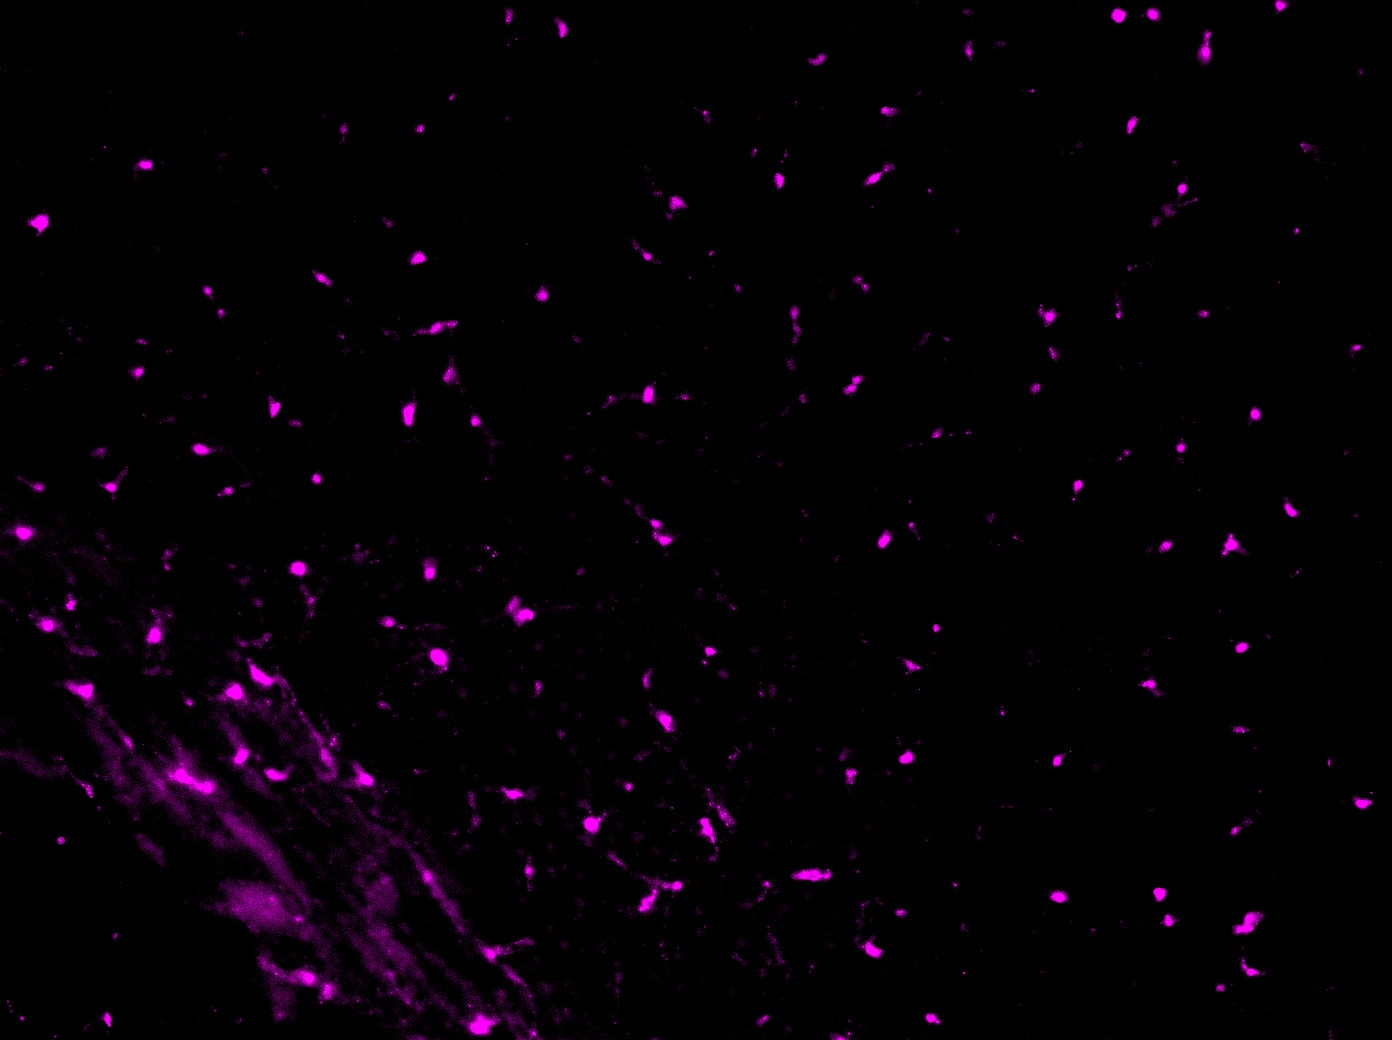
Application: Immunohistochemistry-FrozenSample Tested: Brain (cortex) tissueSpecies: MouseVerified Customer | Posted 04/09/2026adult mouse cerebral cortex (gray matter)Adult mouse, 4% PFA perfusion fix 30 um free floating section Anti-PDGFR alpha: 0.5 ug/ml Anti-goat AlexaFluor 488

-
Application: Immunocytochemistry/ImmunofluorescenceSample Tested: fixed mouse brainSpecies: MouseVerified Customer | Posted 07/14/20231:100, free-floating
-
Application: Immunocytochemistry/ImmunofluorescenceSample Tested: Adult pancreasSpecies: MouseVerified Customer | Posted 10/20/2022Primary goat anti-mouse PDGFRa (1:300) with Donkey anti-goat AF647 (1:500) on adult mouse pancreas. It works well and clearly shows specific staining of fibroblasts.
-
Application: Immunocytochemistry/ImmunofluorescenceSample Tested: Brain stem tissueSpecies: Mouse Embryo and MouseVerified Customer | Posted 06/28/2022
-
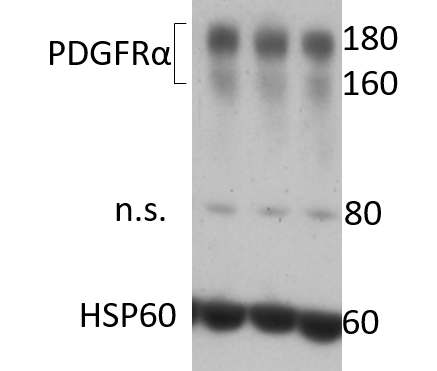
Application: Western BlotSample Tested: Adult heartSpecies: MouseVerified Customer | Posted 05/10/20203 mice hearts extractions after MI. HSP60 was used as loading control. There is a non specific band around 80 kDa.
-
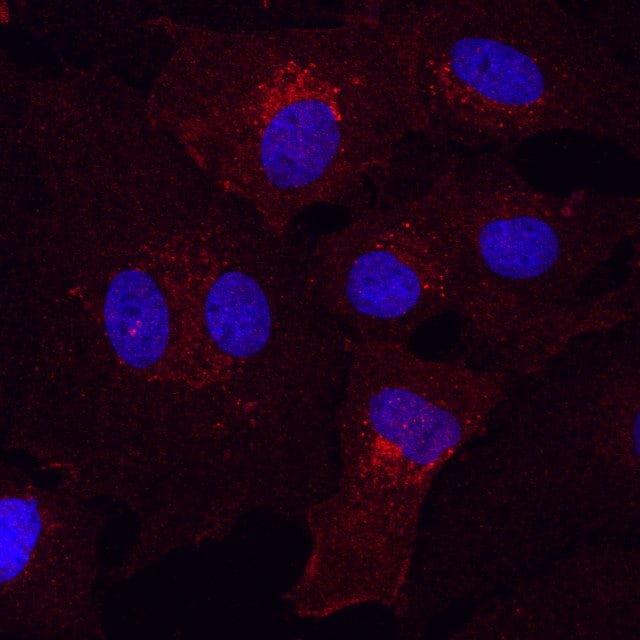
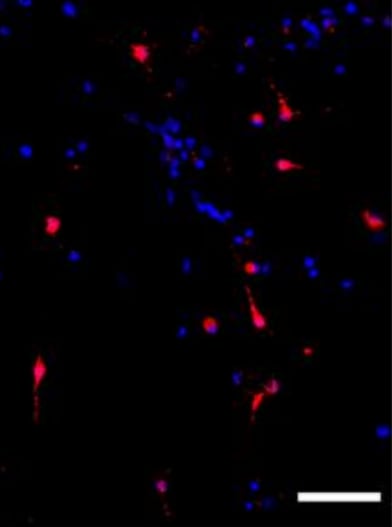
Application: Immunocytochemistry/ImmunofluorescenceSample Tested: primary cardiac fibroblastsSpecies: RatVerified Customer | Posted 05/10/2020rat primary cardiac fibroblasts, PDGFRa in red, DAPI in blue
-
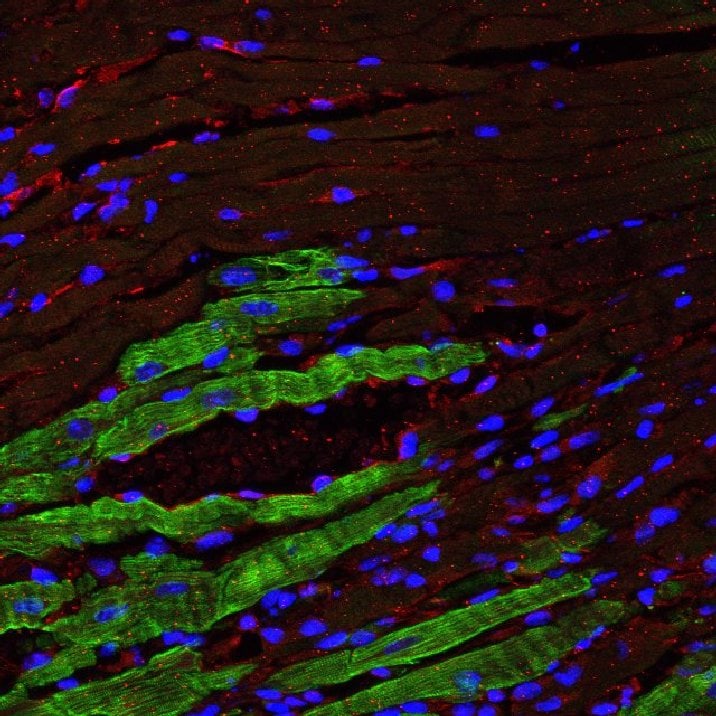
Application: ImmunohistochemistrySample Tested: Adult heartSpecies: MouseVerified Customer | Posted 05/10/2020mouse heart post MI, troponin I in green, PDGFRa in red, DAPI in blue
-
Application: Immunocytochemistry/ImmunofluorescenceSample Tested: Adult brainSpecies: MouseVerified Customer | Posted 10/20/2019Dilution 1:200
-
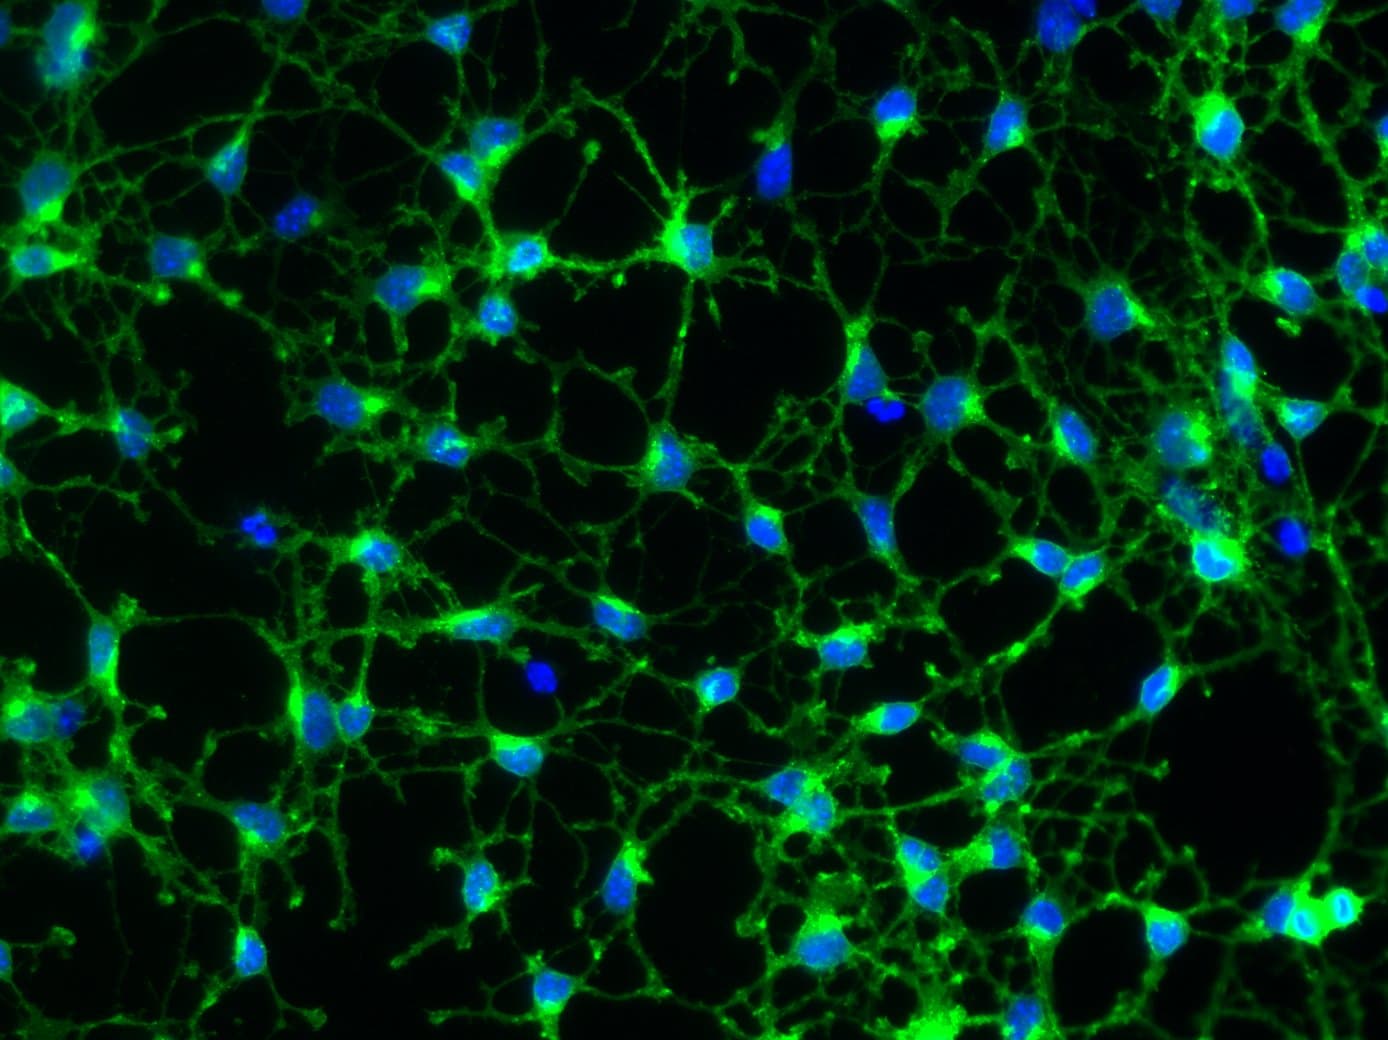
Application: ImmunocytochemistrySample Tested: Primary Oligodendrocyte Precursor CellsSpecies: MouseVerified Customer | Posted 07/12/2019Immunopanned oligodendrocyte precursor cells stained with PDGFR alpha antibody diluted to 0.4 micrograms/mL.Cells were obtained via immunopanning Foo et al. 2011 and grown in a defined, serum-free media for 3 days. Cells were fixed with 4% PFA for 10 mins, washed 3 times with D-PBS containing Ca2+ and Mg2+, blocked in D-PBS containing 10% donkey serum for 30min and stained overnight with PDGFR alpha antibody final concentration 0.4 micrograms/mL in D-PBS containing 2% donkey serum and 2% BSA. The next day, cells were washed with D-PBS three times and incubated with Alexa Fluor 488 conjugated Jackson Immuno donkey anti-goat IgG H+L for 30 mins at room temperature. Cells were then washed 3 times with D-PBS and visualized.
-
Application: Immunohistochemistry-FrozenSample Tested: mouse spinal cordSpecies: MouseVerified Customer | Posted 03/15/2019
-
Application: Immunocytochemistry/ImmunofluorescenceSample Tested: Spinal cord tissueSpecies: MouseVerified Customer | Posted 01/16/2019
-
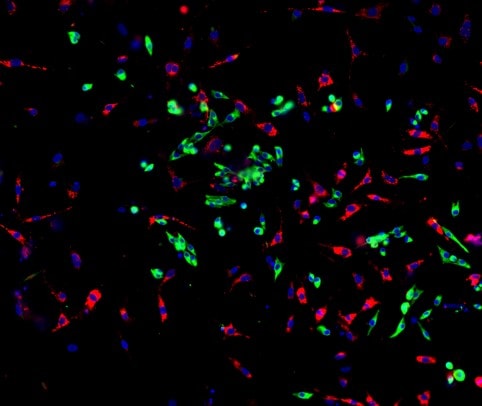
Application: ImmunocytochemistrySample Tested: mouse skeletal muscle primary cells, mouse skeletal muscle-derived cells and mouse skeletal muscle cellsSpecies: MouseVerified Customer | Posted 08/12/2018Mouse skeletal muscle-derived cells were fixed in methanol, and stained with goat anti-mouse PDGFRa antibody (AF1062) (red) and rabbit anti-desmin antibody (green). PDGFRa was expressed in fibroblasts but not in desmin+ myoblasts.
-
Application: Immunocytochemistry/ImmunofluorescenceSample Tested: IPS2 induced pluripotent stem cellsSpecies: MouseVerified Customer | Posted 07/27/2018
-
Application: Western BlotSample Tested: IPS2 induced pluripotent stem cellsSpecies: MouseVerified Customer | Posted 01/25/2018
-
Application: Immunocytochemistry/ImmunofluorescenceSample Tested: EmbryoSpecies: MouseVerified Customer | Posted 01/13/2018differentiation assay using e12.5 mouse neural stem cells. PDGFR (red)/ Dapi (blue)
-
Application: ImmunohistochemistrySample Tested: Brain (cerebellum) tissueSpecies: MouseVerified Customer | Posted 08/10/2017
-
Application: Immunohistochemistry-FrozenSample Tested: Adult Mouse Lung Tissue and Adult heartSpecies: MouseVerified Customer | Posted 01/07/2017Adult mouse heart, fixed overnight 4% PFA, frozen embedded.
There are no reviews that match your criteria.
Protocols
Find general support by application which include: protocols, troubleshooting, illustrated assays, videos and webinars.
- 7-Amino Actinomycin D (7-AAD) Cell Viability Flow Cytometry Protocol
- Antigen Retrieval Protocol (PIER)
- Antigen Retrieval for Frozen Sections Protocol
- Appropriate Fixation of IHC/ICC Samples
- Cellular Response to Hypoxia Protocols
- Chromogenic IHC Staining of Formalin-Fixed Paraffin-Embedded (FFPE) Tissue Protocol
- Chromogenic Immunohistochemistry Staining of Frozen Tissue
- ClariTSA™ Fluorophore Kits
- Detection & Visualization of Antibody Binding
- Extracellular Membrane Flow Cytometry Protocol
- Flow Cytometry Protocol for Cell Surface Markers
- Flow Cytometry Protocol for Staining Membrane Associated Proteins
- Flow Cytometry Staining Protocols
- Flow Cytometry Troubleshooting Guide
- Fluorescent IHC Staining of Frozen Tissue Protocol
- Graphic Protocol for Heat-induced Epitope Retrieval
- Graphic Protocol for the Preparation and Fluorescent IHC Staining of Frozen Tissue Sections
- Graphic Protocol for the Preparation and Fluorescent IHC Staining of Paraffin-embedded Tissue Sections
- Graphic Protocol for the Preparation of Gelatin-coated Slides for Histological Tissue Sections
- IHC Sample Preparation (Frozen sections vs Paraffin)
- Immunofluorescent IHC Staining of Formalin-Fixed Paraffin-Embedded (FFPE) Tissue Protocol
- Immunohistochemistry (IHC) and Immunocytochemistry (ICC) Protocols
- Immunohistochemistry Frozen Troubleshooting
- Immunohistochemistry Paraffin Troubleshooting
- Intracellular Flow Cytometry Protocol Using Alcohol (Methanol)
- Intracellular Flow Cytometry Protocol Using Detergents
- Intracellular Nuclear Staining Flow Cytometry Protocol Using Detergents
- Intracellular Staining Flow Cytometry Protocol Using Alcohol Permeabilization
- Intracellular Staining Flow Cytometry Protocol Using Detergents to Permeabilize Cells
- Preparing Samples for IHC/ICC Experiments
- Preventing Non-Specific Staining (Non-Specific Binding)
- Primary Antibody Selection & Optimization
- Propidium Iodide Cell Viability Flow Cytometry Protocol
- Protocol for Heat-Induced Epitope Retrieval (HIER)
- Protocol for Liperfluo
- Protocol for Making a 4% Formaldehyde Solution in PBS
- Protocol for VisUCyte™ HRP Polymer Detection Reagent
- Protocol for the Characterization of Human Th22 Cells
- Protocol for the Characterization of Human Th9 Cells
- Protocol for the Preparation & Fixation of Cells on Coverslips
- Protocol for the Preparation and Chromogenic IHC Staining of Frozen Tissue Sections
- Protocol for the Preparation and Chromogenic IHC Staining of Frozen Tissue Sections - Graphic
- Protocol for the Preparation and Chromogenic IHC Staining of Paraffin-embedded Tissue Sections
- Protocol for the Preparation and Chromogenic IHC Staining of Paraffin-embedded Tissue Sections - Graphic
- Protocol for the Preparation and Fluorescent IHC Staining of Frozen Tissue Sections
- Protocol for the Preparation and Fluorescent IHC Staining of Paraffin-embedded Tissue Sections
- Protocol for the Preparation of Gelatin-coated Slides for Histological Tissue Sections
- Protocol: Annexin V and PI Staining by Flow Cytometry
- Protocol: Annexin V and PI Staining for Apoptosis by Flow Cytometry
- R&D Systems Quality Control Western Blot Protocol
- TUNEL and Active Caspase-3 Detection by IHC/ICC Protocol
- The Importance of IHC/ICC Controls
- Troubleshooting Guide: Fluorokine Flow Cytometry Kits
- Troubleshooting Guide: Immunohistochemistry
- Troubleshooting Guide: Western Blot Figures
- Western Blot Conditions
- Western Blot Protocol
- Western Blot Protocol for Cell Lysates
- Western Blot Troubleshooting
- Western Blot Troubleshooting Guide
- View all Protocols, Troubleshooting, Illustrated assays and Webinars
FAQs for Mouse PDGF R alpha Antibody
-
Q: Does Mouse PDGF R alpha Antibody, Catalog # AF1062, cross-react with rat PDGF R alpha?
A: We have not tested Catalog # AF1062 against rat samples in-house so we do not guarantee that it will detect rat PDGF R alpha. However, Uniprot indicates the homology between mouse and rat PDGF R to be 95.7%, which suggests cross-reactivity is likely.


