Key Product Details
Validated by
Species Reactivity
Validated:
Cited:
Applications
Validated:
Cited:
Label
Antibody Source
Product Specifications
Immunogen
Phe22-Ala810 (Lys811Arg), Ser829-Asp854
Accession # Q9QWJ9
Specificity
Clonality
Host
Isotype
Endotoxin Level
Scientific Data Images for Neuropilin-1 Antibody
Detection of Recombinant Human, Mouse, and Rat Neuropilin‑1 by Western Blot.
Western blot shows 25 ng of Recombinant Mouse Neuropilin-1 (Catalog # 5994-N1), Recombinant Rat Neuropilin-1 Fc Chimera (Catalog # 566-N1) and Recombinant Human Neuropilin-1 (Catalog # 3870-N1). PVDF Membrane was probed with 0.1 µg/mL of Goat Anti-Mouse/Rat Neuropilin-1 Antigen Affinity-purified Polyclonal Antibody (Catalog # AF566) followed by HRP-conjugated Anti-Goat IgG Secondary Antibody (Catalog # HAF109). A specific band was detected for Neuropilin-1 at approximately 150 kDa (as indicated). This experiment was conducted under reducing conditions and using Immunoblot Buffer Group 1.
Detection of Neuropilin-1 in bEnd.3 Mouse Cell Line by Flow Cytometry.
bEnd.3 mouse endothelioma cell line was stained with Goat Anti-Rat Neuropilin-1 Antigen Affinity-purified Polyclonal Antibody (Catalog # AF566, filled histogram) or isotype control antibody (Catalog # AB-108-C, open histogram), followed by Allophycocyanin-conjugated Anti-Goat IgG Secondary Antibody (Catalog # F0108).
Neuropilin‑1 in Embryonic Rat Spinal Cord.
Neuropilin-1 was detected in immersion fixed frozen sections of embryonic rat spinal cord (15 d.p.c.) using 5 µg/mL Goat Anti-Rat Neuropilin-1 Antigen Affinity-purified Polyclonal Antibody (Catalog # AF566) overnight at 4 °C. Tissue was stained with the Anti-Goat HRP-DAB Cell & Tissue Staining Kit (brown; Catalog # CTS008) and counter-stained with hematoxylin (blue). View our protocol for Chromogenic IHC Staining of Frozen Tissue Sections.
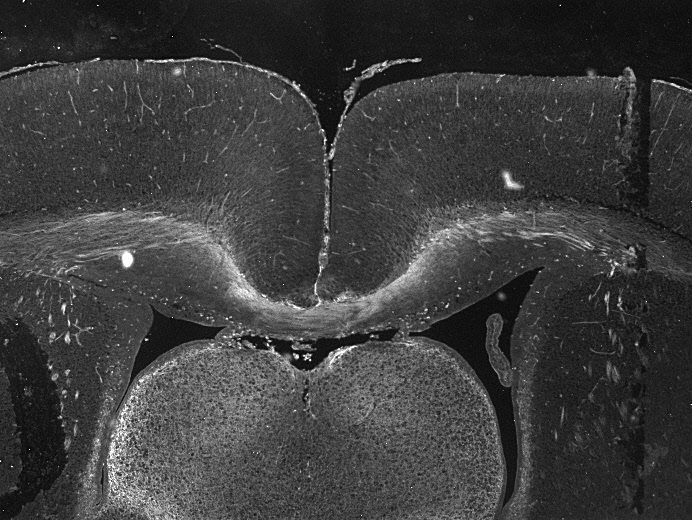
Neuropilin‑1 in Rat Spinal Cord.
Neuropilin-1 was detected in perfusion fixed frozen sections of rat spinal cord using Goat Anti-Rat Neuropilin-1 Antigen Affinity-purified Polyclonal Antibody (Catalog # AF566) at 15 µg/mL overnight at 4 °C. Tissue was stained using the NorthernLights™ 557-conjugated Anti-Goat IgG Secondary Antibody (red; Catalog # NL001) and counter-stained with DAPI (blue). Specific staining was localized to the dorsal horn. View our protocol for Fluorescent IHC Staining of Frozen Tissue Sections.
Neuropilin‑1 in Rat Brain.
Neuropilin-1 was detected in immersion fixed paraffin-embedded sections of rat brain (hippocampus) using Goat Anti-Mouse/Rat Neuropilin-1 Antigen Affinity-purified Polyclonal Antibody (Catalog # AF566) at 3 µg/mL for 1 hour at room temperature followed by incubation with the Anti-Goat IgG VisUCyte™ HRP Polymer Antibody (Catalog # VC004). Tissue was stained using DAB (brown) and counterstained with hematoxylin (blue). Specific staining was localized to cytoplasm in neuronal cell bodies and projections. View our protocol for IHC Staining with VisUCyte HRP Polymer Detection Reagents.
Neuropilin‑1 in Rat Brain.
Neuropilin-1 was detected in immersion fixed paraffin-embedded sections of rat brain (thalamus) using Goat Anti-Mouse/Rat Neuropilin-1 Antigen Affinity-purified Polyclonal Antibody (Catalog # AF566) at 3 µg/mL for 1 hour at room temperature followed by incubation with the Anti-Goat IgG VisUCyte™ HRP Polymer Antibody (Catalog # VC004). Tissue was stained using DAB (brown) and counterstained with hematoxylin (blue). Specific staining was localized to cytoplasm in neuronal cell bodies and projections. View our protocol for IHC Staining with VisUCyte HRP Polymer Detection Reagents.
Detection of Mouse Neuropilin-1 by Western Blot
Nrp1 influences Smad2/3 activation.(a–c) Representative confocal images of wt sprouts from EBs immunolabelled for pSmad2. The outline of the wt sprouts is indicated with a dashed line using the endogenous DsRED marker. DAPI staining (not shown) was used to mark nuclei (blue line). Sprouts from (a) untreated EBs, (b) treated with 2 ng ml−1 Tgf-beta for 1 h and(c) treated with 10 μM SB-421543 for 4 h. Scale bar, 13 μm. (d,e) Western blot analysis of proteins from P4 HUVEC transfected with control siRNA and NRP1 siRNA, with or without stimulation with 2 ng ml−1 TGF-beta for 1 h. Full western blots are shown in Supplementary Fig. 10. A representative blot of six is shown; P=0.0012 NRP1 siRNA compared with control. (f,g) Proteins from P4 HUVEC transfected with control-GFP and NRP1–GFP–His construct for 24 h, with or without stimulation with 2 ng ml−1 TGF-beta for 1 h were assessed for SMAD2 phosphorylation. Full western blots are shown in Supplementary Fig. 11. A representative blot of four is shown; P=0.0017 NRP1 overexpression compared with control. (e,g) Quantification of pSMAD2 protein normalized to SMAD2/3. (h–k) Western blot analysis of proteins from P4 HUVEC transfected with control siRNA and NRP1 siRNA, with or without stimulation with 2 ng ml−1 TGF-beta for 1 h. Full western blots are shown in Supplementary Figs 12 and 13. (i) Quantification of pSMAD2 protein normalized to SMAD2/3; P=0.0848 Nrp1 siRNA compared with control. (k) Quantification of pSMAD3 protein normalized to SMAD3; P=0.0181 NRP1 siRNA compared with control. (l,m) Western blot analysis of P4 HUVEC transfected with control siRNA and NRP1 siRNA, with or without stimulation with 10 ng ml−1 BMP9 for 15 and 30 min. Full western blots are shown in Supplementary Fig. 14. A representative blot of four is shown. (m) Quantification of pSMAD2/3 protein normalized to SMAD2; P<0.0011 NRP1 siRNA compared with control. All values represent mean±s.e.m. DAPI, 4,6-diamidino-2-phenylindole; NS, not significant. Image collected
Detection of Mouse Neuropilin-1 by Western Blot
Expression of candidate genes. (A) qPCR analysis of relative mRNA levels in total RNA from isolated glomeruli of Foxc2fl/fl; Pod‐Cre+, Foxc2fl/+; Pod‐Cre+ and Foxc2fl/+ mice. Expression levels were normalized against the expression of Rplp0. (B) qPCR analysis of relative mRNA levels in total RNA from a podocyte cell line treated with either Foxc2 siRNA or non‐targeting siRNA. (C) Western blot analysis of NRP1 and ITGB1 protein expression after Foxc2 induction (pBABE‐Foxc2) or knockdown (Foxc2 siRNA). Empty vector (pBABE) and non‐targeting siRNA was used as controls. *P < 0.05 Foxc2fl/fl;Pod‐Cre+ versus Foxc2fl/+. Error bars in (A) and (B) represent SEM. Image collected and cropped by CiteAb from the following open publication (https://pubmed.ncbi.nlm.nih.gov/31062503), licensed under a CC-BY license. Not internally tested by R&D Systems.
Detection of Mouse Neuropilin-1 by Western Blot
Nrp1 influences Smad2/3 activation.(a–c) Representative confocal images of wt sprouts from EBs immunolabelled for pSmad2. The outline of the wt sprouts is indicated with a dashed line using the endogenous DsRED marker. DAPI staining (not shown) was used to mark nuclei (blue line). Sprouts from (a) untreated EBs, (b) treated with 2 ng ml−1 Tgf-beta for 1 h and(c) treated with 10 μM SB-421543 for 4 h. Scale bar, 13 μm. (d,e) Western blot analysis of proteins from P4 HUVEC transfected with control siRNA and NRP1 siRNA, with or without stimulation with 2 ng ml−1 TGF-beta for 1 h. Full western blots are shown in Supplementary Fig. 10. A representative blot of six is shown; P=0.0012 NRP1 siRNA compared with control. (f,g) Proteins from P4 HUVEC transfected with control-GFP and NRP1–GFP–His construct for 24 h, with or without stimulation with 2 ng ml−1 TGF-beta for 1 h were assessed for SMAD2 phosphorylation. Full western blots are shown in Supplementary Fig. 11. A representative blot of four is shown; P=0.0017 NRP1 overexpression compared with control. (e,g) Quantification of pSMAD2 protein normalized to SMAD2/3. (h–k) Western blot analysis of proteins from P4 HUVEC transfected with control siRNA and NRP1 siRNA, with or without stimulation with 2 ng ml−1 TGF-beta for 1 h. Full western blots are shown in Supplementary Figs 12 and 13. (i) Quantification of pSMAD2 protein normalized to SMAD2/3; P=0.0848 Nrp1 siRNA compared with control. (k) Quantification of pSMAD3 protein normalized to SMAD3; P=0.0181 NRP1 siRNA compared with control. (l,m) Western blot analysis of P4 HUVEC transfected with control siRNA and NRP1 siRNA, with or without stimulation with 10 ng ml−1 BMP9 for 15 and 30 min. Full western blots are shown in Supplementary Fig. 14. A representative blot of four is shown. (m) Quantification of pSMAD2/3 protein normalized to SMAD2; P<0.0011 NRP1 siRNA compared with control. All values represent mean±s.e.m. DAPI, 4,6-diamidino-2-phenylindole; NS, not significant. Image collected
Detection of Neuropilin-1 by Western Blot
Rescue of VEGF-A Signaling in Nrp1cyto and Nrp1fl/fl Primary EC by Full-Length NRP1 and of EC Tubulogenesis following NRP1 siRNA Knockdown with Constitutively Active ERK(A and B) Western blot analysis of Nrp1cyto EC that were transduced with the indicated adenoviral constructs, serum-starved and stimulated with 50 ng/ml VEGF-A165. Blots (A) and quantitation of ERK activation (B) show that Ad-Nrp1, but not Ad-Nrp1cyto or Ad-Nrp1PDZ, restores VEGF-A-induced VEGFR2 and ERK activation in Nrp1cyto EC (mean ± SD, n = 3, *p < 0.05).(C and D) Western blot analysis of Nrp1fl/fl EC treated with adenoviral constructs expressing CRE recombinase to inactivate NRP1 were transduced with the indicated adenoviral constructs, serum-starved and stimulated with 50 ng/ml VEGF-A165. Blots (C) and quantitation (D) show that Ad-Nrp1, but not Ad-Nrp1cyto or Ad-Nrp1PDZ, restores the activation of VEGFR2 and ERK (mean ± SD, n = 3, *p < 0.05).(E and F) HUVEC treated with control or NRP1 siRNA were treated with the indicated adenoviral vectors to compare their capacity to undergo tube formation in 3D collagen matrices after 72 hr. Representative images (E) and quantification (F) of tubulogenesis after 72 hr (mean ± SEM, n = 18, *p < 0.05). Scale bar represents 100 um. Image collected and cropped by CiteAb from the following open publication (https://pubmed.ncbi.nlm.nih.gov/23639442), licensed under a CC-BY license. Not internally tested by R&D Systems.
Detection of Neuropilin-1 by Western Blot
Impaired VEGF-A Signaling in Nrp1cyto Mice(A) Western blot analysis of heart lysates following intraperitoneal injection of VEGF-A. Blots show reduced ERK and VEGFR2 phosphorylation in Nrp1cyto mice relative to WT littermates.(B–D) Western blot analysis of cell lysates from primary arterial EC from Nrp1cyto and WT EC that were serum-starved and then stimulated for the indicated times with 50 ng/ml VEGF-A165. (B) Blots show reduced phosphorylation of VEGFR2 on Y1175 and of ERK in Nrp1cyto relative to control EC. (C) Quantification of the ratio of phospho-VEGFR2 (pVEGFR2) relative to total VEGFR2 (VEGFR2) (mean ± SD, n = 5, *p < 0.05). (D) Quantification of the ratio of phospho-ERK (pERK) relative to total ERK (ERK) (mean ± SD, n = 5, *p < 0.05).(E) Western blot analysis of cell lysates from Nrp1cyto and WT primary arterial EC that were serum-starved and stimulated for the indicated times with 50 ng/ml of FGF2 or IGF1. ERK phosphorylation was similar in Nrp1cyto and WT EC.See also Figure S4. Image collected and cropped by CiteAb from the following open publication (https://pubmed.ncbi.nlm.nih.gov/23639442), licensed under a CC-BY license. Not internally tested by R&D Systems.
Detection of Neuropilin-1 by Western Blot
Rescue of Defective ERK Signaling in VEGF-A-Stimulated Nrp1cyto Arterial EC by Knockdown of PTP1bPrimary arterial EC from Nrp1cyto mice transfected with siRNA specific for the indicated phosphatases were serum-starved and then stimulated with 50 ng/ml VEGF-A165.(A and B) Knockdown of the indicated phosphatases in Nrp1cyto arterial EC shown by immunoblotting (A); PTP1b knockdown was quantified in (B), dashed line indicates normal expression levels.(C and D) ERK and VEGFR2 (Y1175) phosphorylation after knockdown of the indicated phosphatases shown by immunoblotting (C). Quantification of pERK activation is shown in (D) (n = 3, mean ± SD, *p < 0.05). Image collected and cropped by CiteAb from the following open publication (https://pubmed.ncbi.nlm.nih.gov/23639442), licensed under a CC-BY license. Not internally tested by R&D Systems.
Detection of Neuropilin-1 by Western Blot
Rescue of VEGF-A Signaling in Nrp1cyto and Nrp1fl/fl Primary EC by Full-Length NRP1 and of EC Tubulogenesis following NRP1 siRNA Knockdown with Constitutively Active ERK(A and B) Western blot analysis of Nrp1cyto EC that were transduced with the indicated adenoviral constructs, serum-starved and stimulated with 50 ng/ml VEGF-A165. Blots (A) and quantitation of ERK activation (B) show that Ad-Nrp1, but not Ad-Nrp1cyto or Ad-Nrp1PDZ, restores VEGF-A-induced VEGFR2 and ERK activation in Nrp1cyto EC (mean ± SD, n = 3, *p < 0.05).(C and D) Western blot analysis of Nrp1fl/fl EC treated with adenoviral constructs expressing CRE recombinase to inactivate NRP1 were transduced with the indicated adenoviral constructs, serum-starved and stimulated with 50 ng/ml VEGF-A165. Blots (C) and quantitation (D) show that Ad-Nrp1, but not Ad-Nrp1cyto or Ad-Nrp1PDZ, restores the activation of VEGFR2 and ERK (mean ± SD, n = 3, *p < 0.05).(E and F) HUVEC treated with control or NRP1 siRNA were treated with the indicated adenoviral vectors to compare their capacity to undergo tube formation in 3D collagen matrices after 72 hr. Representative images (E) and quantification (F) of tubulogenesis after 72 hr (mean ± SEM, n = 18, *p < 0.05). Scale bar represents 100 um. Image collected and cropped by CiteAb from the following open publication (https://pubmed.ncbi.nlm.nih.gov/23639442), licensed under a CC-BY license. Not internally tested by R&D Systems.Applications for Neuropilin-1 Antibody
Blockade of Receptor-ligand Interaction
Also, 1-5 µg/mL of this antibody will block 50% of the binding of 50 ng/mL of Recombinant Human Semaphorin 3A Fc Chimera (Catalog # 1250-S3) to immobilized Recombinant Rat Neuropilin-1 Fc Chimera (Catalog # 566-NNS) coated at 2 µg/mL (100 µL/well).
CyTOF-ready
Flow Cytometry
Sample: bEnd.3 mouse endothelioma cell line and Rat cortical stem cells
Immunohistochemistry
Sample: Immersion fixed frozen sections of embryonic rat spinal cord (15 d.p.c.), perfusion fixed frozen sections of rat spinal cord, and immersion fixed paraffin-embedded sections of rat brain (hippocampus and thalamus)
Western Blot
Sample: Recombinant Mouse Neuropilin‑1 (Catalog # 5994-N1) and Recombinant Rat Neuropilin‑1 Fc Chimera (Catalog # 566-N1)
Reviewed Applications
Read 12 reviews rated 4.2 using AF566 in the following applications:
Flow Cytometry Panel Builder
Bio-Techne Knows Flow Cytometry
Save time and reduce costly mistakes by quickly finding compatible reagents using the Panel Builder Tool.
Advanced Features
- Spectra Viewer - Custom analysis of spectra from multiple fluorochromes
- Spillover Popups - Visualize the spectra of individual fluorochromes
- Antigen Density Selector - Match fluorochrome brightness with antigen density

Formulation, Preparation, and Storage
Purification
Reconstitution
Reconstitute at 0.2 mg/mL in sterile PBS. For liquid material, refer to CoA for concentration.
Formulation
Shipping
Stability & Storage
- 12 months from date of receipt, -20 to -70 °C as supplied.
- 1 month, 2 to 8 °C under sterile conditions after reconstitution.
- 6 months, -20 to -70 °C under sterile conditions after reconstitution.
Calculators
Background: Neuropilin-1
Alternate Names
Gene Symbol
UniProt
Additional Neuropilin-1 Products
Product Documents for Neuropilin-1 Antibody
Certificate of Analysis
To download a Certificate of Analysis, please enter a lot or batch number in the search box below.
Note: Certificate of Analysis not available for kit components.
Product Specific Notices for Neuropilin-1 Antibody
This product or the use of this product is covered by U.S. Patents owned by The Regents of the University of California. This product is for research use only and is not to be used for commercial purposes. Use of this product to produce products for sale or for diagnostic, therapeutic or drug discovery purposes is prohibited. In order to obtain a license to use this product for such purposes, contact The Regents of the University of California.
U.S. Patent # 6,054,293, 6,623,738, and other U.S. and international patents pending.
For research use only
Related Research Areas
Citations for Neuropilin-1 Antibody
 Powered by Bioz
Customer Reviews for Neuropilin-1 Antibody (12)
Have you used Neuropilin-1 Antibody?
Submit a review and receive an Amazon gift card!
$25/€18/£15/$25CAN/¥2500 Yen for a review with an image
$10/€7/£6/$10CAN/¥1110 Yen for a review without an image
Submit a review
Customer Images
-
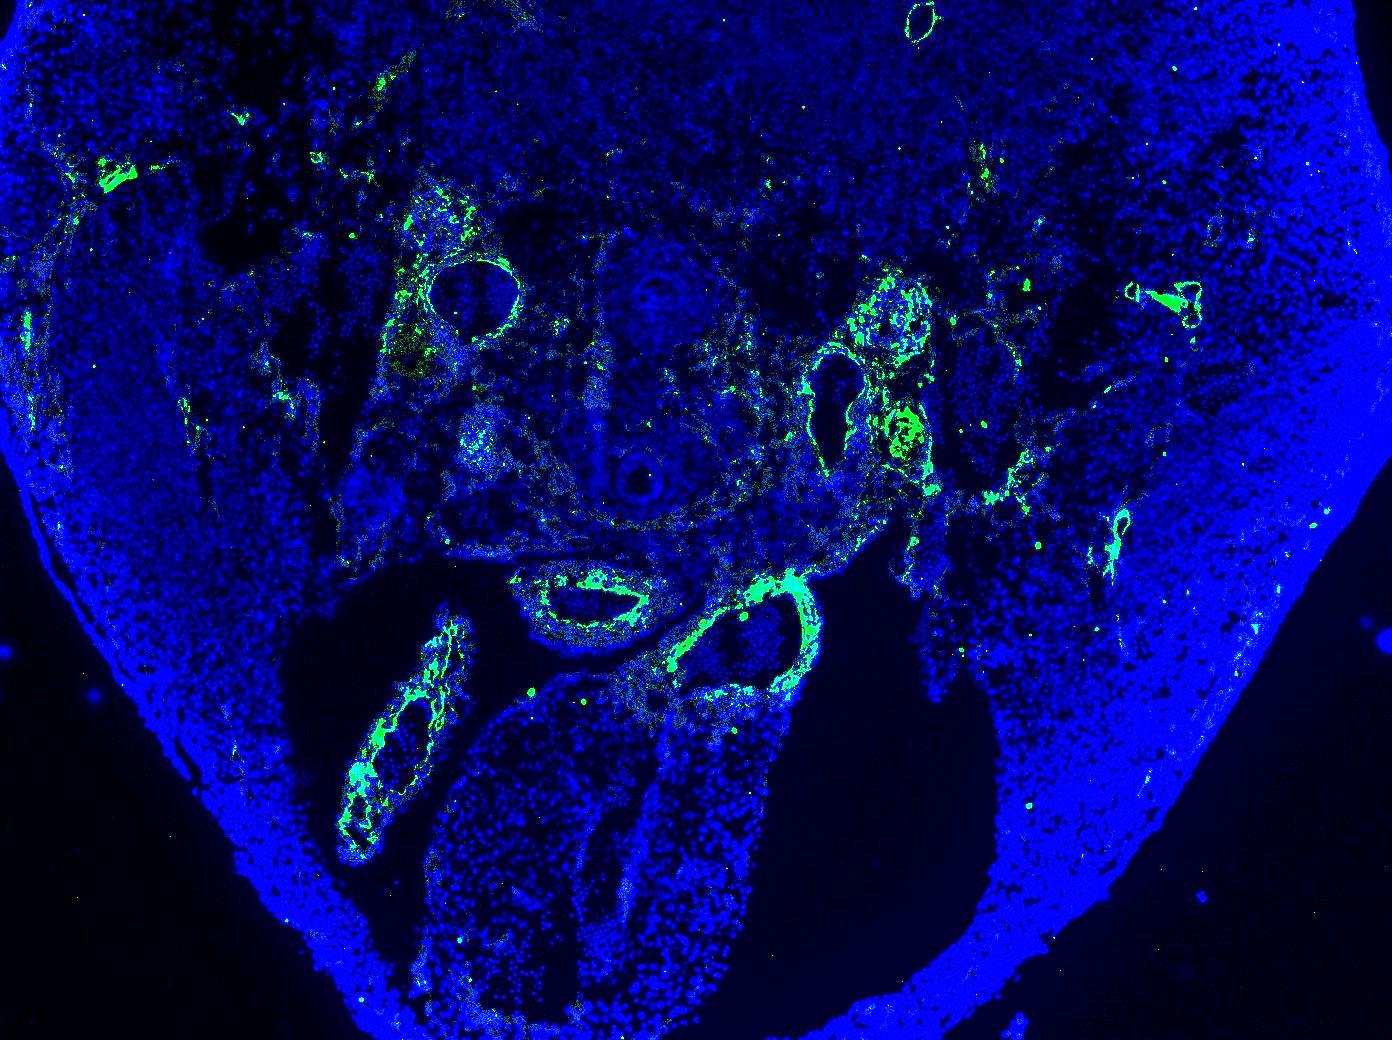
Application: Immunocytochemistry/ImmunofluorescenceSample Tested: E12.5 mouse embryo fixed in 4% PFASpecies: MouseVerified Customer | Posted 12/03/2020Antibody was stained on E12.5 mouse sections (attached picture) as well as E9.5 mouse sections. Worked well. Note the positive stain in the arteries and the negative signal in the adjacent veins. Dilution used - 1:20

-
Application: ImmunohistochemistrySample Tested: paraffin-embedded brainSpecies: MouseVerified Customer | Posted 01/23/2019The antibody is very sensitive to fixation and epitope retrieval conditions. Many conditions need to be tested to achieve an optimal staining. Testing several dilutions with each sample is recommended.
-
Application: ImmunofluorescenceSample Tested: See PMID 22927827Species: OtherVerified Customer | Posted 01/08/2015
-
Application: Immunohistochemistry-FrozenSample Tested: See PMID 24034253Species: MouseVerified Customer | Posted 01/08/2015
-
Application: ImmunofluorescenceSample Tested: See PMID 23406903Species: MouseVerified Customer | Posted 01/08/2015
-
Application: ImmunofluorescenceSample Tested: See PMID 24021649Species: MouseVerified Customer | Posted 01/08/2015
-
Application: ImmunofluorescenceSample Tested: See PMID 23602477Species: MouseVerified Customer | Posted 01/08/2015
-
Application: ImmunofluorescenceSample Tested: Primary mouse hippocampal neuronsSpecies: MouseVerified Customer | Posted 12/18/2014
-
Application: ImmunofluorescenceSample Tested: Hippocampal neurons and astrocytesSpecies: MouseVerified Customer | Posted 12/18/2014
-
Application: Western BlotSample Tested: RN22 cellsSpecies: RatVerified Customer | Posted 12/18/2014
-
Application: Western BlotSample Tested: Mouse primary culturesSpecies: MouseVerified Customer | Posted 12/18/2014
-
Application: Western BlotSample Tested: a number of human cell linesSpecies: HumanVerified Customer | Posted 12/18/2014
There are no reviews that match your criteria.
Protocols
Find general support by application which include: protocols, troubleshooting, illustrated assays, videos and webinars.
- 7-Amino Actinomycin D (7-AAD) Cell Viability Flow Cytometry Protocol
- Antigen Retrieval Protocol (PIER)
- Antigen Retrieval for Frozen Sections Protocol
- Appropriate Fixation of IHC/ICC Samples
- Cellular Response to Hypoxia Protocols
- Chromogenic IHC Staining of Formalin-Fixed Paraffin-Embedded (FFPE) Tissue Protocol
- Chromogenic Immunohistochemistry Staining of Frozen Tissue
- ClariTSA™ Fluorophore Kits
- Detection & Visualization of Antibody Binding
- Extracellular Membrane Flow Cytometry Protocol
- Flow Cytometry Protocol for Cell Surface Markers
- Flow Cytometry Protocol for Staining Membrane Associated Proteins
- Flow Cytometry Staining Protocols
- Flow Cytometry Troubleshooting Guide
- Fluorescent IHC Staining of Frozen Tissue Protocol
- Graphic Protocol for Heat-induced Epitope Retrieval
- Graphic Protocol for the Preparation and Fluorescent IHC Staining of Frozen Tissue Sections
- Graphic Protocol for the Preparation and Fluorescent IHC Staining of Paraffin-embedded Tissue Sections
- Graphic Protocol for the Preparation of Gelatin-coated Slides for Histological Tissue Sections
- IHC Sample Preparation (Frozen sections vs Paraffin)
- Immunofluorescent IHC Staining of Formalin-Fixed Paraffin-Embedded (FFPE) Tissue Protocol
- Immunohistochemistry (IHC) and Immunocytochemistry (ICC) Protocols
- Immunohistochemistry Frozen Troubleshooting
- Immunohistochemistry Paraffin Troubleshooting
- Intracellular Flow Cytometry Protocol Using Alcohol (Methanol)
- Intracellular Flow Cytometry Protocol Using Detergents
- Intracellular Nuclear Staining Flow Cytometry Protocol Using Detergents
- Intracellular Staining Flow Cytometry Protocol Using Alcohol Permeabilization
- Intracellular Staining Flow Cytometry Protocol Using Detergents to Permeabilize Cells
- Preparing Samples for IHC/ICC Experiments
- Preventing Non-Specific Staining (Non-Specific Binding)
- Primary Antibody Selection & Optimization
- Propidium Iodide Cell Viability Flow Cytometry Protocol
- Protocol for Heat-Induced Epitope Retrieval (HIER)
- Protocol for Liperfluo
- Protocol for Making a 4% Formaldehyde Solution in PBS
- Protocol for VisUCyte™ HRP Polymer Detection Reagent
- Protocol for the Characterization of Human Th22 Cells
- Protocol for the Characterization of Human Th9 Cells
- Protocol for the Preparation & Fixation of Cells on Coverslips
- Protocol for the Preparation and Chromogenic IHC Staining of Frozen Tissue Sections
- Protocol for the Preparation and Chromogenic IHC Staining of Frozen Tissue Sections - Graphic
- Protocol for the Preparation and Chromogenic IHC Staining of Paraffin-embedded Tissue Sections
- Protocol for the Preparation and Chromogenic IHC Staining of Paraffin-embedded Tissue Sections - Graphic
- Protocol for the Preparation and Fluorescent IHC Staining of Frozen Tissue Sections
- Protocol for the Preparation and Fluorescent IHC Staining of Paraffin-embedded Tissue Sections
- Protocol for the Preparation of Gelatin-coated Slides for Histological Tissue Sections
- Protocol: Annexin V and PI Staining by Flow Cytometry
- Protocol: Annexin V and PI Staining for Apoptosis by Flow Cytometry
- R&D Systems Quality Control Western Blot Protocol
- TUNEL and Active Caspase-3 Detection by IHC/ICC Protocol
- The Importance of IHC/ICC Controls
- Troubleshooting Guide: Fluorokine Flow Cytometry Kits
- Troubleshooting Guide: Immunohistochemistry
- Troubleshooting Guide: Western Blot Figures
- Western Blot Conditions
- Western Blot Protocol
- Western Blot Protocol for Cell Lysates
- Western Blot Troubleshooting
- Western Blot Troubleshooting Guide
- View all Protocols, Troubleshooting, Illustrated assays and Webinars
Associated Pathways