TREM2 (Triggering Receptor Expressed by Myeloid cells) is an Ig superfamily cell surface receptor that activates a number of myeloid cell types (1). It is a member of a small gene family located on human chromosome 6p21 and mouse chromosome 17 in a region linked to the MHC (2). A single human TREM2 gene has been described, however, two closely related orthologs were reported in mouse (3). The proteins differ by only three amino acids and were designated TREM2a and TREM2b. TREM2 is type I transmembrane protein consisting of a single extracellular immunoglobulin (V-like) domain, a transmembrane domain with a positively charged lysine residue, and a short cytoplasmic tail (1). It associates with the signal adapter protein, DAP12, for signaling and function. DAP12 has a cytoplasmic ITAM that is phosphorylated upon ligand binding leading to the subsequent activation of cytoplasmic tyrosine kinases. TREM2 is expressed by immature monocyte-derived dendritic cells (DC), and expression is down-regulated upon activation of DC by microbial products and costimulatory signals (4). Ligation of TREM2 on immature DC with anti-TREM2 antibodies results in partial DC activation and the up-regulation of CCR7 and some co-stimulatory molecules. A role for TREM2 in the functioning of osteoclasts and microglia is suggested by the discovery that homozygous loss-of-function mutations in either TREM2 or DAP12 result in Nasu-Hakola disease characterized by a combination of presenile demetia and bone cysts (5). In vitro studies indicate that the differentiation of myeloid precursors into osteoclasts is dramatically impaired in TREM2 deficient individuals (6).
Mouse TREM2 Antibody
R&D Systems | Catalog # AF1729

Key Product Details
Validated by
Species Reactivity
Validated:
Cited:
Applications
Validated:
Cited:
Label
Antibody Source
Product Specifications
Immunogen
Leu19-Pro168
Accession # Q99NH8
Specificity
Clonality
Host
Isotype
Scientific Data Images for Mouse TREM2 Antibody
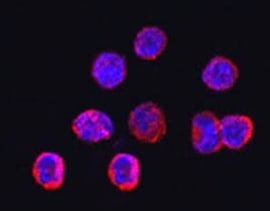
TREM2 in RAW 264.7 Mouse Cell Line.
TREM2 was detected in immersion fixed RAW 264.7 mouse monocyte/macrophage cell line using Sheep Anti-Mouse TREM2 Antigen Affinity-purified Polyclonal Antibody (Catalog # AF1729) at 1.7 µg/mL for 3 hours at room temperature. Cells were stained using the NorthernLights™ 557-conjugated Anti-Sheep IgG Secondary Antibody (red; NL010) and counterstained with DAPI (blue). Specific staining was localized to cytoplasm. View our protocol for Fluorescent ICC Staining of Non-adherent Cells.
Mouse TREM2 ELISA Standard Curve.
Recombinant Mouse TREM2 protein was serially diluted 2-fold and captured by Sheep Anti-Mouse TREM2 Antigen Affinity-purified Polyclonal Antibody (Catalog # AF1729) coated on a Clear Polystyrene Microplate (DY990). Sheep Anti-Mouse TREM2 Biotinylated Antigen Affinity-purified Polyclonal Antibody (BAF1729) was incubated with the protein captured on the plate. Detection of the standard curve was achieved by incubating Streptavidin-HRP (DY998) followed by Substrate Solution (DY999) and stopping the enzymatic reaction with Stop Solution (DY994).
TREM2 Specificity is Shown by Immunocytochemistry in Knockout Cell Line.
TREM2 was detected in immersion fixed RAW 264.7 mouse monocyte/macrophage cell line (left panel) but is not detected in TREM2 knockout (KO) RAW 264.7 Mouse Cell Line cell line (right panel) using Sheep Anti-Mouse TREM2 Antigen Affinity-purified Polyclonal Antibody (Catalog # AF1729) at 1.7 µg/mL for 3 hours at room temperature. Cells were stained using the NorthernLights™ 557-conjugated Anti-Sheep IgG Secondary Antibody (red; NL010) and counterstained with DAPI (blue). Specific staining was localized to cytoplasm. View our protocol for Fluorescent ICC Staining of Non-adherent Cells.
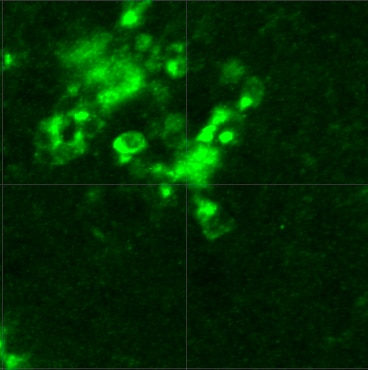
Detection of Mouse TREM2 by Immunocytochemistry/Immunofluorescence
SCF+G-CSF treatment increases TREM2 expression in the Iba1+ microglia/macrophages surrounding the 6E10+ senile plaques. (A) Representative confocal images of TREM2 (red), 6E10 (purple) and Iba1 (green) triple immunofluorescence staining in the brains of aged APP/PS1 mice. Blue: Nuclear counterstaining by DAPI. (B) Representative orthographic view of z-stack images (12 z-stacks with 1μm intervals) illustrates the location and interaction of TREM2 + cells (red) and 6E10+ A beta plaques (white) in the brains of aged APP/PS1 mice. (C) Quantification data show the percentage of TREM2+ area surrounding the 6E10+ A beta plaques (within 10μm from the border of the A beta plaques) in the brains of aged APP/PS1 mice with or without SCF+G-CSF treatment. (D) Representative orthographic view of z-stack images (12 z-stacks with 1μm intervals) displays the location and interaction of TREM2+/Iba1+ co-expressing cells (yellow) and 6E10+ A beta plaques (white) in the brains of APP/PS1 mice. (E) Quantification data show the percentage of TREM2+/Iba1+ co-expression area in the total of Iba1+ area in the vicinity of 6E10+ A beta plaques in the brains of aged APP/PS1 mice with or without SCF+G-CSF treatment. N=4-5. Mean ± SEM. * p<0.05 by Student’s t-test. Image collected and cropped by CiteAb from the following publication (https://pubmed.ncbi.nlm.nih.gov/33269098), licensed under a CC-BY license. Not internally tested by R&D Systems.
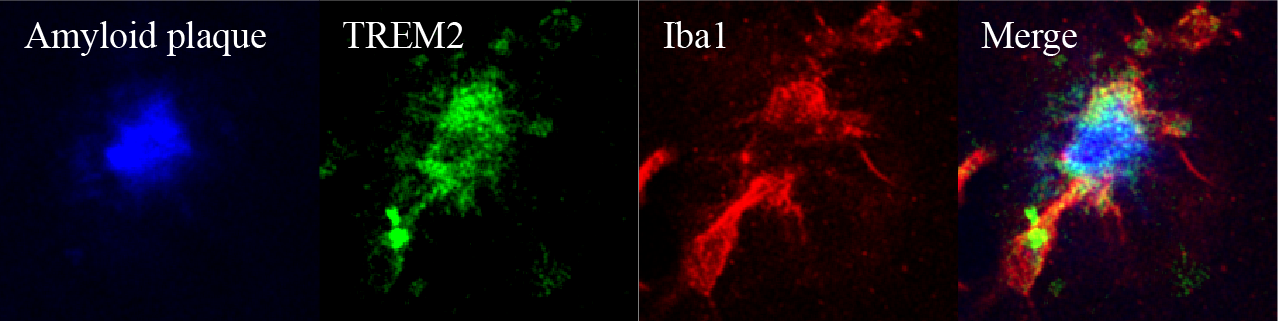
Detection of Mouse Mouse TREM2 Antibody by Western Blot
A beta oligomers induce TREM2 proteolysis and sTREM2 release, which then binds A beta oligomers, but R47H sTREM2 binds less. A, western blot of cell lysate and unprocessed supernatant (sTREM2) of HEK293 cells coexpressing human DAP12 and full-length N-terminally-tagged wild-type (WT) human TREM2 (FL-TREM2) 16 h after adding A beta oligomers. This blot and those for A beta monomers and fibrils are reproduced in Figure S5 for comparison. B, quantification of sTREM2 release from transfected HEK293 cells expressing wild-type (green line) and R47H TREM2 (red line). C, quantification of sTREM2 release from wild-type TREM2 expressing HEK293 cells induced by doses of A beta oligomers (red line), monomers (green line), or fibrils (blue line). For both (B and C) error bars = SEM; ∗p < 0.05 ∗∗p < 0.01 ∗∗∗p < 0.001, n = 3 independent experiments; one-way ANOVA with Tukey's post-hoc multiple comparisons test. D, example field of single-molecule TIRF imaging of mixture of A beta oligomers (green) and wild-type TREM2 ectodomain (red), where colocalized spots appear yellow. Scale bar: 1 micron. Magnified image of three sections of field at right. E, proportion of monomeric or oligomeric A beta colocalized with wild-type sTREM2. F, proportion of A beta oligomers colocalized with wild-type or R47H TREM2 ectodomain. For (E and F), error bars = SEM; ∗∗∗∗p < 0.0001, n = 3 independent preparations, each analyzed in nine fields each; two-tailed t-test of significance. Image collected and cropped by CiteAb from the following publication (https://pubmed.ncbi.nlm.nih.gov/33823153), licensed under a CC-BY license. Not internally tested by R&D Systems.Applications for Mouse TREM2 Antibody
ELISA
This antibody functions as an ELISA capture antibody when paired with Sheep Anti-Mouse TREM2 Biotinylated Antigen Affinity-purified Polyclonal Antibody (Catalog # BAF1729).
This product is intended for assay development on various assay platforms requiring antibody pairs.
Immunocytochemistry
Sample: Immersion fixed RAW 264.7 mouse monocyte/macrophage cell line
Knockout Validated
Sample: Immersion fixed RAW 264.7 mouse monocyte/macrophage cell line
Western Blot
Sample: Recombinant Mouse TREM2b Fc Chimera (Catalog # 1729-T2)
Reviewed Applications
Read 5 reviews rated 3.4 using AF1729 in the following applications:
Formulation, Preparation, and Storage
Purification
Reconstitution
Reconstitute at 0.2 mg/mL in sterile PBS. For liquid material, refer to CoA for concentration.
Formulation
Shipping
Stability & Storage
- 12 months from date of receipt, -20 to -70 °C as supplied.
- 1 month, 2 to 8 °C under sterile conditions after reconstitution.
- 6 months, -20 to -70 °C under sterile conditions after reconstitution.
Calculators
Background: TREM2
References
- Colonna, M. (2003) Nature Rev. Immunol. 3:445.
- Allcock, R. et al. (2003) Eur. J. Immunol. 33:567.
- Daws, M. et al. (2001) Eur. J. Immunol. 31:783.
- Bouchon, A. et al. (2001) J. Exp. Med. 194:1111.
- Paloneva, J. et al. (2002) Am. J. Hum. Genet. 71:656.
- Cella, M. et al. (2003) J. Exp. Med. 198:645.
Long Name
Alternate Names
Gene Symbol
UniProt
Additional TREM2 Products
Product Documents for Mouse TREM2 Antibody
Certificate of Analysis
To download a Certificate of Analysis, please enter a lot or batch number in the search box below.
Note: Certificate of Analysis not available for kit components.
Product Specific Notices for Mouse TREM2 Antibody
For research use only
Related Research Areas
Citations for Mouse TREM2 Antibody
 Powered by Bioz
Customer Reviews for Mouse TREM2 Antibody (5)
Have you used Mouse TREM2 Antibody?
Submit a review and receive an Amazon gift card!
$25/€18/£15/$25CAN/¥2500 Yen for a review with an image
$10/€7/£6/$10CAN/¥1110 Yen for a review without an image
Submit a review
Customer Images
-
Application: ImmunohistochemistrySample Tested: Brain (cortex) tissueSpecies: MouseVerified Customer | Posted 06/07/2023

-
Application: Immunocytochemistry/ImmunofluorescenceSample Tested: RAW 264.7 Mouse Cell LineSpecies: MouseVerified Customer | Posted 07/11/2022
-
Application: Immunocytochemistry/ImmunofluorescenceSample Tested: kupffer cellsSpecies: MouseVerified Customer | Posted 09/28/2020Only works for IF staining in cells
-
Application: Immunohistochemistry of free floating tissueSample Tested: Mouse brainSpecies: MouseVerified Customer | Posted 03/20/20181:250 dilution, antigen retrieval for 15mins.
-
Application: Western BlotSample Tested: Brain tissue and Bone marrow cellsSpecies: MouseVerified Customer | Posted 07/03/201730 and 60 micrograms loaded for each experiment. We tried AB concentratrations from 1:10.000 to 1:1000, none of them workingBio-Techne ResponseTechnical Support is following up
There are no reviews that match your criteria.
Protocols
Find general support by application which include: protocols, troubleshooting, illustrated assays, videos and webinars.
- Appropriate Fixation of IHC/ICC Samples
- Cellular Response to Hypoxia Protocols
- ClariTSA™ Fluorophore Kits
- Detection & Visualization of Antibody Binding
- ELISA Sample Preparation & Collection Guide
- ELISA Troubleshooting Guide
- How to Run an R&D Systems DuoSet ELISA
- How to Run an R&D Systems Quantikine ELISA
- How to Run an R&D Systems Quantikine™ QuicKit™ ELISA
- ICC Cell Smear Protocol for Suspension Cells
- ICC Immunocytochemistry Protocol Videos
- ICC for Adherent Cells
- Immunocytochemistry (ICC) Protocol
- Immunocytochemistry Troubleshooting
- Immunofluorescence of Organoids Embedded in Cultrex Basement Membrane Extract
- Immunohistochemistry (IHC) and Immunocytochemistry (ICC) Protocols
- Preparing Samples for IHC/ICC Experiments
- Preventing Non-Specific Staining (Non-Specific Binding)
- Primary Antibody Selection & Optimization
- Protocol for VisUCyte™ HRP Polymer Detection Reagent
- Protocol for the Fluorescent ICC Staining of Cell Smears - Graphic
- Protocol for the Fluorescent ICC Staining of Cultured Cells on Coverslips - Graphic
- Protocol for the Preparation and Fluorescent ICC Staining of Cells on Coverslips
- Protocol for the Preparation and Fluorescent ICC Staining of Non-adherent Cells
- Protocol for the Preparation and Fluorescent ICC Staining of Stem Cells on Coverslips
- Protocol for the Preparation of a Cell Smear for Non-adherent Cell ICC - Graphic
- Quantikine HS ELISA Kit Assay Principle, Alkaline Phosphatase
- Quantikine HS ELISA Kit Principle, Streptavidin-HRP Polymer
- R&D Systems Quality Control Western Blot Protocol
- Sandwich ELISA (Colorimetric) – Biotin/Streptavidin Detection Protocol
- Sandwich ELISA (Colorimetric) – Direct Detection Protocol
- TUNEL and Active Caspase-3 Detection by IHC/ICC Protocol
- The Importance of IHC/ICC Controls
- Troubleshooting Guide: ELISA
- Troubleshooting Guide: Western Blot Figures
- Western Blot Conditions
- Western Blot Protocol
- Western Blot Protocol for Cell Lysates
- Western Blot Troubleshooting
- Western Blot Troubleshooting Guide
- View all Protocols, Troubleshooting, Illustrated assays and Webinars