IL-6 Antibody - Azide and BSA Free
Novus Biologicals | Catalog # NB600-1131
![Western Blot: IL-6 Antibody [NB600-1131]](https://resources.rndsystems.com/images/products/IL-6-Antibody-Western-Blot-NB600-1131-img0014.jpg "Western Blot: IL-6 Antibody [NB600-1131]")
Key Product Details
Species Reactivity
Validated:
Cited:
Applications
Validated:
Cited:
Label
Antibody Source
Format
Product Specifications
Immunogen
Reactivity Notes
Localization
Specificity
Clonality
Host
Isotype
Description
Scientific Data Images for IL-6 Antibody - Azide and BSA Free
Western Blot: IL-6 Antibody [NB600-1131]
Western Blot: IL-6 Antibody [NB600-1131] - Western Blot: IL-6 Antibody [HRP] [NBP1-42762] - Lane 1: Human IL-6. Lane 2: none. Load: 50 ng per lane. Primary antibody: none. Secondary antibody: Peroxidase Human IL-6 secondary antibody at 1:1,000 for 60 min at RT. Block: incubated with blocking buffer for 30 min at RT. Predicted/Observed size: 20 kDa for Human IL-6. Other band(s): none. Image using the HRP form of this antibody.![Immunohistochemistry: IL-6 Antibody [NB600-1131]](https://resources.rndsystems.com/images/products/IL-6-Antibody-Immunocytochemistry-Immunofluorescence-NB600-1131-img0015.jpg "Immunohistochemistry: IL-6 Antibody [NB600-1131]")
Immunohistochemistry: IL-6 Antibody [NB600-1131]
IL-6-Antibody-Immunocytochemistry-Immunofluorescence-NB600-1131-img0015.jpg![Western Blot: IL-6 Antibody [NB600-1131]](https://resources.rndsystems.com/images/products/IL-6-Antibody-Western-Blot-NB600-1131-img0013.jpg "Western Blot: IL-6 Antibody [NB600-1131]")
Western Blot: IL-6 Antibody [NB600-1131]
Western Blot: IL-6 Antibody [NB600-1131] - Protein was resolved on a 4-20% Tris-Glycine gel by SDS-PAGE and transferred onto nitrocellulose. The blot shows detection of a band 21 kDa in size corresponding to anti-IL6 antibody. Molecular weight markers are also shown (MW). After transfer, the membrane was blocked for 30 minutes with 1% BSA-TBST. Detection occurred using peroxidase conjugated anti-Rabbit IgG secondary antibody diluted 1:40,000 in blocking buffer for 30 min at RT followed by reaction with FemtoMax chemiluminescent substrate.
IL-6 Antibody
Western Blot of IL-6 Antibody. Lane 1: Opal Prestained Molecular Weight Marker
Immunocytochemistry/ Immunofluorescence: IL-6 Antibody [NB600-1131] -
Immunocytochemistry/ Immunofluorescence: IL-6 Antibody [NB600-1131] - GBM ECs express IL-6. a Human brain ECs were treated with glioma-CM for 24 h, & cell lysates were subjected to multiplex cytokine array analysis. Left, a representative blot. Right, quantified dot intensity of most significantly changed cytokines. b Human microvascular brain ECs were treated with glioma-CM that were harvested from different human glioma cells. Cell lysates were immunoblotted. c Human microvascular brain ECs & tumor-associated ECs isolated from different GBM patients were subjected to immunoblot analysis. d Mouse GBM was induced by orthotopic injection of GL26 glioma cells into wild-type mouse. The brain sections that include normal brains & tumors were stained with anti-CD31, anti-IL-6, & anti-CSF-1 antibodies. Representative immunofluorescence images are shown. Right, enlarged area in normal & tumor tissues. Bar represents 50 μm. Zoom-in factor: 4 Image collected & cropped by CiteAb from the following publication (https://pubmed.ncbi.nlm.nih.gov/29422647), licensed under a CC-BY license. Not internally tested by Novus Biologicals.
Western Blot: IL-6 Antibody - Azide and BSA Free [NB600-1131] -
IL-6 and IL-6 receptors are elevated in murine and human post thrombotic tissue. A. Plasma IL-6 levels drawn following sham surgery with retroperitoneal dissection or surgery with IVC ligation in WT mice resulting in stasis thrombosis (n = 5 per group). Following sham surgery or stasis thrombosis, vein wall lysate protein levels (B) of IL-6 (C) and CD126 (D) measured by Western blotting (n = 4–10/group). Gel blots cropped from different parts of the gel are presented, with white line separation. Protein levels of intrathrombus (E) IL-6 (F) and CD126 receptor (G) were measured at 4 and 8 days in partially occlusive (stenosis) and completely occlusive thrombi (stasis). All data presented as mean +/- standard deviation. Normally distributed data was compared utilizing unpaired student’s test with Welch’s correction and non-normally distributed data compared with Mann–Whitney U test. *p < 0.05, **p < 0.01. Image collected and cropped by CiteAb from the following open publication (https://pubmed.ncbi.nlm.nih.gov/36828892), licensed under a CC-BY license. Not internally tested by Novus Biologicals.
Western Blot: IL-6 Antibody - Azide and BSA Free [NB600-1131] -
Regulation of IL-6 by sorafenib was dosage and time specific (A-C). Low and median dosages of sorafenib (2.5-7.5 umol/L) upregulated IL-6 expression after 24 h to 72 h of administration in HCCLM3‑wt cells; high dosage of sorafenib (10 umol/L) upregulated IL-6 expression in 24 h but downregulated IL-6 expression from 48 h to 72 h of administration (Western blot analysis, *** P < 0.001); Regulation of PFKFB3 by sorafenib is dosage and time specific (D-F). Low and median dosages of sorafenib (2.5-7.5 umol/L) downregulated PFKFB3 expression in 24 h but upregulated it from 48 h to 72 h. A high dosage of sorafenib (10 umol/L) down-regulated PFKFB3 expression after 24 h to 72 h of administration in HCCLM3‑wt cells (Western blot analysis, *** P < 0.001); Regulation of HIF-1 alpha by sorafenib is dosage and time specific (G-I). Low and median dosage of sorafenib (2.5-7.5 umol/L) upregulated HIF-1 alpha expression in 24 h but downregulated it from 48 h to 72 h of administration. High dosage of sorafenib (10 umol/L) up-regulated PFKFB3 expression after 24 h to 72 h of administration in HCCLM3‑wt cells (Western blot analysis, *** P < 0.001) Image collected and cropped by CiteAb from the following open publication (https://pubmed.ncbi.nlm.nih.gov/37476196), licensed under a CC-BY license. Not internally tested by Novus Biologicals.
Western Blot: IL-6 Antibody - Azide and BSA Free [NB600-1131] -
Hippocampal regulatory proteins for synaptic plasticity were restored, and inflammatory cytokines decreased in sleep-deprived mice treated with SS31. Western blotting was performed on hippocampus using specific antibodies for the detection of (A) NMDA receptor, (B) p-CREB, (C) BDNF, (D) MCP-1, (E) TNF-alpha, (F) IL-6, and (G) caspase-3, with Actin used as loading control. The densitometry values for the proteins were normalized to those of Actin, with non-SD group being 1. All data represent the mean +/- SEM (n = 5 per group). ** p < 0.01, *** p < 0.001, statistically significant difference between SD group/SD + Saline group and Non-SD group. # p < 0.05, ## p < 0.01, statistically significant difference between SD + SS31 group and SD group/SD + Saline group. Image collected and cropped by CiteAb from the following open publication (https://pubmed.ncbi.nlm.nih.gov/33089207), licensed under a CC-BY license. Not internally tested by Novus Biologicals.
Western Blot: IL-6 Antibody - Azide and BSA Free [NB600-1131] -
Regulation of IL-6 by sorafenib was dosage and time specific (A-C). Low and median dosages of sorafenib (2.5-7.5 umol/L) upregulated IL-6 expression after 24 h to 72 h of administration in HCCLM3‑wt cells; high dosage of sorafenib (10 umol/L) upregulated IL-6 expression in 24 h but downregulated IL-6 expression from 48 h to 72 h of administration (Western blot analysis, *** P < 0.001); Regulation of PFKFB3 by sorafenib is dosage and time specific (D-F). Low and median dosages of sorafenib (2.5-7.5 umol/L) downregulated PFKFB3 expression in 24 h but upregulated it from 48 h to 72 h. A high dosage of sorafenib (10 umol/L) down-regulated PFKFB3 expression after 24 h to 72 h of administration in HCCLM3‑wt cells (Western blot analysis, *** P < 0.001); Regulation of HIF-1 alpha by sorafenib is dosage and time specific (G-I). Low and median dosage of sorafenib (2.5-7.5 umol/L) upregulated HIF-1 alpha expression in 24 h but downregulated it from 48 h to 72 h of administration. High dosage of sorafenib (10 umol/L) up-regulated PFKFB3 expression after 24 h to 72 h of administration in HCCLM3‑wt cells (Western blot analysis, *** P < 0.001) Image collected and cropped by CiteAb from the following open publication (https://pubmed.ncbi.nlm.nih.gov/37476196), licensed under a CC-BY license. Not internally tested by Novus Biologicals.
Western Blot: IL-6 Antibody - Azide and BSA Free [NB600-1131] -
A20 downregulation promoted necroptosis in vitro. (A) Primary neuron and astrocyte were obtained and verified in relative antibody. (B) A20 protein expression in primary neuron, primary astrocyte and HAPI. (C) Relative mRNA expression of A20 in different cell types was obtained from a database of Stanford University (https://web.stanford.edu/group/barres_lab/brain_rnaseq.html). (D) A20 was significantly decreased after si-A20 treatment in the three cell types, including primary neuron, primary astrocyte and HAPI. (E,F) Tumor necrosis factor (TNF)-alpha (10 ng/ml) + Z-VAD (100 μm) combination (TZ) as a necroptosis inducer was used for 24 h. In primary neuron, RIP1, RIP3 and MLKL were tested by western blot. Data were analyzed by statistical. (G,H) TUNEL assays and (I) CCK-8 (n = 4) were used to test cell death and viability of neuron after 24 h treatment. (J–M) Western blot assay was used to test RIP1, RIP3, MLKL, NF-KB and relative inflammatory factors in primary HAPI and astrocyte respectively. Data were measured by one way ANOVA plus Tukey’s test. *P < 0.05 and **P < 0.01 vs. TZ group; #P < 0.05 and ##P < 0.01 vs. TZ+si-NC group. Image collected and cropped by CiteAb from the following open publication (https://pubmed.ncbi.nlm.nih.gov/31607859), licensed under a CC-BY license. Not internally tested by Novus Biologicals.
Western Blot: IL-6 Antibody - Azide and BSA Free [NB600-1131] -
AAV-shA20 restored inflammatory responses. (A,B) Interleukin-6 (IL-6), interleukin-1 (IL-1 beta ) and NLRP3 were detected in cortex tissues and hippocampal CA1 tissues by immunoblotting, respectively. The results including cortex (C–E) and hippocampus CA1 (F–H) were analyzed by statistical. (I) Representative images of double IL-1 beta (red) and Iba-1 (green) positive cells; NLRP3 (red) and Iba-1 (green); IL-6 (red) and GFAP (green) in the hippocampus CA1 location, as determined by immunofluorescence staining. Nuclei were stained with DAPI (blue). Data were measured by one way ANOVA plus Tukey’s test. *P < 0.05 and **P < 0.01 vs. CCI+AAV-shCtrl group. #P < 0.05 and ##P < 0.01 vs. CCI+AAV-shCtrl+Nec-1 or CCI+AAV-shCtrl+melatonin group, respectively. Image collected and cropped by CiteAb from the following open publication (https://pubmed.ncbi.nlm.nih.gov/31607859), licensed under a CC-BY license. Not internally tested by Novus Biologicals.
Western Blot: IL-6 Antibody - Azide and BSA Free [NB600-1131] -
Effects of CpG ODN and fMLP stimulation on the levels of IL6 and TNF alpha in Z310 cells. Protein levels of IL6 and TNF alpha in Z310 cells treated with 2.5 uM of CpG ODN (TLR9 agonist) and 20 uM fMLP (FPR2 agonist) were analyzed using ICC and Western blots. Panel (A) shows the immunoquantification of IL6 and TNF alpha in cells treated with CpG ODN for 24 h. Results of densitometric measurements of bands from triplicate Western blot analysis normalized to the housekeeping protein vinculin are depicted in the graphs in panel (B) Graph (C) denotes the immunoquantification of IL6 and TNF alpha in cells treated with fMLP for 24 h. Densitometric measurements of bands from triplicate Western blot analysis normalized to the vinculin are shown in panel (D) graphs. Results are characterized as means +/- SEM. *Indicates p < 0.05, and **indicates p < 0.01 compared to the control. Image collected and cropped by CiteAb from the following open publication (https://www.frontiersin.org/articles/10.3389/fpain.2024.1488369/full), licensed under a CC-BY license. Not internally tested by Novus Biologicals.
Western Blot: IL-6 Antibody - Azide and BSA Free [NB600-1131] -
Downstream receptor for advanced glycation end-products (RAGE) and nuclear factor (NF)-kappa B pathway were inhibited after treatment of Nec-1 and melatonin. NF-kappa B pathway was detected by immunoblotting in the cortex (A–E) and hippocampus CA1 (F–J). Relative downstream inflammatory factors were detected by immunoblotting in the cortex (K–N) and hippocampus CA1 (O–R). All experiments were performed in triplicate by one way ANOVA plus Tukey’s test. **P < 0.01 and ***P < 0.001 vs. sham group. #P < 0.05 and ##P < 0.01 vs. CCI group. Image collected and cropped by CiteAb from the following open publication (https://pubmed.ncbi.nlm.nih.gov/31607859), licensed under a CC-BY license. Not internally tested by Novus Biologicals.
Western Blot: IL-6 Antibody - Azide and BSA Free [NB600-1131] -
AAV-shA20 restored inflammatory responses. (A,B) Interleukin-6 (IL-6), interleukin-1 (IL-1 beta ) and NLRP3 were detected in cortex tissues and hippocampal CA1 tissues by immunoblotting, respectively. The results including cortex (C–E) and hippocampus CA1 (F–H) were analyzed by statistical. (I) Representative images of double IL-1 beta (red) and Iba-1 (green) positive cells; NLRP3 (red) and Iba-1 (green); IL-6 (red) and GFAP (green) in the hippocampus CA1 location, as determined by immunofluorescence staining. Nuclei were stained with DAPI (blue). Data were measured by one way ANOVA plus Tukey’s test. *P < 0.05 and **P < 0.01 vs. CCI+AAV-shCtrl group. #P < 0.05 and ##P < 0.01 vs. CCI+AAV-shCtrl+Nec-1 or CCI+AAV-shCtrl+melatonin group, respectively. Image collected and cropped by CiteAb from the following open publication (https://pubmed.ncbi.nlm.nih.gov/31607859), licensed under a CC-BY license. Not internally tested by Novus Biologicals.Applications for IL-6 Antibody - Azide and BSA Free
ELISA
Immunocytochemistry/ Immunofluorescence
Immunohistochemistry
Immunohistochemistry-Paraffin
Immunoprecipitation
Western Blot
Reviewed Applications
Read 1 review rated 1 using NB600-1131 in the following applications:
Formulation, Preparation, and Storage
Purification
Formulation
Format
Preservative
Concentration
Shipping
Stability & Storage
Background: IL-6
Long Name
Alternate Names
Gene Symbol
UniProt
Additional IL-6 Products
Product Documents for IL-6 Antibody - Azide and BSA Free
Certificate of Analysis
To download a Certificate of Analysis, please enter a lot or batch number in the search box below.
Product Specific Notices for IL-6 Antibody - Azide and BSA Free
This product is for research use only and is not approved for use in humans or in clinical diagnosis. Primary Antibodies are guaranteed for 1 year from date of receipt.
Related Research Areas
Citations for IL-6 Antibody - Azide and BSA Free
 Powered by Bioz
Customer Reviews for IL-6 Antibody - Azide and BSA Free (1)
Have you used IL-6 Antibody - Azide and BSA Free?
Submit a review and receive an Amazon gift card!
$25/€18/£15/$25CAN/¥2500 Yen for a review with an image
$10/€7/£6/$10CAN/¥1110 Yen for a review without an image
Submit a review
Customer Images
-
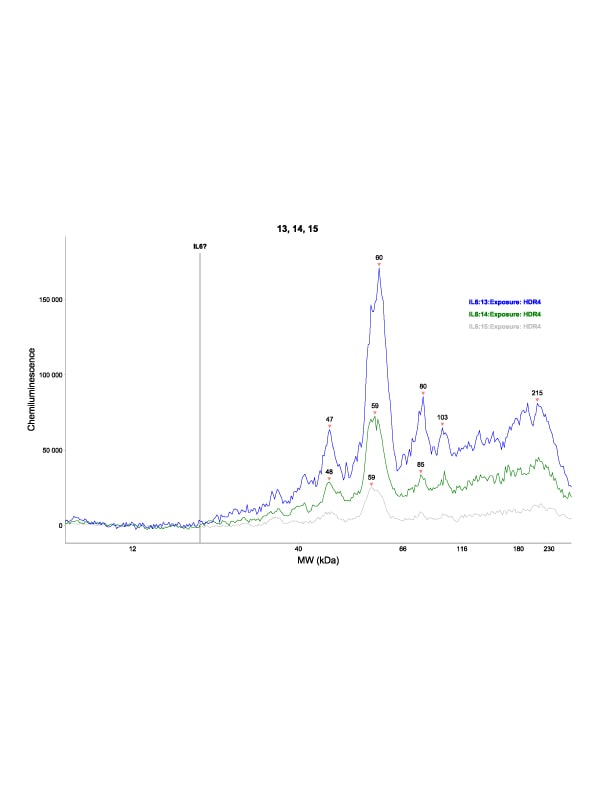
Application: Simple WesternSample Tested: skin wound - healthySpecies: RatVerified Customer | Posted 02/12/2020
 Bio-Techne ResponseThis review was submitted through the legacy Novus Innovators Program, reflecting a new species or application tested on a primary antibody.
There are no reviews that match your criteria.
Protocols
View specific protocols for IL-6 Antibody - Azide and BSA Free (NB600-1131):
Materials
1) 1 Phosphate buffered saline (pH 7.6): NaCl 137mmol/L, KCl 2.7mmol/L, Na2HPO4 4.3mmol/L, KH2PO4 1.4 mmol/L
2) Citrate buffer, 0.01 M, pH6.0, Sodium Citrate 3g, Citric acid 0.4g
3) 3% Hydrogen peroxide
4) Primary antibody
5) Blocking serum (normal serum)
6) Biotinylated secondary antibody
7) DAB staining kit
Methods
1. Dewax and hydration of slides using xylene and EtOH:
Dry slides for 20 min in a 60 C oven
Add Xylene, 2 x 10 min
100%, 95%, 80%, and 70% EtOH, 5 min each EtOH concentration
Rinse in PBS, 5'
2 Antigen retrieval method (only for paraffin slides)
1a. High-pressure antigen retrieval procedure (recommended method)
Place slides in a glass slide holder (ensure that the slide holder is completely filled with slides, slides without sections if necessary, to ensure even heating. The entire slide holder is immersed in 1000 ml of Citrate buffer (0.01M, pH6.0) within a pressure cooker
Once steam is produced, and ONLY when steam is visible, from the pressure cooker (usually 15-20 min), the required high-pressure will have been reached, and slides will be incubated for 2 min.
Turn off heat, and allow buffer and slides to cool to room temperature
Slides are then rinsed in PBS for 5 minutes
2. Add 3% hydrogen peroxide solution, 10'at RT, then PBS, 3X5'
3. Normal blocking serum, 20'at RT
4. Incubate with Primary Ab, 4C overnight or 1.5 hours at 37C
5. Rinse with PBS, 3 X 5' each rinse
6. Add Biotin-conjugated second antibody, 10'at RT
7. Rinse with PBS, 3 X 5' each rinse
8. Add Streptavidin-Peroxidase, 10'at RT
9. Rinse with PBS, 3 X 5' each rinse
10. Staining with DAB solution, 2-5'under microscope
11. Stop the reaction by washing in tap water
12. Counterstain in Haematoxylin for 3-5 minutes
13. 75%, 80%, 95% and 100% ethanol, 5x2', xylene 2 x 10'
Find general support by application which include: protocols, troubleshooting, illustrated assays, videos and webinars.
- Antigen Retrieval Protocol (PIER)
- Antigen Retrieval for Frozen Sections Protocol
- Appropriate Fixation of IHC/ICC Samples
- Cellular Response to Hypoxia Protocols
- Chromogenic IHC Staining of Formalin-Fixed Paraffin-Embedded (FFPE) Tissue Protocol
- Chromogenic Immunohistochemistry Staining of Frozen Tissue
- ClariTSA™ Fluorophore Kits
- Detection & Visualization of Antibody Binding
- ELISA Sample Preparation & Collection Guide
- ELISA Troubleshooting Guide
- Fluorescent IHC Staining of Frozen Tissue Protocol
- Graphic Protocol for Heat-induced Epitope Retrieval
- Graphic Protocol for the Preparation and Fluorescent IHC Staining of Frozen Tissue Sections
- Graphic Protocol for the Preparation and Fluorescent IHC Staining of Paraffin-embedded Tissue Sections
- Graphic Protocol for the Preparation of Gelatin-coated Slides for Histological Tissue Sections
- How to Run an R&D Systems DuoSet ELISA
- How to Run an R&D Systems Quantikine ELISA
- How to Run an R&D Systems Quantikine™ QuicKit™ ELISA
- ICC Cell Smear Protocol for Suspension Cells
- ICC Immunocytochemistry Protocol Videos
- ICC for Adherent Cells
- IHC Sample Preparation (Frozen sections vs Paraffin)
- Immunocytochemistry (ICC) Protocol
- Immunocytochemistry Troubleshooting
- Immunofluorescence of Organoids Embedded in Cultrex Basement Membrane Extract
- Immunofluorescent IHC Staining of Formalin-Fixed Paraffin-Embedded (FFPE) Tissue Protocol
- Immunohistochemistry (IHC) and Immunocytochemistry (ICC) Protocols
- Immunohistochemistry Frozen Troubleshooting
- Immunohistochemistry Paraffin Troubleshooting
- Immunoprecipitation Protocol
- Preparing Samples for IHC/ICC Experiments
- Preventing Non-Specific Staining (Non-Specific Binding)
- Primary Antibody Selection & Optimization
- Protocol for Heat-Induced Epitope Retrieval (HIER)
- Protocol for Making a 4% Formaldehyde Solution in PBS
- Protocol for VisUCyte™ HRP Polymer Detection Reagent
- Protocol for the Fluorescent ICC Staining of Cell Smears - Graphic
- Protocol for the Fluorescent ICC Staining of Cultured Cells on Coverslips - Graphic
- Protocol for the Preparation & Fixation of Cells on Coverslips
- Protocol for the Preparation and Chromogenic IHC Staining of Frozen Tissue Sections
- Protocol for the Preparation and Chromogenic IHC Staining of Frozen Tissue Sections - Graphic
- Protocol for the Preparation and Chromogenic IHC Staining of Paraffin-embedded Tissue Sections
- Protocol for the Preparation and Chromogenic IHC Staining of Paraffin-embedded Tissue Sections - Graphic
- Protocol for the Preparation and Fluorescent ICC Staining of Cells on Coverslips
- Protocol for the Preparation and Fluorescent ICC Staining of Non-adherent Cells
- Protocol for the Preparation and Fluorescent ICC Staining of Stem Cells on Coverslips
- Protocol for the Preparation and Fluorescent IHC Staining of Frozen Tissue Sections
- Protocol for the Preparation and Fluorescent IHC Staining of Paraffin-embedded Tissue Sections
- Protocol for the Preparation of Gelatin-coated Slides for Histological Tissue Sections
- Protocol for the Preparation of a Cell Smear for Non-adherent Cell ICC - Graphic
- Quantikine HS ELISA Kit Assay Principle, Alkaline Phosphatase
- Quantikine HS ELISA Kit Principle, Streptavidin-HRP Polymer
- R&D Systems Quality Control Western Blot Protocol
- Sandwich ELISA (Colorimetric) – Biotin/Streptavidin Detection Protocol
- Sandwich ELISA (Colorimetric) – Direct Detection Protocol
- TUNEL and Active Caspase-3 Detection by IHC/ICC Protocol
- The Importance of IHC/ICC Controls
- Troubleshooting Guide: ELISA
- Troubleshooting Guide: Immunohistochemistry
- Troubleshooting Guide: Western Blot Figures
- Western Blot Conditions
- Western Blot Protocol
- Western Blot Protocol for Cell Lysates
- Western Blot Troubleshooting
- Western Blot Troubleshooting Guide
- View all Protocols, Troubleshooting, Illustrated assays and Webinars
FAQs for IL-6 Antibody - Azide and BSA Free
-
Q: I had a quick question regarding NB600-1131SS IL-6 antibody. Not sure if you guys would be able to answer but how low do you think I could go on protein amount loaded to pick up a band? I see on the data sheet you guys have loaded 50ug and I cant load that much based on the nature of my samples.
A: We usually recommend anywhere from 10-50 ug/lane of protein. I wouldn't recommend using much lower than 10 ug of sample.
-
Q: I was wondering if you know of any blocking antibodies against IL-6 or VEGF-C that can be used in cell culture to quench these cytokines?
A:
We have no antibodies that are currently known to show blocking antibodies to VEGF-C. Please see this link to our IL-6 antibodies with blocking/neutralizing activity can be found at this link.
-
Q: I had a quick question regarding NB600-1131SS IL-6 antibody. Not sure if you guys would be able to answer but how low do you think I could go on protein amount loaded to pick up a band? I see on the data sheet you guys have loaded 50ug and I cant load that much based on the nature of my samples.
A: We usually recommend anywhere from 10-50 ug/lane of protein. I wouldn't recommend using much lower than 10 ug of sample.
-
Q: I was wondering if you know of any blocking antibodies against IL-6 or VEGF-C that can be used in cell culture to quench these cytokines?
A:
We have no antibodies that are currently known to show blocking antibodies to VEGF-C. Please see this link to our IL-6 antibodies with blocking/neutralizing activity can be found at this link.
Associated Pathways