
Key Product Details
Validated by
Biological Validation
Species Reactivity
Validated:
Mouse
Cited:
Human, Mouse, Rat, Fish - Danio rerio (Zebrafish), Primate - Chlorocebus aethiops (African Green Monkey)
Applications
Validated:
Immunohistochemistry, Western Blot, Flow Cytometry, CyTOF-ready
Cited:
Immunohistochemistry, Immunohistochemistry-Paraffin, Immunohistochemistry-Frozen, Western Blot, Flow Cytometry, Immunofluorescence, Immunoprecipitation, Bioassay
Label
Unconjugated
Antibody Source
Polyclonal Goat IgG
Loading...
Product Specifications
Immunogen
Mouse myeloma cell line NS0-derived recombinant mouse EphB4
Leu16-Ala539
Accession # P54761
Leu16-Ala539
Accession # P54761
Specificity
Detects mouse EphB4 in direct ELISAs and Western blots. In direct ELISAs, approximately 5% cross-reactivity with recombinant mouse (rm) EphB6 and rmEphA3 is observed and less than 1% cross-reactivity with rmEphA2, rmEphA4, rmEphA6, rmEphA7, rmEphA8, rmEphB2, and rmEphB3 is observed.
Clonality
Polyclonal
Host
Goat
Isotype
IgG
Scientific Data Images for Mouse EphB4 Antibody
EphB4 in Mouse Embryo.
EphB4 was detected in immersion fixed frozen sections of mouse embryo (15 d.p.c.) using Goat Anti-Mouse EphB4 Antigen Affinity-purified Polyclonal Antibody (Catalog # AF446) at 15 µg/mL overnight at 4 °C. Tissue was stained using the Anti-Goat HRP-DAB Cell & Tissue Staining Kit (brown; Catalog # CTS008) and counterstained with hematoxylin (blue). View our protocol for Chromogenic IHC Staining of Frozen Tissue Sections.
Detection of Mouse EphB4 by Western Blot
Reduced Eph-B4 activity increases venous neointimal thickening. (A) Representative photomicrographs (left panel) and bar graph (right panel) showing AVF venous limb wall thickness in control and Eph-B4 het mice (day 21); *P = 0.047 (t-test). n = 8. Scale bar 25 µm. (B) Line graph showing infrarenal IVC diameter in control or Eph-B4 het mice; *P = 0.59 (ANOVA). n = 8–9. (C) Representative Western blot showing inhibited tyrosine phosphorylation in the Y774F-Eph-B4 mutant compared to the WT-Eph-B4 construct (0–60 min). (D) Bar graph showing Ephrin-B2/Fc stimulated COS cell migration after transfection with WT-Eph-B4 or Y774F-Eph-B4 plasmids. P < 0.0001 (ANOVA); *P < 0.0001 Ephrin-B2/Fc WT-Eph-B4 vs Y774F-Eph-B4. n = 3–4. (E) Representative photomicrographs (left panel) showing AVF venous wall (elastin stain) in control mice or mice treated with WT-Eph-B4 or mutant Y774F-Eph-B4. Arrow heads denote neointimal thickness. Scale bar, 25 µm. Bar graph (right panel) showing quantification of AVF venous wall thickness in control mice (white bar) or mice treated with WT-Eph-B4 (gray bar) or mutant Y774F-Eph-B4 (blue bar), day 21; P = 0.035 (ANOVA). *P = 0.038 (WT-Eph-B4 vs Y774F-Eph-B4; post hoc). n = 5–7. (F) Line graph showing infrarenal IVC diameter in mice with AVF treated with WT-Eph-B4 (gray line) or mutant Y774F-Eph-B4 (purple line) compared to control (black line); *P = 0.005 (ANOVA). n = 5–11. Data represent mean ± SEM. Image collected and cropped by CiteAb from the following open publication (https://pubmed.ncbi.nlm.nih.gov/29133876), licensed under a CC-BY license. Not internally tested by R&D Systems.
Detection of Human EphB4 by Western Blot
Increased Eph-B4 and Ephrin-B2 expression during adaptive venous remodeling. (A) Western blot and adjacent bar graph of densitometry showing human Eph-B4 expression in AVF venous limb compared to normal vein. *P = 0.0016; t-test. n = 3–4. (B) Line graphs show expression of Eph-B4 (blue) and Ephrin-B2 (red) in the AVF venous limb compared to sham IVC; P < 0.0001 (ANOVA). *P < 0.05 (P = 0.0123, Eph-B4; P = 0.0041, Ephrin-B2; post hoc); **P < 0.05 (P < 0.0001, Ephrin-B2; post hoc). n = 5–8. (C) Western blots showing Eph-B4 and Ephrin-B2 protein expression in AVF venous limb compared to sham IVC. n = 3–5. (D) Graphs showing densitometry of Eph-B4 (left panel) and Ephrin-B2 (right panel) expression in the AVF venous limb compared to sham IVC; *P < 0.05 (P < 0.0001, Eph-B4 day 7, AVF vs sham; P < 0.0001, Eph-B4 day 21, AVF vs sham; P < 0.0001, Ephrin-B2 day 7, AVF vs sham; post hoc). n = 3–5. (E) Diagram of rat model showing location of infrarenal IVC pericardial patch exposed to an aortocaval AVF (n = 6 per group). (F) Representative Western blot (upper panel) showing Eph-B4 and Ephrin-B2 expression in patch neointima (day 14) of control vein compared to patch neointima of AVF vein. Graphs (lower panel) show quantification of western blot bands; P < 0.0001 (ANOVA). *P < 0.05 (P = 0.0003, Eph-B4; P = 0.0043, Ephrin-B2; post hoc). n = 3. (G) Representative photomicrographs (upper panel) showing Eph-B4 (green) and Ephrin-B2 (red) immunoreactive signal (day 14). White arrowheads indicate colocalization of Eph-B4 and Ephrin-B2. L, vessel lumen. Graph (lower panel) shows quantification of immunoreactive signal; P < 0.0001 (ANOVA). *P < 0.05 (P = 0.0136 Eph-B4; P < 0.0001 Ephrin-B2; post hoc). n = 3. Scale bar 100 µm. Data represent mean ± SEM. Image collected and cropped by CiteAb from the following open publication (https://pubmed.ncbi.nlm.nih.gov/29133876), licensed under a CC-BY license. Not internally tested by R&D Systems.
Detection of Human EphB4 by Western Blot
Increased Eph-B4 and Ephrin-B2 expression during adaptive venous remodeling. (A) Western blot and adjacent bar graph of densitometry showing human Eph-B4 expression in AVF venous limb compared to normal vein. *P = 0.0016; t-test. n = 3–4. (B) Line graphs show expression of Eph-B4 (blue) and Ephrin-B2 (red) in the AVF venous limb compared to sham IVC; P < 0.0001 (ANOVA). *P < 0.05 (P = 0.0123, Eph-B4; P = 0.0041, Ephrin-B2; post hoc); **P < 0.05 (P < 0.0001, Ephrin-B2; post hoc). n = 5–8. (C) Western blots showing Eph-B4 and Ephrin-B2 protein expression in AVF venous limb compared to sham IVC. n = 3–5. (D) Graphs showing densitometry of Eph-B4 (left panel) and Ephrin-B2 (right panel) expression in the AVF venous limb compared to sham IVC; *P < 0.05 (P < 0.0001, Eph-B4 day 7, AVF vs sham; P < 0.0001, Eph-B4 day 21, AVF vs sham; P < 0.0001, Ephrin-B2 day 7, AVF vs sham; post hoc). n = 3–5. (E) Diagram of rat model showing location of infrarenal IVC pericardial patch exposed to an aortocaval AVF (n = 6 per group). (F) Representative Western blot (upper panel) showing Eph-B4 and Ephrin-B2 expression in patch neointima (day 14) of control vein compared to patch neointima of AVF vein. Graphs (lower panel) show quantification of western blot bands; P < 0.0001 (ANOVA). *P < 0.05 (P = 0.0003, Eph-B4; P = 0.0043, Ephrin-B2; post hoc). n = 3. (G) Representative photomicrographs (upper panel) showing Eph-B4 (green) and Ephrin-B2 (red) immunoreactive signal (day 14). White arrowheads indicate colocalization of Eph-B4 and Ephrin-B2. L, vessel lumen. Graph (lower panel) shows quantification of immunoreactive signal; P < 0.0001 (ANOVA). *P < 0.05 (P = 0.0136 Eph-B4; P < 0.0001 Ephrin-B2; post hoc). n = 3. Scale bar 100 µm. Data represent mean ± SEM. Image collected and cropped by CiteAb from the following open publication (https://pubmed.ncbi.nlm.nih.gov/29133876), licensed under a CC-BY license. Not internally tested by R&D Systems.Applications for Mouse EphB4 Antibody
Application
Recommended Usage
CyTOF-ready
Ready to be labeled using established conjugation methods. No BSA or other carrier proteins that could interfere with conjugation.
Flow Cytometry
2.5 µg/106 cells
Sample: MCF‑7 human breast cancer cell line
Sample: MCF‑7 human breast cancer cell line
Immunohistochemistry
5-15 µg/mL
Sample: Immersion fixed frozen sections of mouse embryo (E13-15)
Sample: Immersion fixed frozen sections of mouse embryo (E13-15)
Western Blot
0.1 µg/mL
Sample: Recombinant Mouse EphB4 Fc Chimera (Catalog # 446-B4)
Sample: Recombinant Mouse EphB4 Fc Chimera (Catalog # 446-B4)
Reviewed Applications
Read 4 reviews rated 4.3 using AF446 in the following applications:
Flow Cytometry Panel Builder
Bio-Techne Knows Flow Cytometry
Save time and reduce costly mistakes by quickly finding compatible reagents using the Panel Builder Tool.
Advanced Features
- Spectra Viewer - Custom analysis of spectra from multiple fluorochromes
- Spillover Popups - Visualize the spectra of individual fluorochromes
- Antigen Density Selector - Match fluorochrome brightness with antigen density

Formulation, Preparation, and Storage
Purification
Antigen Affinity-purified
Reconstitution
Reconstitute at 0.2 mg/mL in sterile PBS. For liquid material, refer to CoA for concentration.
Loading...
Formulation
Lyophilized from a 0.2 μm filtered solution in PBS with Trehalose. *Small pack size (SP) is supplied either lyophilized or as a 0.2 µm filtered solution in PBS.
Shipping
Lyophilized product is shipped at ambient temperature. Liquid small pack size (-SP) is shipped with polar packs. Upon receipt, store immediately at the temperature recommended below.
Stability & Storage
Use a manual defrost freezer and avoid repeated freeze-thaw cycles.
- 12 months from date of receipt, -20 to -70 °C as supplied.
- 1 month, 2 to 8 °C under sterile conditions after reconstitution.
- 6 months, -20 to -70 °C under sterile conditions after reconstitution.
Calculators
Background: EphB4
References
- Eph Nomenclature Committee [letter] (1997) Cell 90:403.
- Flanagan, J.G. and P. Vanderhaeghen (1998) Annu. Rev. Neurosci. 21:309.
- Pasquale, E.B. (1997) Curr. Opin. Cell Biol. 9:608.
Long Name
Eph Receptor B4
Alternate Names
Htk, Mdk2, Myk1, Tyro11
Gene Symbol
EPHB4
UniProt
Additional EphB4 Products
Product Documents for Mouse EphB4 Antibody
Certificate of Analysis
To download a Certificate of Analysis, please enter a lot or batch number in the search box below.
Note: Certificate of Analysis not available for kit components.
Product Specific Notices for Mouse EphB4 Antibody
For research use only
Related Research Areas
Citations for Mouse EphB4 Antibody
 Powered by Bioz
Customer Reviews for Mouse EphB4 Antibody (4)
4.3 out of 5
4 Customer Ratings
Have you used Mouse EphB4 Antibody?
Submit a review and receive an Amazon gift card!
$25/€18/£15/$25CAN/¥2500 Yen for a review with an image
$10/€7/£6/$10CAN/¥1110 Yen for a review without an image
Submit a review
Customer Images
Showing
1
-
4 of
4 reviews
Showing All
Filter By:
-
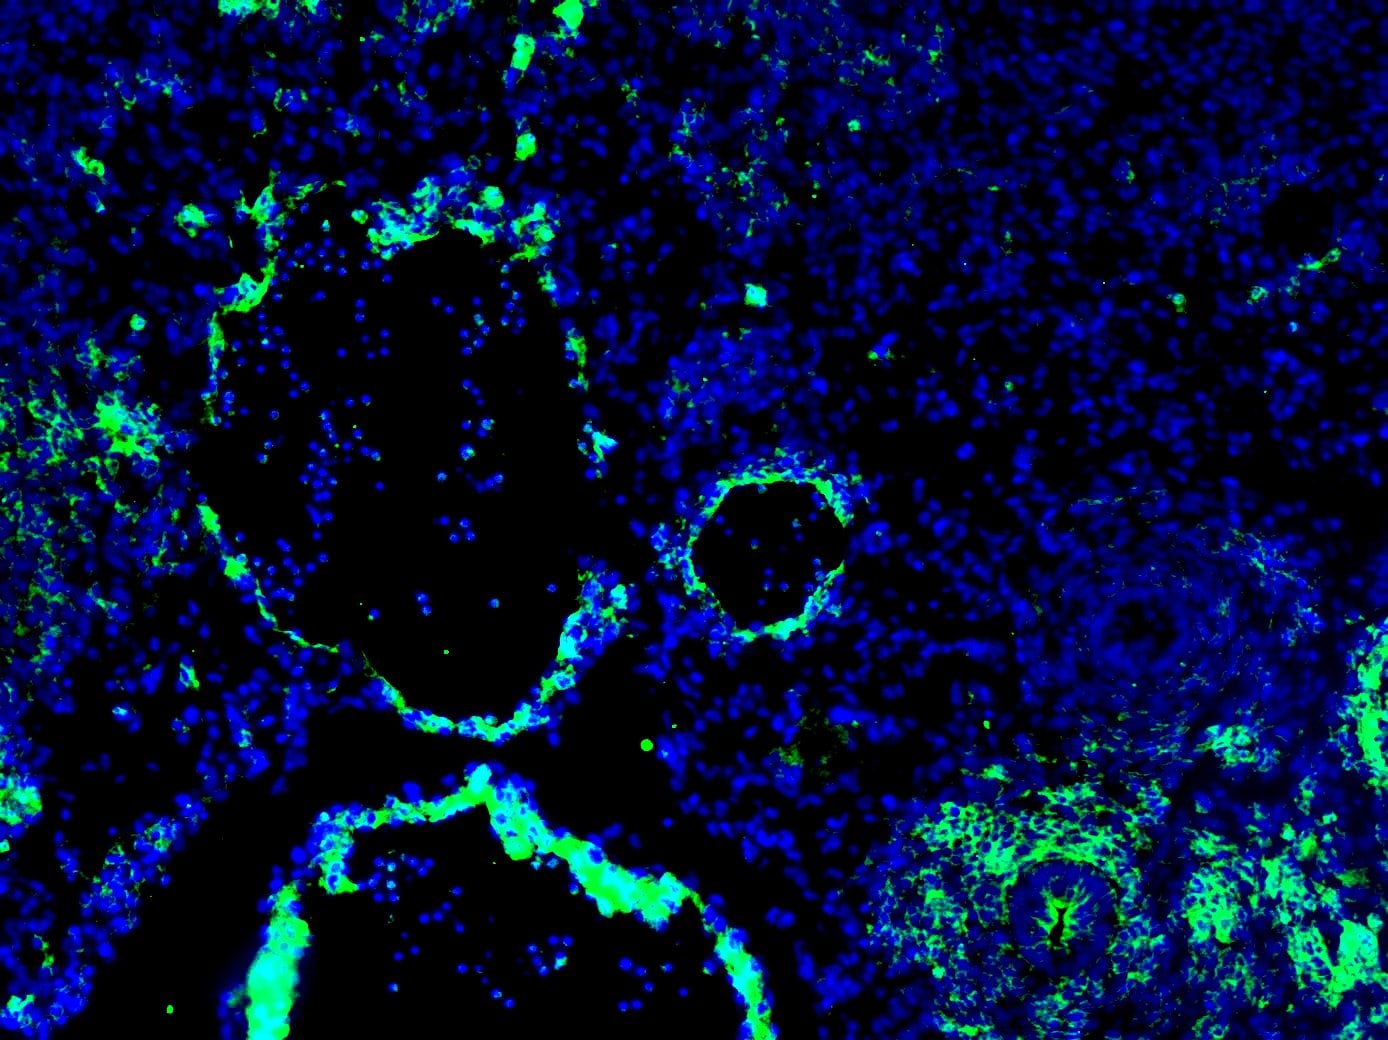
Application: Immunocytochemistry/ImmunofluorescenceSample Tested: E12.5 mouse embryo fixed in 4% PFASpecies: MouseVerified Customer | Posted 12/16/2020Dilution used - 1:200. The staining was done on an E12.5 transverse (4% PFA fixed) mouse section using standard IF techniques. Used 1% BSA for blocking for 1 hour before adding the primary antibody. The results are hit or miss for me, because I have noticed expression on non target tissue (Sometimes it doesn't appear, sometimes it does). Attached pictures shows a artery (smaller circle) and a vein (bigger circle), and while the EphB4 expression on the vein is very good (as it is supposed to express there), there seems to be some non-specific expression on the adjacent artery as well.

-
Application: Western BlotSample Tested: embryosSpecies: ZebrafishVerified Customer | Posted 11/13/2020
-
Application: Western BlotSample Tested: See PMID 22398409Species: RatVerified Customer | Posted 01/08/2015
-
Application: ImmunofluorescenceSample Tested: See PMID 22398409Species: RatVerified Customer | Posted 01/08/2015
There are no reviews that match your criteria.
Protocols
Find general support by application which include: protocols, troubleshooting, illustrated assays, videos and webinars.
- 7-Amino Actinomycin D (7-AAD) Cell Viability Flow Cytometry Protocol
- Antigen Retrieval Protocol (PIER)
- Antigen Retrieval for Frozen Sections Protocol
- Appropriate Fixation of IHC/ICC Samples
- Cellular Response to Hypoxia Protocols
- Chromogenic IHC Staining of Formalin-Fixed Paraffin-Embedded (FFPE) Tissue Protocol
- Chromogenic Immunohistochemistry Staining of Frozen Tissue
- ClariTSA™ Fluorophore Kits
- Detection & Visualization of Antibody Binding
- Extracellular Membrane Flow Cytometry Protocol
- Flow Cytometry Protocol for Cell Surface Markers
- Flow Cytometry Protocol for Staining Membrane Associated Proteins
- Flow Cytometry Staining Protocols
- Flow Cytometry Troubleshooting Guide
- Fluorescent IHC Staining of Frozen Tissue Protocol
- Graphic Protocol for Heat-induced Epitope Retrieval
- Graphic Protocol for the Preparation and Fluorescent IHC Staining of Frozen Tissue Sections
- Graphic Protocol for the Preparation and Fluorescent IHC Staining of Paraffin-embedded Tissue Sections
- Graphic Protocol for the Preparation of Gelatin-coated Slides for Histological Tissue Sections
- IHC Sample Preparation (Frozen sections vs Paraffin)
- Immunofluorescent IHC Staining of Formalin-Fixed Paraffin-Embedded (FFPE) Tissue Protocol
- Immunohistochemistry (IHC) and Immunocytochemistry (ICC) Protocols
- Immunohistochemistry Frozen Troubleshooting
- Immunohistochemistry Paraffin Troubleshooting
- Intracellular Flow Cytometry Protocol Using Alcohol (Methanol)
- Intracellular Flow Cytometry Protocol Using Detergents
- Intracellular Nuclear Staining Flow Cytometry Protocol Using Detergents
- Intracellular Staining Flow Cytometry Protocol Using Alcohol Permeabilization
- Intracellular Staining Flow Cytometry Protocol Using Detergents to Permeabilize Cells
- Preparing Samples for IHC/ICC Experiments
- Preventing Non-Specific Staining (Non-Specific Binding)
- Primary Antibody Selection & Optimization
- Propidium Iodide Cell Viability Flow Cytometry Protocol
- Protocol for Heat-Induced Epitope Retrieval (HIER)
- Protocol for Liperfluo
- Protocol for Making a 4% Formaldehyde Solution in PBS
- Protocol for VisUCyte™ HRP Polymer Detection Reagent
- Protocol for the Characterization of Human Th22 Cells
- Protocol for the Characterization of Human Th9 Cells
- Protocol for the Preparation & Fixation of Cells on Coverslips
- Protocol for the Preparation and Chromogenic IHC Staining of Frozen Tissue Sections
- Protocol for the Preparation and Chromogenic IHC Staining of Frozen Tissue Sections - Graphic
- Protocol for the Preparation and Chromogenic IHC Staining of Paraffin-embedded Tissue Sections
- Protocol for the Preparation and Chromogenic IHC Staining of Paraffin-embedded Tissue Sections - Graphic
- Protocol for the Preparation and Fluorescent IHC Staining of Frozen Tissue Sections
- Protocol for the Preparation and Fluorescent IHC Staining of Paraffin-embedded Tissue Sections
- Protocol for the Preparation of Gelatin-coated Slides for Histological Tissue Sections
- Protocol: Annexin V and PI Staining by Flow Cytometry
- Protocol: Annexin V and PI Staining for Apoptosis by Flow Cytometry
- R&D Systems Quality Control Western Blot Protocol
- TUNEL and Active Caspase-3 Detection by IHC/ICC Protocol
- The Importance of IHC/ICC Controls
- Troubleshooting Guide: Fluorokine Flow Cytometry Kits
- Troubleshooting Guide: Immunohistochemistry
- Troubleshooting Guide: Western Blot Figures
- Western Blot Conditions
- Western Blot Protocol
- Western Blot Protocol for Cell Lysates
- Western Blot Troubleshooting
- Western Blot Troubleshooting Guide
- View all Protocols, Troubleshooting, Illustrated assays and Webinars
Loading...