
PARP [Poly(ADP-ribose) Polymerase], also known as ADPRT and PPOL, is a 118-kDa enzyme that uses NAD as a substrate to catalyze the covalent transfer of ADP-ribose to a variety of nuclear protein acceptors. ADP ribosyltransferase is required for cellular repair, and PARP expression is induced by single-strand breaks in DNA. PARP is proteolytically cleaved by Caspase-3 into two fragments of 89- and 24-kDa in one of the hallmark events of apoptosis.
Best Seller
PAR/pADPr Antibody (10HA)
R&D Systems | Catalog # 4335-MC-100

Scientific images may be resized, cropped, or adjusted for brightness or contrast for presentation purposes. These updates are limited to presentation and do not affect the underlying scientific interpretation of the data. Where available, additional source data may be provided upon request.
Key Product Details
Species Reactivity
Validated:
Multi-Species
Cited:
Human, Mouse, Rat, Transgenic Mouse
Applications
Validated:
Immunohistochemistry, Intracellular Staining by Flow Cytometry, Immunocytochemistry
Cited:
Immunohistochemistry, Immunohistochemistry-Paraffin, Western Blot, Flow Cytometry, Immunocytochemistry, Immunoprecipitation, Chromatin Immunoprecipitation (ChIP), Co-Immunoprecipitation, ELISA Capture, Microarray, Proximity Ligation Assay, Functional Assay, Westen Blot
Label
Unconjugated
Antibody Source
Monoclonal Mouse IgG3 Clone # 10HA
Loading...
Product Specifications
Immunogen
Purified ADP-ribose polymers between 2 and 50 units long
Specificity
The antibody is specific for PAR polymers 2 to 50 units long, but does not recognize structurally related RNA, DNA, ADP-ribose monomers, NAD, or other nucleic acid monomers. Detects Poly(ADP-ribose) Polymer in Direct ELISA.
Clonality
Monoclonal
Host
Mouse
Isotype
IgG3
Scientific Data Images for PAR/pADPr Antibody (10HA)
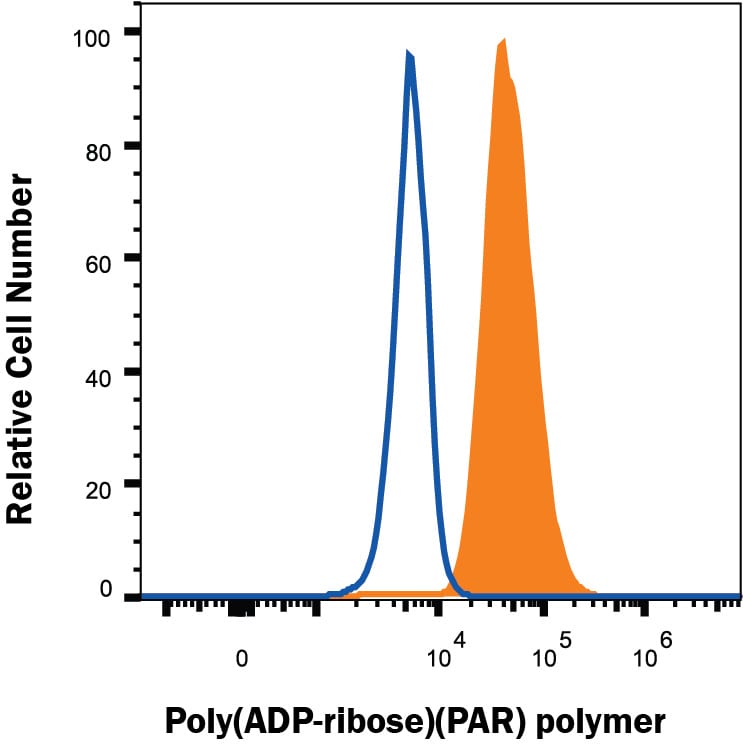
Detection of PAR in Jurkat cells by Flow Cytometry.
Jurkat human acute T cell leukemia cell line treated with 1 mM H2O2 for 5 minutes (filled histogram) or resting (open histogram) were stained with Mouse Anti-PAR Monoclonal Antibody (Catalog # 4335-MC-100) followed by Goat anti-Mouse IgG PE-conjugated Secondary Antibody (F0102B). To facilitate intracellular staining, cells were fixed and permeabilized using FlowX FoxP3/Transcription Factor Fixation & Perm Buffer Kit (FC012). Staining was performed using our Staining Intracellular Molecules protocol.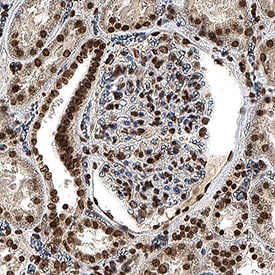
Detection of PAR/pADPr in Human Kidney.
PAR/pADPr was detected in immersion fixed paraffin-embedded sections of human kidney using Mouse Anti-PAR/pADPr Monoclonal Antibody (Catalog # 4335-MC-100) at 1.7 µg/ml for 1 hour at room temperature followed by incubation with the Anti-Mouse IgG VisUCyte™ HRP Polymer Antibody (Catalog # VC001). Before incubation with the primary antibody, tissue was subjected to heat-induced epitope retrieval using VisUCyte Antigen Retrieval Reagent-Basic (Catalog # VCTS021). Tissue was stained using DAB (brown) and counterstained with hematoxylin (blue). Specific staining was localized to the nucleus. View our protocol for IHC Staining with VisUCyte HRP Polymer Detection Reagents.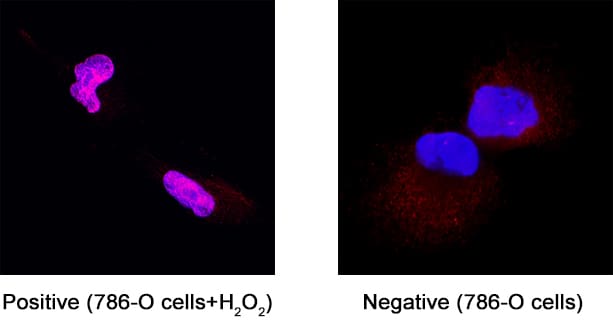
Detection of PAR/pADPr in 786‑O Human Cell Line.
PAR/pADPr was detected in immersion fixed 786‑O human renal cell adenocarcinoma cell line untreated (negative) or treated (positive) with 2mM hydrogen peroxide for 5 minutes using Mouse Anti-PAR/pADPr Monoclonal Antibody (Catalog # 4335-MC-100) at 3 µg/ml for 3 hours at room temperature. Cells were stained using the NorthernLights™ 557-conjugated Anti-Mouse IgG Secondary Antibody (red; Catalog # NL007) and counterstained with DAPI (blue). Specific staining was localized to the nucleus upon stimulation with hydrogen peroxide. View our protocol for Fluorescent ICC Staining of Cells on Coverslips.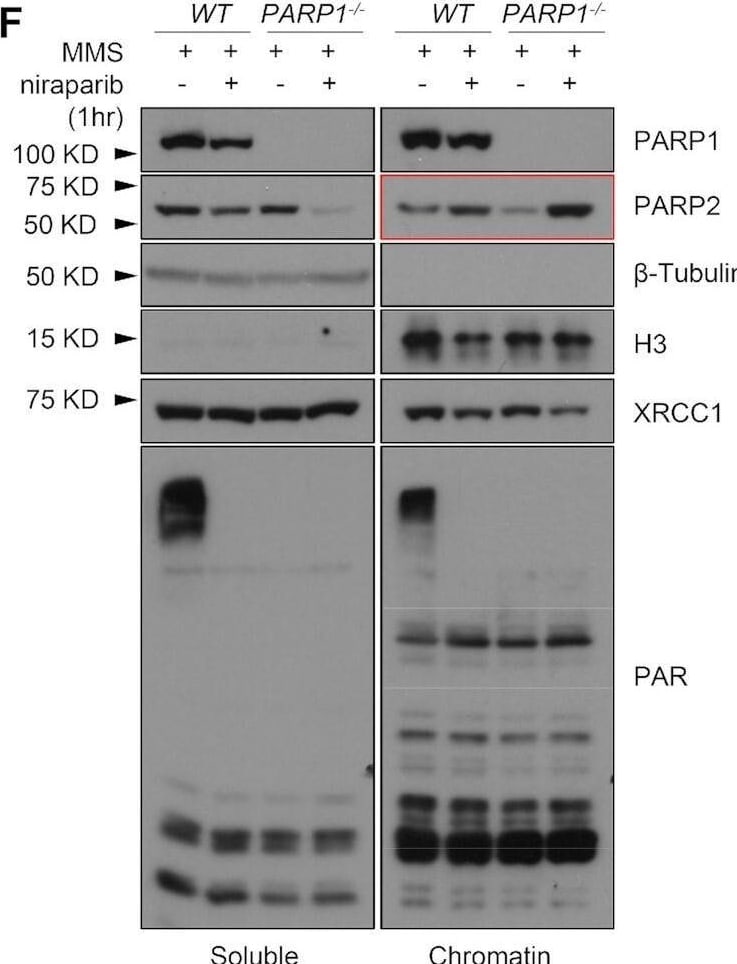
Detection of PAR/pADPr by Western Blot
PARP1 promotes PARP2 recruitment at DNA damage sites and niraparib enhances PARP2 foci independent of PARP1. (A) Representative images of laser-induced GFP-PARP2 and mRFP-XRCC1 foci in WT, Parp1 KO, Parp2 KO, and Parp1/2 DKO iMEF cells. The yellow arrowheads point to the area of micro-irradiation. (B) The relative intensity kinetics and (C) The normalized kinetics (plotted as the percentage of the maximal relative intensity at 1 min) of GFP-PARP2 at DNA damage sites in WT, Parp1 KO, Parp2 KO and Parp1/2 DKO iMEF cells. (D, E) The relative intensity of (B) GFP-PARP2 and (C) RFP-XRCC1 at 1 min post-microirradiation. Two-tailed unpaired Student's t-test were used to calculate the p-values. (F) Soluble and chromatin fraction of WT or PARP1 KO RPE-1 cells treated with MMS (0.1 mg/ml, 1 h) and niraparib (1 μM, 1 h). (G) The niraparib sensitivity of WT, PARP1 KO, PARP2 KO, and PARP1/2 DKO RPE-1 cells. The dots and error bars represent means and SEM, respectively, from one representative experiment out of three consistent biological repeats with triplicate samples (for sensitivity) and at least 8–10 cells (for live cell imaging) per experiment. P value of IC50 was calculated using the extra sum-of-square F test. ns, P > 0.05; **P < 0.01; ***P < 0.001. Image collected and cropped by CiteAb from the following open publication (https://pubmed.ncbi.nlm.nih.gov/35349716), licensed under a CC-BY license. Not internally tested by R&D Systems.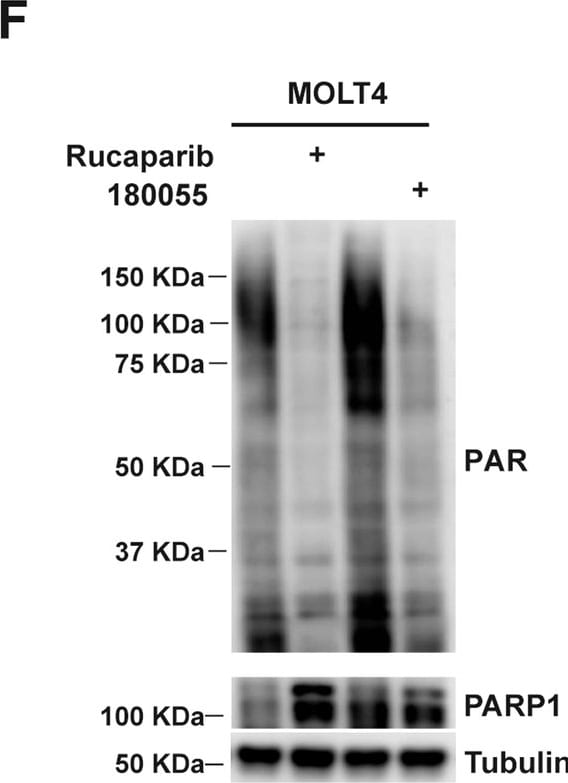
Detection of PAR/pADPr by Western Blot
180055 blocks the catalytic activity of PARP1.A–C T47D (A), MDA-MB-231 (B), and MOLT4 cells (C) were pre-treated with Rucaparib or 180055 (1 μM) for 24 h and then challenged with H2O2 (2 mM) for 1 h. NAD+ levels were then determined; values represent mean ± SEM (n = 3 biological independent samples). Statistical significance was calculated with one-way ANOVA comparing the H2O2-treated DMSO group to the Rucaparib and 180055 groups. ***p < 0.001, ****p < 0.0001. D–F immunoblot analysis of PARylation levels in T47D (D), MDA-MB-231 (E), and MOLT4 cells (F) treated with either Rucaparib or 180055. Cells were pre-treated with a PARG inhibitor (PDD 00017273, 2 μM) for 1 h and then treated with Rucaparib or 180055 (1 μM) for 1 h. Cells were then challenged with H2O2 (2 mM) for 5 min, and whole cell lysates were analyzed using immunoblot assays with the indicated antibodies. Image collected and cropped by CiteAb from the following open publication (https://www.nature.com/articles/s41419-024-07277-2), licensed under a CC-BY license. Not internally tested by R&D Systems.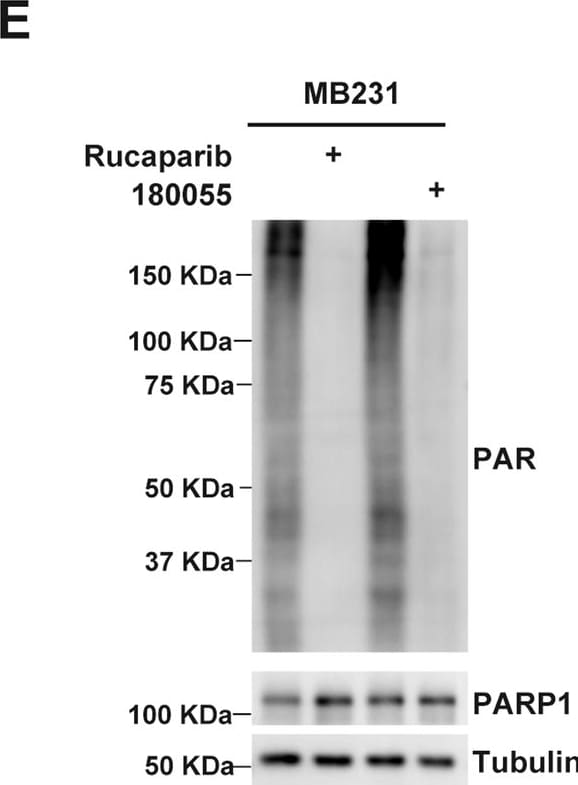
Detection of PAR/pADPr by Western Blot
180055 blocks the catalytic activity of PARP1.A–C T47D (A), MDA-MB-231 (B), and MOLT4 cells (C) were pre-treated with Rucaparib or 180055 (1 μM) for 24 h and then challenged with H2O2 (2 mM) for 1 h. NAD+ levels were then determined; values represent mean ± SEM (n = 3 biological independent samples). Statistical significance was calculated with one-way ANOVA comparing the H2O2-treated DMSO group to the Rucaparib and 180055 groups. ***p < 0.001, ****p < 0.0001. D–F immunoblot analysis of PARylation levels in T47D (D), MDA-MB-231 (E), and MOLT4 cells (F) treated with either Rucaparib or 180055. Cells were pre-treated with a PARG inhibitor (PDD 00017273, 2 μM) for 1 h and then treated with Rucaparib or 180055 (1 μM) for 1 h. Cells were then challenged with H2O2 (2 mM) for 5 min, and whole cell lysates were analyzed using immunoblot assays with the indicated antibodies. Image collected and cropped by CiteAb from the following open publication (https://www.nature.com/articles/s41419-024-07277-2), licensed under a CC-BY license. Not internally tested by R&D Systems.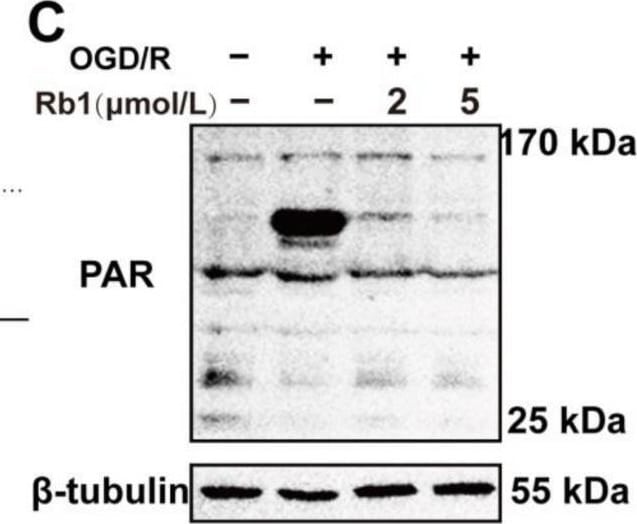
Detection of Mouse PAR/pADPr by Western Blot
Regulation of NAD+-consuming enzymes PARP1 and PAR-AIF by Ginsenoside Rb1 in OGD/R-injured ASs. (A,B) Western blot analysis and quantification of PARP1 protein levels. (C,D) Western blot analysis and quantification of PAR. The band intensity of each protein was plotted after normalizing to the beta -tubulin signal of the same lane. Data are shown with mean ± SD, n = 3. ##p < 0.01 vs. Control group, * p < 0.05, ** p < 0.01 vs. OGD/R group based on one-way ANOVA with Fisher’s LSD test. (E,F) Immunofluorescence shows PAR expression in ASs. PAR (green—FITC) and nuclei stained by DAPI are shown, as well as the merged images. The bar graphs (mean ± SD, n = 5) represent the quantitative results of fluorescence intensity in 3 different fields for each group. (G,H) Immunofluorescence shows the distribution of AIF to the nucleus. AIF (green—FITC) and nucleus stained by DAPI are shown, as well as the merged images. Co-immunofluorescence analysis revealed that the nuclear translocation of AIF in OGD/R-injured ASs was blocked by Rb1 treatment. Image collected and cropped by CiteAb from the following open publication (https://pubmed.ncbi.nlm.nih.gov/38003249), licensed under a CC-BY license. Not internally tested by R&D Systems.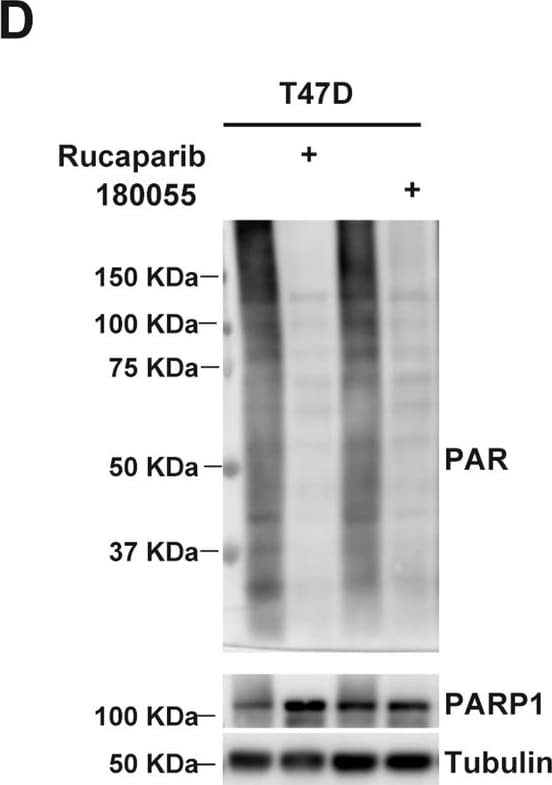
Detection of PAR/pADPr by Western Blot
180055 blocks the catalytic activity of PARP1.A–C T47D (A), MDA-MB-231 (B), and MOLT4 cells (C) were pre-treated with Rucaparib or 180055 (1 μM) for 24 h and then challenged with H2O2 (2 mM) for 1 h. NAD+ levels were then determined; values represent mean ± SEM (n = 3 biological independent samples). Statistical significance was calculated with one-way ANOVA comparing the H2O2-treated DMSO group to the Rucaparib and 180055 groups. ***p < 0.001, ****p < 0.0001. D–F immunoblot analysis of PARylation levels in T47D (D), MDA-MB-231 (E), and MOLT4 cells (F) treated with either Rucaparib or 180055. Cells were pre-treated with a PARG inhibitor (PDD 00017273, 2 μM) for 1 h and then treated with Rucaparib or 180055 (1 μM) for 1 h. Cells were then challenged with H2O2 (2 mM) for 5 min, and whole cell lysates were analyzed using immunoblot assays with the indicated antibodies. Image collected and cropped by CiteAb from the following open publication (https://www.nature.com/articles/s41419-024-07277-2), licensed under a CC-BY license. Not internally tested by R&D Systems.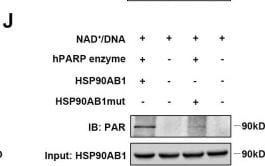
Detection of PAR/pADPr by Western Blot
PARP1 directly interacts with and poly(ADP-ribosyl)ates HSP90AB1 in cardiomyocytes. (A) Co-IP assay displayed the interaction of PARP1 and HSP90AB1 in NRCMs. (B) Co-IP assay showed the poly(ADP-ribosyl)ation of HSP90AB1 in NRCMs. (C and D) Representative images of BiFC and FRET assay showing the interaction of PARP1 and HSP90AB1. Scale bars, 10 μm (C) and 20 μm (D). (E) GST-pull down assay showed the interaction of PARP1-E domain and PARP1-E domain deletion mutant with HSP90AB1. (F) GST-pull down assay showed the interaction of HSP90AB1-delta domain (Left) and HSP90AB1-delta domain deletion mutant (Right) with PARP1. (G and H) Co-IP assay showed the poly(ADP-ribosyl)ation level of HSP90AB1 in NRCMs transinfected with Ad-Ctrl or Ad-PARP1 and in nuclear extracts from WT and PKO mice. (I) Co-IP assay showed the poly(ADP-ribosyl)ation level of HSP90AB1 in nuclear extracts from WT or PKO mice heart incubated with active DNA and NAD+, respectively. (J) Co-IP assay displayed the poly(ADP-ribosyl)ation level of HSP90AB1 in HSP90AB1 and HSP90AB1mut purified protein incubated with active DNA and NAD+. Image collected and cropped by CiteAb from the following open publication (https://pubmed.ncbi.nlm.nih.gov/38481797), licensed under a CC-BY license. Not internally tested by R&D Systems.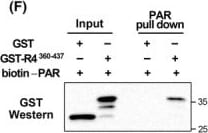
Detection of PAR/pADPr by Western Blot
The small region of RECQL4 sufficient for rapid recruitment to DSB sites directly interacts with PAR. (A) Schematic diagram of truncated RECQL4 proteins and their binding to laser‐induced DSB sites and graphs. NLS: the nuclear localization signal sequence of Simian virus 40. Data in graphs are means ± SEM; n = 15, from three independent experiments. (B) Recruitment of the region of RECQL4 (aa 360–437) to DSB sites was determined in cells treated with a PARP inhibitor (olaparib) or a PARG inhibitor (PDD000172273). The scale bar represents 10 μm. Data in graphs are means ± SEM; n = 15, from three independent experiments. (C) Co‐precipitation of RECQL4 proteins by PAR immunoprecipitation (IP) in cells treated as indicated. Anti‐PAR antibodies were used in IP, and 10% of the extract for IP was used in input lanes. Bleo, bleomycin; (−), untreated. (D) GST and GAT‐RECQL4360–437 (GST‐R4360–437) proteins were expressed in Escherichia coli cells and purified. (E) The PAR polymer (20 pmol) was incubated with the indicated amount of GST or GST‐R4360–437 protein, and GST pull‐down assays were carried out. For PAR control, the indicated amount of PAR polymer was directly immobilized onto a nylon membrane. Immunoblotting was carried out with an anti‐PAR antibody. (F) For the PAR pull‐down assay, 30 pmol of biotin‐labeled PAR polymer was incubated with 30 pmol of GST or GST‐R4360–437 protein and streptavidin beads. Western blotting was carried out with an anti‐GST antibody. In the input lanes, 25% of input materials were used. (C, E, F) These experiments were conducted more than once and the results of a single experiment are shown. Image collected and cropped by CiteAb from the following open publication (https://pubmed.ncbi.nlm.nih.gov/39462683), licensed under a CC-BY license. Not internally tested by R&D Systems.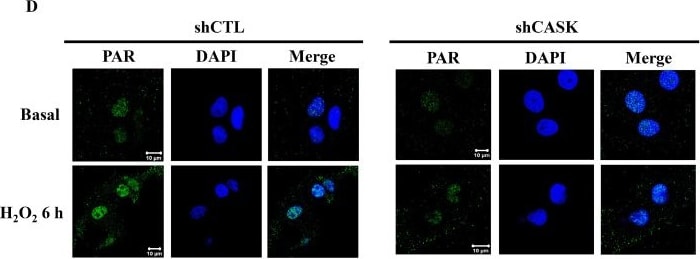
Detection of PAR/pADPr by Immunocytochemistry/ Immunofluorescence
H2O2-induced DNA damage and PARP-1 activation are attenuated by shCASK in CHME3. The cells were treated with H2O2 (500 μM) for the indicated times. (A,B) Immunoblotting of gamma H2AX (A) and PAR (B) was conducted. (C,D) Confocal microscopic examinations of PARP-1, CASK (C), and PAR (D) were taken. The data were mean ± S.E.M. from at least 3 independent experiments. *, p < 0.05 indicates a significant effect of H2O2 compared to the non-treated group. #, p < 0.05 indicates a significant effect of shCASK compared to shCTL. The scale bars are 20 μm in (C) and 10 μm in (D). Image collected and cropped by CiteAb from the following open publication (https://www.mdpi.com/2076-3921/13/3/343), licensed under a CC-BY license. Not internally tested by R&D Systems.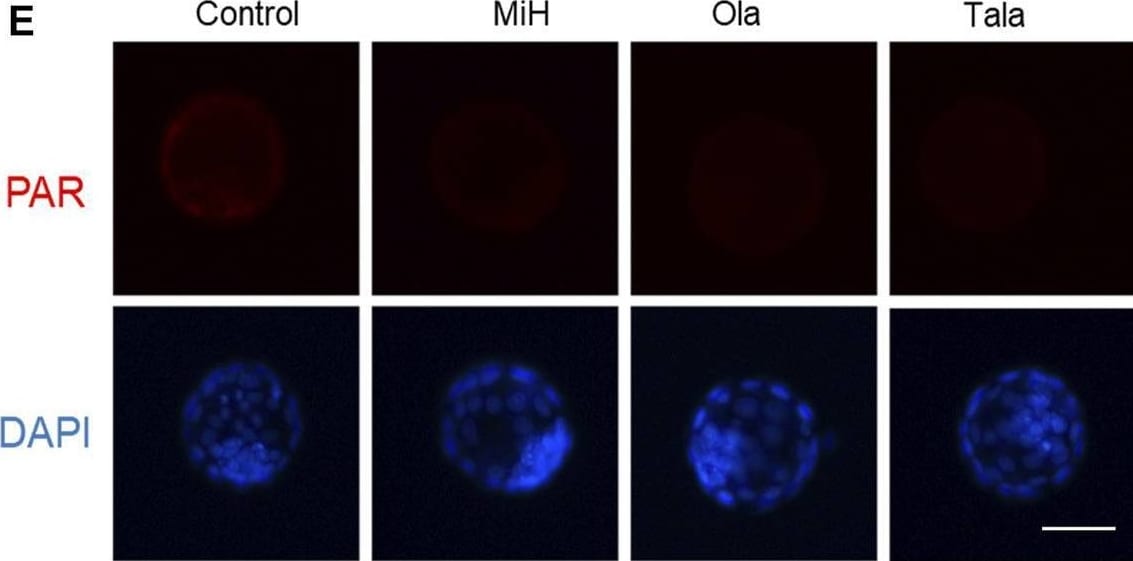
Detection of PAR/pADPr by Immunocytochemistry/ Immunofluorescence
Canonical PARP1 inhibitors showed similar effects on preimplantation embryos. (A) Brightfield images of embryos in control, MiH-, Olaparib (Ola)- and Talazoparib (Tala)-treated groups at 53, 85 and 100 h after fertilization. Bar = 100 μm. (B–D) Frequencies of embryos observed at 53 h (B) and blastocyst formation efficiencies at 85 h (C) and 100 h (D). n (Control) = 46, n (MiH) = 44, n (Ola) = 45, n (Tala) = 43. (E,F) Staining and fluorescence intensity of expanded blastocysts in the four groups for PAR. Bar = 50 μm. Data are presented as mean ± SD in three independent experiments and student’s t tests are used for statistical analysis. ∗, 0.01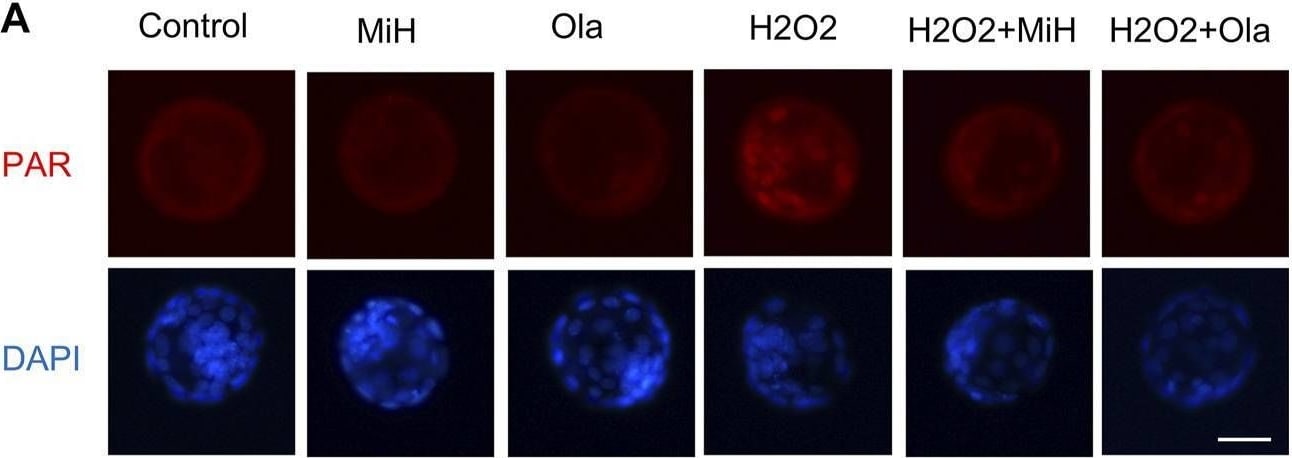
Detection of PAR/pADPr by Immunocytochemistry/ Immunofluorescence
PARP1 inhibitors could protect mouse embryos from ROS and reduced cell apoptosis. (A,B) Staining and intensity levels for PAR of expanded blastocysts in untreated and H2O2-treated groups supplemented MiH, Ola or not. (C,D) Fluorescent images and intensity levels of ROS in expanded blastocysts. (E,F) Representative fluorescent images of apoptotic cells (E) and quantitative analysis of TUNEL-positive blastocysts (F). Data are presented as mean ± SD in three independent experiments and student’s t tests are used for statistical analysis. ∗0.01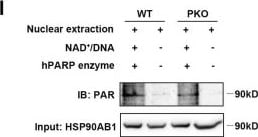
Detection of PAR/pADPr by Western Blot
PARP1 directly interacts with and poly(ADP-ribosyl)ates HSP90AB1 in cardiomyocytes. (A) Co-IP assay displayed the interaction of PARP1 and HSP90AB1 in NRCMs. (B) Co-IP assay showed the poly(ADP-ribosyl)ation of HSP90AB1 in NRCMs. (C and D) Representative images of BiFC and FRET assay showing the interaction of PARP1 and HSP90AB1. Scale bars, 10 μm (C) and 20 μm (D). (E) GST-pull down assay showed the interaction of PARP1-E domain and PARP1-E domain deletion mutant with HSP90AB1. (F) GST-pull down assay showed the interaction of HSP90AB1-delta domain (Left) and HSP90AB1-delta domain deletion mutant (Right) with PARP1. (G and H) Co-IP assay showed the poly(ADP-ribosyl)ation level of HSP90AB1 in NRCMs transinfected with Ad-Ctrl or Ad-PARP1 and in nuclear extracts from WT and PKO mice. (I) Co-IP assay showed the poly(ADP-ribosyl)ation level of HSP90AB1 in nuclear extracts from WT or PKO mice heart incubated with active DNA and NAD+, respectively. (J) Co-IP assay displayed the poly(ADP-ribosyl)ation level of HSP90AB1 in HSP90AB1 and HSP90AB1mut purified protein incubated with active DNA and NAD+. Image collected and cropped by CiteAb from the following open publication (https://pubmed.ncbi.nlm.nih.gov/38481797), licensed under a CC-BY license. Not internally tested by R&D Systems.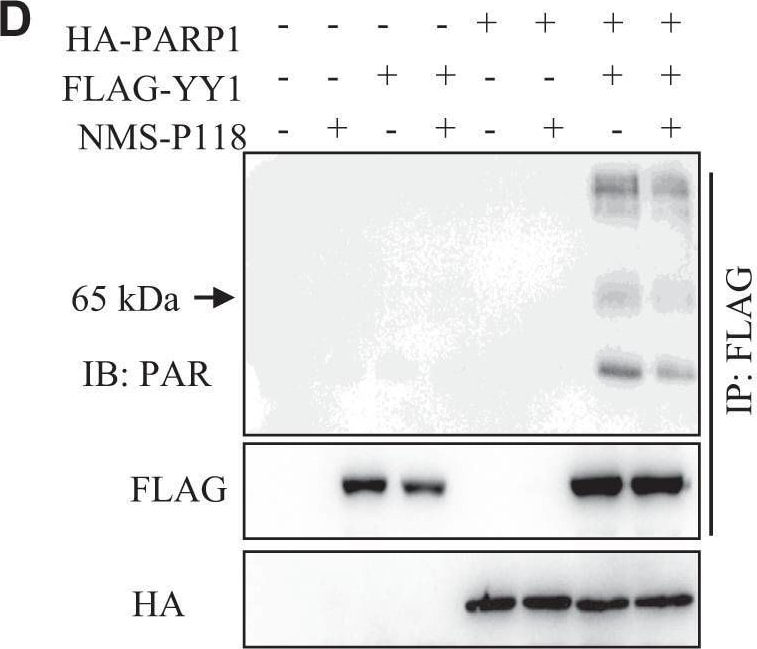
Detection of PAR/pADPr by Western Blot
PARP1-catalyzed PARylation of YY1 on Grp78 promoter regulates Grp78 transcription.Relative Yy1 mRNA (A) and protein (B) expression in 2.5 dpp mouse ovaries transfected with siParp1 for 3 days. C Western blot analysis of YY1 expression in 2.5 dpp mouse ovaries treated with NMS-P118 for 3 days in vitro. D Western blots showing the levels of YY1-PAR on immunoprecipitated YY1 (IP: FLAG) from HEK293T cells co-transfected with PARP1 and YY1, followed by NMS-P118 treatment for 36 h. E Western blots showing the levels of YY1-PAR on immunoprecipitated YY1 (IP: FLAG) from HEK293T cells co-transfected with YY1 and wild-type PARP1 or with catalytically inactive PARP1-H862A. F Western blots showing the levels of YY1-PAR on immunoprecipitated YY1 (IP: YY1) from 2.5 dpp mouse ovaries treated with NMS-P118 or transfected with siParp1 for 3 days. ChIP-PCR analysis of YY1 binding within the promoter region of Grp78 in newborn mouse ovaries at 0.5 dpp and 4.5 dpp (G), or in 2.5 dpp mouse ovaries treated with NMS-P118 for 3 days (H). IgG was used a negative control. I Western blots showing the levels of YY1-PAR on immunoprecipitated YY1 (IP: FLAG) from HEK293T cells co-transfected with PARP1 and wild-type YY1, or with Y185 mutated YY1. J ChIP-PCR analysis of YY1 binding within the promoter region of Grp78 in 2.5 dpp mouse ovaries co-transfected with PARP1 and wild-type YY1, or with Y185 mutated YY1. IgG was used as a negative control. qRT-PCR analysis of Yy1 (K) and Grp78 (L) mRNA expression levels in the 2.5 dpp mouse ovaries transfected with siYy1 and siNC for 3 days. Student’s t test: **P < 0.01, ***P < 0.001. Image collected and cropped by CiteAb from the following open publication (https://pubmed.ncbi.nlm.nih.gov/37582914), licensed under a CC-BY license. Not internally tested by R&D Systems.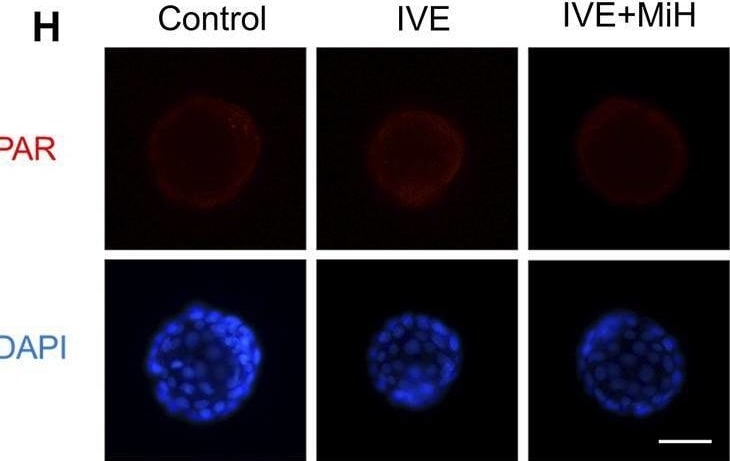
Detection of PAR/pADPr by Immunocytochemistry/ Immunofluorescence
PARP1 inhibitors could protect preimplantation mouse embryos from exposure to external environment. (A,B) Representative images and frequencies of 2-cell embryo observed at 16 h and blastocyst at 100 h after fertilization. Control, zygotes were transferred into incubators soon after washing and cultured in KSOM condition till 100 h; IVE and IVE+MiH, zygotes were exposed to external environment for 1 h and then were transferred into incubator and cultured in KSOM without (IVE) or with MiH supplemented (IVE+MiH). Bar = 100 μm. (C) Comparison of cell numbers of blastocyst at 100 h. (D) Ratios of cavitated, expanded and hatching blastocysts at 100 h. 46, 49, 47 embryos were totally counted in Control, IVE and IVE+MiH groups. (E–G) Immunofluorescent images of blastocysts and cell numbers in each blastocyst at 100 h. CDX2 (green) and OCT4 (red) were used as markers for TE and ICM separately. Bar = 50 μm. N (Control) = 12, n (IVE) = 11, n (IVE+MiH) = 18. (H) Staining images of expanded blastocysts in the three groups for PAR. Bar = 50 μm. (I) Fluorescent images of ROS for expanded blastocysts. Bar = 100 μm. (J,K) Quantification intensity levels for PAR (J) and ROS (K) in in Control, IVE and IVE+MiH groups. Data are presented as mean ± SD in three independent experiments and student’s t tests are used for statistical analysis. ∗0.01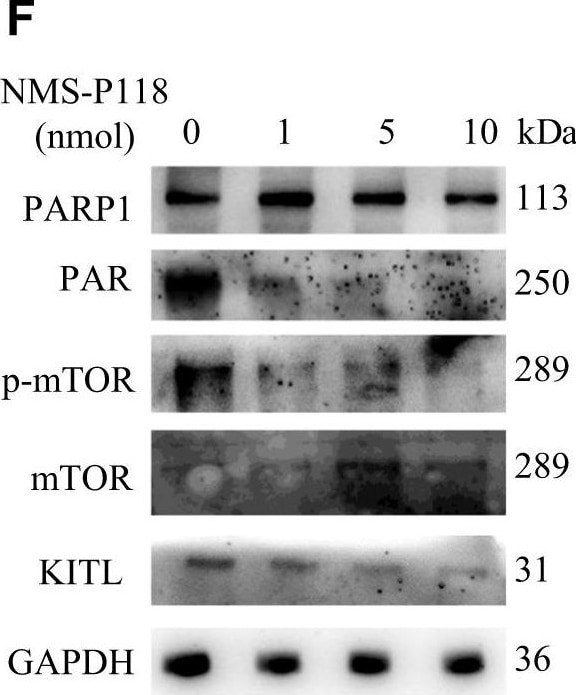
Detection of PAR/pADPr by Western Blot
PARP1 enzymatic activity in GCs determines the activation of primordial follicles.A The experimental arrangement for the in vitro follicle reconstitution system. Oocytes and ovarian somatic cells (OSCs) derived from 2.5 dpp mouse ovaries pretreated with NMS-P118 or DMOS (control) for one day were separated, respectively, and then reconstituted as indicated. Representative images (B) and proportion of growing follicle-like structures (C) in the in vitro mouse follicle reconstitution system as indicated in A. Black arrow heads: activated follicular structure surrounded by multiple layers of granulosa cells; red arrow heads: Unactivated follicular structure surrounded by a single layer of flat granulosa cells. Scale bars: 50 µm. One-way ANOVA: n.s represents no statistical significance, *P < 0.05, **P < 0.01. D Representative immunofluorescence images of 0.5 dpp mouse ovaries after 2 or 4 days of culture, staining for PARP1 (red) and FOXL2 (green). The nuclei were counter-stained by DAPI (blue). Scale bars: 50 μm. Yellow, white, and red circles represent cyst, primordial follicles (PrF), and primary follicles (PF). Arrows pointing to the GCs in the PFs with positive co-localization signals of PARP1 and FOXL2. E, F Western blot analysis of PARP1, PAR, p-mTOR, mTOR and KITL expression in 2.5 dpp mouse ovaries transfected with siParp1 (E), or treated with NMS-P118 (F) for 3 days. GAPDH was used as a loading control. GAPDH was used as a loading control. Image collected and cropped by CiteAb from the following open publication (https://pubmed.ncbi.nlm.nih.gov/37582914), licensed under a CC-BY license. Not internally tested by R&D Systems.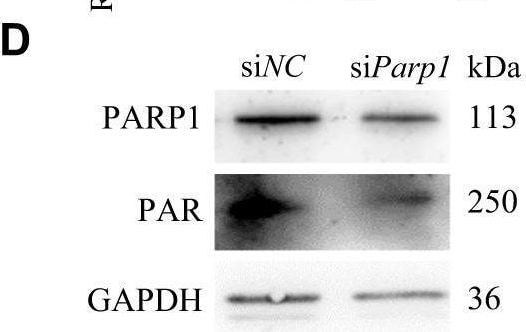
Detection of PAR/pADPr by Knockdown Validated
PARP1 enzymatic activity is indispensable for promoting primordial follicle activation in neonatal mice.A Representative immunofluorescence images of PARP1 (red) and oocyte specific marker DDX4 (green) in newborn ovaries. The nuclei were counter-stained with DAPI (blue). Scale bars: 50 μm. Yellow, red, and green circles represent primordial follicles (PrFs), primary follicles (PF), and secondary follicles (SF), separately. Yellow arrows pointing to the PARP1-positve preGCs in primordial follicles, red arrows pointing to the PARP1-positve GCs in primary follicles, and green arrows pointing to the PARP1-positve GCs in growing follicles. Scale bars: 50 μm in the zoomed-in images. Western blot analysis of PARP1 protein expression (B) and qRT-PCR analysis of Parp1 mRNA level (C) in the neonatal mouse ovaries. D Relative PARP1 and PAR protein levels in 2.5 dpp mouse ovaries transfected with siParp1 for 3 days, and siNC used as a control. E Relative Parp1 mRNA expression level in 2.5 dpp mouse ovaries transfected with siParp1 for 3 days, and siNC used as a control. Each bar represents the mean ± S.D. (n = 3). Asterisks indicate significant differences from siNC control (Student’s t test; **P < 0.01). F Western blot analysis of PARP1 and PAR expression in 2.5 dpp mouse ovaries treated with NMS-P118 for 3 days. GAPDH was used as a loading control. Representative images (G, I) and quantification of follicles (H, J) in the 2.5 dpp mouse ovaries transfected with siParp1 (G, H) or treated with NMS-P118 (I, J) for 3 days. Scale bar, 50 μm. Student’s t test: *P < 0.05. K qRT-PCR analysis of Gdf9 and Bmp15 mRNA levels in the 2.5 dpp mouse ovaries transfected with siParp1 and siNC groups. Student’s t test: **P < 0.01. ***P < 0.001. Image collected and cropped by CiteAb from the following open publication (https://pubmed.ncbi.nlm.nih.gov/37582914), licensed under a CC-BY license. Not internally tested by R&D Systems.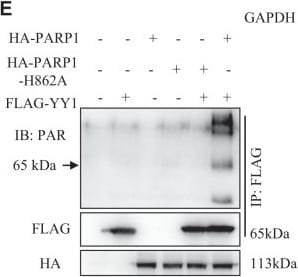
Detection of PAR/pADPr by Western Blot
PARP1-catalyzed PARylation of YY1 on Grp78 promoter regulates Grp78 transcription.Relative Yy1 mRNA (A) and protein (B) expression in 2.5 dpp mouse ovaries transfected with siParp1 for 3 days. C Western blot analysis of YY1 expression in 2.5 dpp mouse ovaries treated with NMS-P118 for 3 days in vitro. D Western blots showing the levels of YY1-PAR on immunoprecipitated YY1 (IP: FLAG) from HEK293T cells co-transfected with PARP1 and YY1, followed by NMS-P118 treatment for 36 h. E Western blots showing the levels of YY1-PAR on immunoprecipitated YY1 (IP: FLAG) from HEK293T cells co-transfected with YY1 and wild-type PARP1 or with catalytically inactive PARP1-H862A. F Western blots showing the levels of YY1-PAR on immunoprecipitated YY1 (IP: YY1) from 2.5 dpp mouse ovaries treated with NMS-P118 or transfected with siParp1 for 3 days. ChIP-PCR analysis of YY1 binding within the promoter region of Grp78 in newborn mouse ovaries at 0.5 dpp and 4.5 dpp (G), or in 2.5 dpp mouse ovaries treated with NMS-P118 for 3 days (H). IgG was used a negative control. I Western blots showing the levels of YY1-PAR on immunoprecipitated YY1 (IP: FLAG) from HEK293T cells co-transfected with PARP1 and wild-type YY1, or with Y185 mutated YY1. J ChIP-PCR analysis of YY1 binding within the promoter region of Grp78 in 2.5 dpp mouse ovaries co-transfected with PARP1 and wild-type YY1, or with Y185 mutated YY1. IgG was used as a negative control. qRT-PCR analysis of Yy1 (K) and Grp78 (L) mRNA expression levels in the 2.5 dpp mouse ovaries transfected with siYy1 and siNC for 3 days. Student’s t test: **P < 0.01, ***P < 0.001. Image collected and cropped by CiteAb from the following open publication (https://pubmed.ncbi.nlm.nih.gov/37582914), licensed under a CC-BY license. Not internally tested by R&D Systems.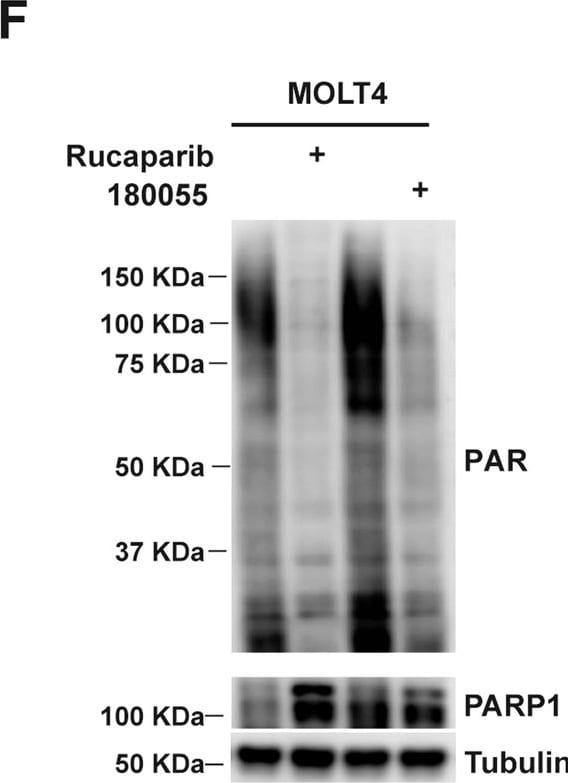
Detection of PAR/pADPr by Western Blot
180055 blocks the catalytic activity of PARP1.A–C T47D (A), MDA-MB-231 (B), and MOLT4 cells (C) were pre-treated with Rucaparib or 180055 (1 μM) for 24 h and then challenged with H2O2 (2 mM) for 1 h. NAD+ levels were then determined; values represent mean ± SEM (n = 3 biological independent samples). Statistical significance was calculated with one-way ANOVA comparing the H2O2-treated DMSO group to the Rucaparib and 180055 groups. ***p < 0.001, ****p < 0.0001. D–F immunoblot analysis of PARylation levels in T47D (D), MDA-MB-231 (E), and MOLT4 cells (F) treated with either Rucaparib or 180055. Cells were pre-treated with a PARG inhibitor (PDD 00017273, 2 μM) for 1 h and then treated with Rucaparib or 180055 (1 μM) for 1 h. Cells were then challenged with H2O2 (2 mM) for 5 min, and whole cell lysates were analyzed using immunoblot assays with the indicated antibodies. Image collected and cropped by CiteAb from the following open publication (https://pubmed.ncbi.nlm.nih.gov/39695097), licensed under a CC-BY license. Not internally tested by R&D Systems.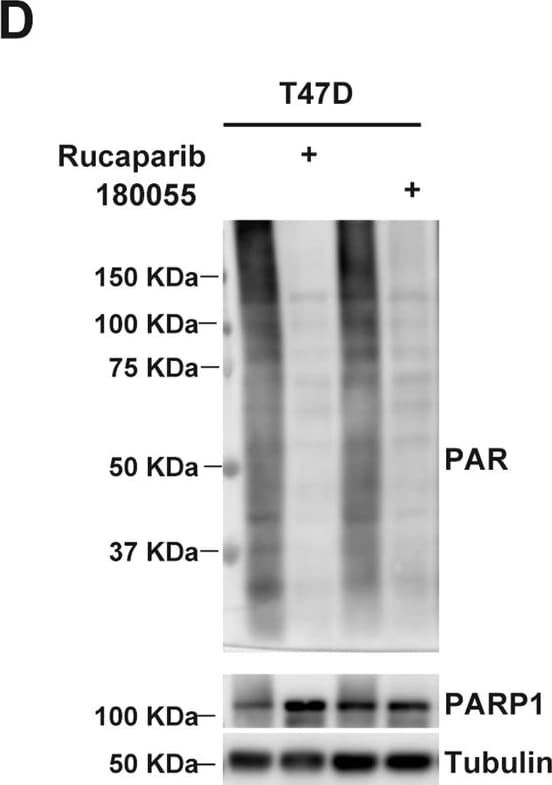
Detection of PAR/pADPr by Western Blot
180055 blocks the catalytic activity of PARP1.A–C T47D (A), MDA-MB-231 (B), and MOLT4 cells (C) were pre-treated with Rucaparib or 180055 (1 μM) for 24 h and then challenged with H2O2 (2 mM) for 1 h. NAD+ levels were then determined; values represent mean ± SEM (n = 3 biological independent samples). Statistical significance was calculated with one-way ANOVA comparing the H2O2-treated DMSO group to the Rucaparib and 180055 groups. ***p < 0.001, ****p < 0.0001. D–F immunoblot analysis of PARylation levels in T47D (D), MDA-MB-231 (E), and MOLT4 cells (F) treated with either Rucaparib or 180055. Cells were pre-treated with a PARG inhibitor (PDD 00017273, 2 μM) for 1 h and then treated with Rucaparib or 180055 (1 μM) for 1 h. Cells were then challenged with H2O2 (2 mM) for 5 min, and whole cell lysates were analyzed using immunoblot assays with the indicated antibodies. Image collected and cropped by CiteAb from the following open publication (https://pubmed.ncbi.nlm.nih.gov/39695097), licensed under a CC-BY license. Not internally tested by R&D Systems.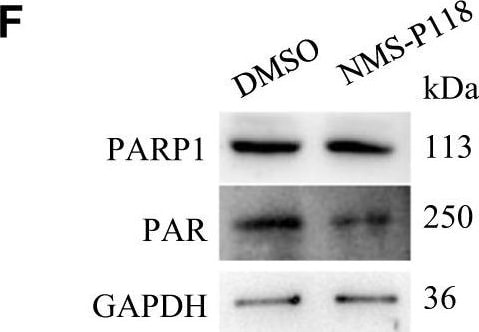
Detection of PAR/pADPr by Western Blot
PARP1 enzymatic activity is indispensable for promoting primordial follicle activation in neonatal mice.A Representative immunofluorescence images of PARP1 (red) and oocyte specific marker DDX4 (green) in newborn ovaries. The nuclei were counter-stained with DAPI (blue). Scale bars: 50 μm. Yellow, red, and green circles represent primordial follicles (PrFs), primary follicles (PF), and secondary follicles (SF), separately. Yellow arrows pointing to the PARP1-positve preGCs in primordial follicles, red arrows pointing to the PARP1-positve GCs in primary follicles, and green arrows pointing to the PARP1-positve GCs in growing follicles. Scale bars: 50 μm in the zoomed-in images. Western blot analysis of PARP1 protein expression (B) and qRT-PCR analysis of Parp1 mRNA level (C) in the neonatal mouse ovaries. D Relative PARP1 and PAR protein levels in 2.5 dpp mouse ovaries transfected with siParp1 for 3 days, and siNC used as a control. E Relative Parp1 mRNA expression level in 2.5 dpp mouse ovaries transfected with siParp1 for 3 days, and siNC used as a control. Each bar represents the mean ± S.D. (n = 3). Asterisks indicate significant differences from siNC control (Student’s t test; **P < 0.01). F Western blot analysis of PARP1 and PAR expression in 2.5 dpp mouse ovaries treated with NMS-P118 for 3 days. GAPDH was used as a loading control. Representative images (G, I) and quantification of follicles (H, J) in the 2.5 dpp mouse ovaries transfected with siParp1 (G, H) or treated with NMS-P118 (I, J) for 3 days. Scale bar, 50 μm. Student’s t test: *P < 0.05. K qRT-PCR analysis of Gdf9 and Bmp15 mRNA levels in the 2.5 dpp mouse ovaries transfected with siParp1 and siNC groups. Student’s t test: **P < 0.01. ***P < 0.001. Image collected and cropped by CiteAb from the following open publication (https://pubmed.ncbi.nlm.nih.gov/37582914), licensed under a CC-BY license. Not internally tested by R&D Systems.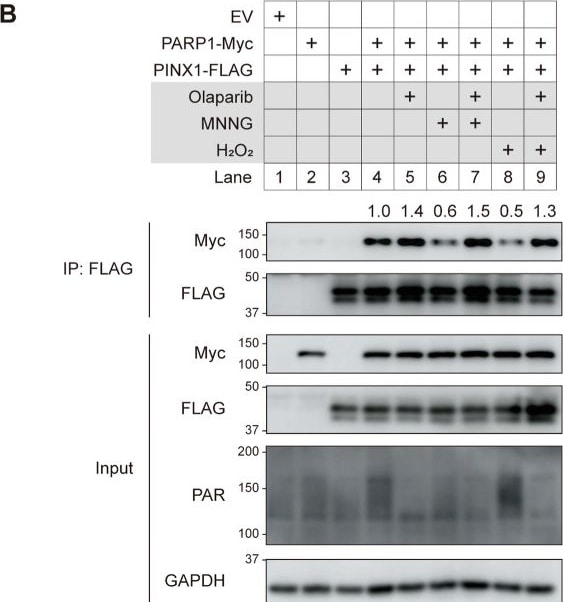
Detection of PAR/pADPr by Western Blot
PINX1 binds to the ZnF3-BRCT domain of PARP1.A The schematic diagram of PARP1 motifs and mutants used for domain mapping and the summary of their binding ability with PINX1. Numbers indicate the respective amino acid positions. B Effect of PARP activation or inhibition on the association between PARP1 and PINX1. PINX1–FLAG was co-transfected with PARP1-Myc into HEK293T cells. Cells were pre-treated with DMSO or 1 µM Olaparib for 40 min before treatment with 50 µM MNNG for 15 min or 2 mM H2O2 for 5 min. IP of whole cell lysates with anti-FLAG agarose beads was performed. Image collected and cropped by CiteAb from the following open publication (https://www.nature.com/articles/s41419-024-07009-6), licensed under a CC-BY license. Not internally tested by R&D Systems.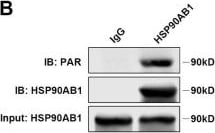
Detection of PAR/pADPr by Western Blot
PARP1 directly interacts with and poly(ADP-ribosyl)ates HSP90AB1 in cardiomyocytes. (A) Co-IP assay displayed the interaction of PARP1 and HSP90AB1 in NRCMs. (B) Co-IP assay showed the poly(ADP-ribosyl)ation of HSP90AB1 in NRCMs. (C and D) Representative images of BiFC and FRET assay showing the interaction of PARP1 and HSP90AB1. Scale bars, 10 μm (C) and 20 μm (D). (E) GST-pull down assay showed the interaction of PARP1-E domain and PARP1-E domain deletion mutant with HSP90AB1. (F) GST-pull down assay showed the interaction of HSP90AB1-delta domain (Left) and HSP90AB1-delta domain deletion mutant (Right) with PARP1. (G and H) Co-IP assay showed the poly(ADP-ribosyl)ation level of HSP90AB1 in NRCMs transinfected with Ad-Ctrl or Ad-PARP1 and in nuclear extracts from WT and PKO mice. (I) Co-IP assay showed the poly(ADP-ribosyl)ation level of HSP90AB1 in nuclear extracts from WT or PKO mice heart incubated with active DNA and NAD+, respectively. (J) Co-IP assay displayed the poly(ADP-ribosyl)ation level of HSP90AB1 in HSP90AB1 and HSP90AB1mut purified protein incubated with active DNA and NAD+. Image collected and cropped by CiteAb from the following open publication (https://pubmed.ncbi.nlm.nih.gov/38481797), licensed under a CC-BY license. Not internally tested by R&D Systems.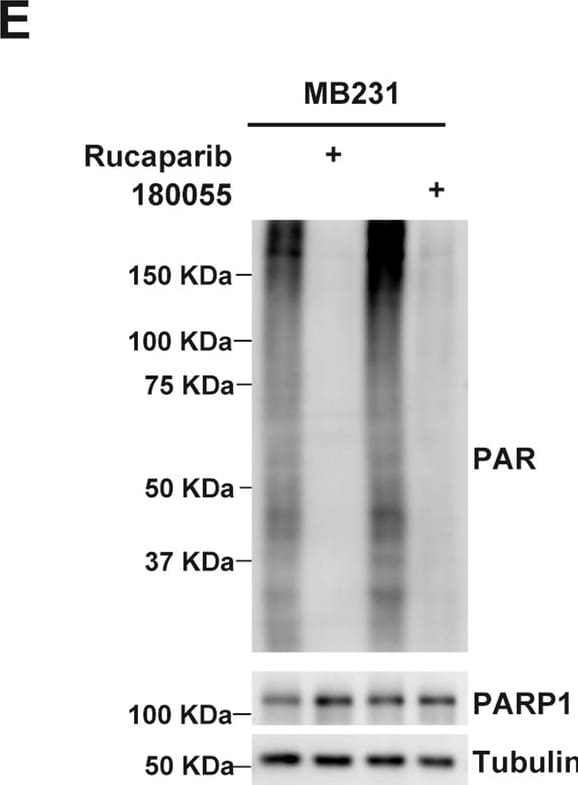
Detection of PAR/pADPr by Western Blot
180055 blocks the catalytic activity of PARP1.A–C T47D (A), MDA-MB-231 (B), and MOLT4 cells (C) were pre-treated with Rucaparib or 180055 (1 μM) for 24 h and then challenged with H2O2 (2 mM) for 1 h. NAD+ levels were then determined; values represent mean ± SEM (n = 3 biological independent samples). Statistical significance was calculated with one-way ANOVA comparing the H2O2-treated DMSO group to the Rucaparib and 180055 groups. ***p < 0.001, ****p < 0.0001. D–F immunoblot analysis of PARylation levels in T47D (D), MDA-MB-231 (E), and MOLT4 cells (F) treated with either Rucaparib or 180055. Cells were pre-treated with a PARG inhibitor (PDD 00017273, 2 μM) for 1 h and then treated with Rucaparib or 180055 (1 μM) for 1 h. Cells were then challenged with H2O2 (2 mM) for 5 min, and whole cell lysates were analyzed using immunoblot assays with the indicated antibodies. Image collected and cropped by CiteAb from the following open publication (https://pubmed.ncbi.nlm.nih.gov/39695097), licensed under a CC-BY license. Not internally tested by R&D Systems.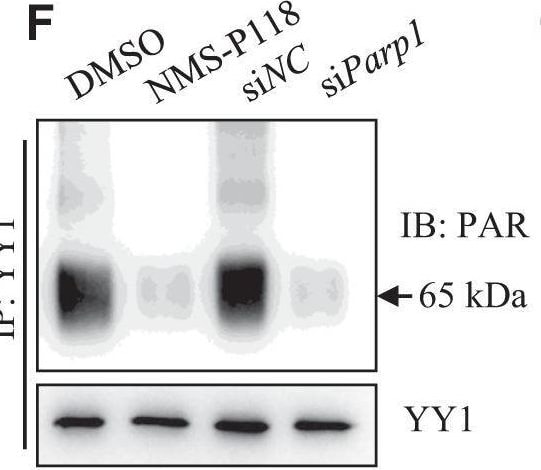
Detection of PAR/pADPr by Western Blot
PARP1-catalyzed PARylation of YY1 on Grp78 promoter regulates Grp78 transcription.Relative Yy1 mRNA (A) and protein (B) expression in 2.5 dpp mouse ovaries transfected with siParp1 for 3 days. C Western blot analysis of YY1 expression in 2.5 dpp mouse ovaries treated with NMS-P118 for 3 days in vitro. D Western blots showing the levels of YY1-PAR on immunoprecipitated YY1 (IP: FLAG) from HEK293T cells co-transfected with PARP1 and YY1, followed by NMS-P118 treatment for 36 h. E Western blots showing the levels of YY1-PAR on immunoprecipitated YY1 (IP: FLAG) from HEK293T cells co-transfected with YY1 and wild-type PARP1 or with catalytically inactive PARP1-H862A. F Western blots showing the levels of YY1-PAR on immunoprecipitated YY1 (IP: YY1) from 2.5 dpp mouse ovaries treated with NMS-P118 or transfected with siParp1 for 3 days. ChIP-PCR analysis of YY1 binding within the promoter region of Grp78 in newborn mouse ovaries at 0.5 dpp and 4.5 dpp (G), or in 2.5 dpp mouse ovaries treated with NMS-P118 for 3 days (H). IgG was used a negative control. I Western blots showing the levels of YY1-PAR on immunoprecipitated YY1 (IP: FLAG) from HEK293T cells co-transfected with PARP1 and wild-type YY1, or with Y185 mutated YY1. J ChIP-PCR analysis of YY1 binding within the promoter region of Grp78 in 2.5 dpp mouse ovaries co-transfected with PARP1 and wild-type YY1, or with Y185 mutated YY1. IgG was used as a negative control. qRT-PCR analysis of Yy1 (K) and Grp78 (L) mRNA expression levels in the 2.5 dpp mouse ovaries transfected with siYy1 and siNC for 3 days. Student’s t test: **P < 0.01, ***P < 0.001. Image collected and cropped by CiteAb from the following open publication (https://pubmed.ncbi.nlm.nih.gov/37582914), licensed under a CC-BY license. Not internally tested by R&D Systems.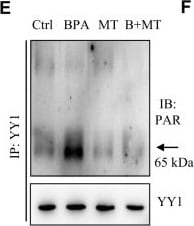
Detection of PAR/pADPr by Western Blot
Melatonin protects the fetal mouse ovaries from gestational BPA exposure and reduces hyperactivation of primordial follicles in the offspring mice.A Schematic diagram showing the experimental arrangement. MT, Melatonin; NP, NMS-P118. Representative immunofluorescence images of PARP1 (green) and DDX4 (red) (B), and quantification of follicles (C) in the 4.5 dpp mouse ovaries of newborn offspring under fetal exposure to PBS (Control), BPA, NMS-P118 (NP), or BPA + NP. The nuclei were counterstained with DAPI (blue). Scale bars: 50 μm. Data in C was expressed as mean ± S.D. (n = 4). One-way ANOVA: **P < 0.01. D Western blots showing the levels of PARP1, GRP78, p-IRE1 alpha, IRE1 alpha, p-PERK, PERK and ATF4 in the 4.5 dpp mouse ovaries of offspring as detailed in B. E Western blots showing the levels of YY1-PAR on immunoprecipitated YY1 (IP: YY1) from the 4.5 dpp mouse ovaries of offspring under fetal exposure to PBS (Control), BPA, Melatonin (MT), or BPA + MT. F Western blots showing the levels of PARP1, GRP78, p-IRE1 alpha, IRE1 alpha, p-PERK, PERK and ATF4 in the 4.5 dpp mouse ovaries of offspring as described in E. Representative immunofluorescence images of PARP1 (green) and DDX4 (red) (G), and quantification of follicles (H) in the 4.5 dpp mouse ovaries of offspring as described in E. The nuclei were counter-stained with DAPI (blue). Scale bars: 50 μm. Data in H was expressed as mean ± S.D. (n = 4). One-way ANOVA: **P < 0.01. I Working model showing the proposed role of PARP1 in the selective activation of primordial follicle. See details in Discussion. Image collected and cropped by CiteAb from the following open publication (https://pubmed.ncbi.nlm.nih.gov/37582914), licensed under a CC-BY license. Not internally tested by R&D Systems.Applications for PAR/pADPr Antibody (10HA)
Application
Recommended Usage
Immunocytochemistry
3-25 µg/mL
Sample: Immersion fixed 786-O human renal cell adenocarcinoma cell line
Sample: Immersion fixed 786-O human renal cell adenocarcinoma cell line
Immunohistochemistry
1-15 µg/mL
Sample: Immersion fixed paraffin-embedded sections of human kidney
Sample: Immersion fixed paraffin-embedded sections of human kidney
Intracellular Staining by Flow Cytometry
0.25 µg/106 cells
Sample: Jurkat human acute T cell leukemia cell line treated with 1 mM H2O2 for 5 minutes
Sample: Jurkat human acute T cell leukemia cell line treated with 1 mM H2O2 for 5 minutes
Reviewed Applications
Read 3 reviews rated 4 using 4335-MC-100 in the following applications:
Flow Cytometry Panel Builder
Bio-Techne Knows Flow Cytometry
Save time and reduce costly mistakes by quickly finding compatible reagents using the Panel Builder Tool.
Advanced Features
- Spectra Viewer - Custom analysis of spectra from multiple fluorochromes
- Spillover Popups - Visualize the spectra of individual fluorochromes
- Antigen Density Selector - Match fluorochrome brightness with antigen density

Formulation, Preparation, and Storage
Purification
Protein A or G purified from ascites
Formulation
Supplied as a 0.2 μm filtered solution in TBS. See Certificate of Analysis for details.
Shipping
The product is shipped with dry ice or equivalent. Upon receipt, store it immediately at the temperature recommended below.
Stability & Storage
Use a manual defrost freezer and avoid repeated freeze-thaw cycles.
- 12 months from date of receipt, -20 to -70 °C, as supplied.
- 1 month, 2 to 8 °C under sterile conditions after opening.
- 6 months, -20 to -70 °C under sterile conditions after opening.
Background: PAR/pADPr
Long Name
Poly [ADP-ribose] Polymer
Alternate Names
PAR
Additional PAR/pADPr Products
Product Documents for PAR/pADPr Antibody (10HA)
Certificate of Analysis
To download a Certificate of Analysis, please enter a lot or batch number in the search box below.
Note: Certificate of Analysis not available for kit components.
Product Specific Notices for PAR/pADPr Antibody (10HA)
For research use only
Related Research Areas
Citations for PAR/pADPr Antibody (10HA)
 Powered by Bioz
Customer Reviews for PAR/pADPr Antibody (10HA) (3)
4 out of 5
3 Customer Ratings
Have you used PAR/pADPr Antibody (10HA)?
Submit a review and receive an Amazon gift card!
$25/€18/£15/$25CAN/¥2500 for a review with an image
$10/€7/£6/$10CAN/¥1110 for a review without an image
Submit a review
Customer Images

Showing
1
-
3 of
3 reviews
Showing All
Filter By:
-
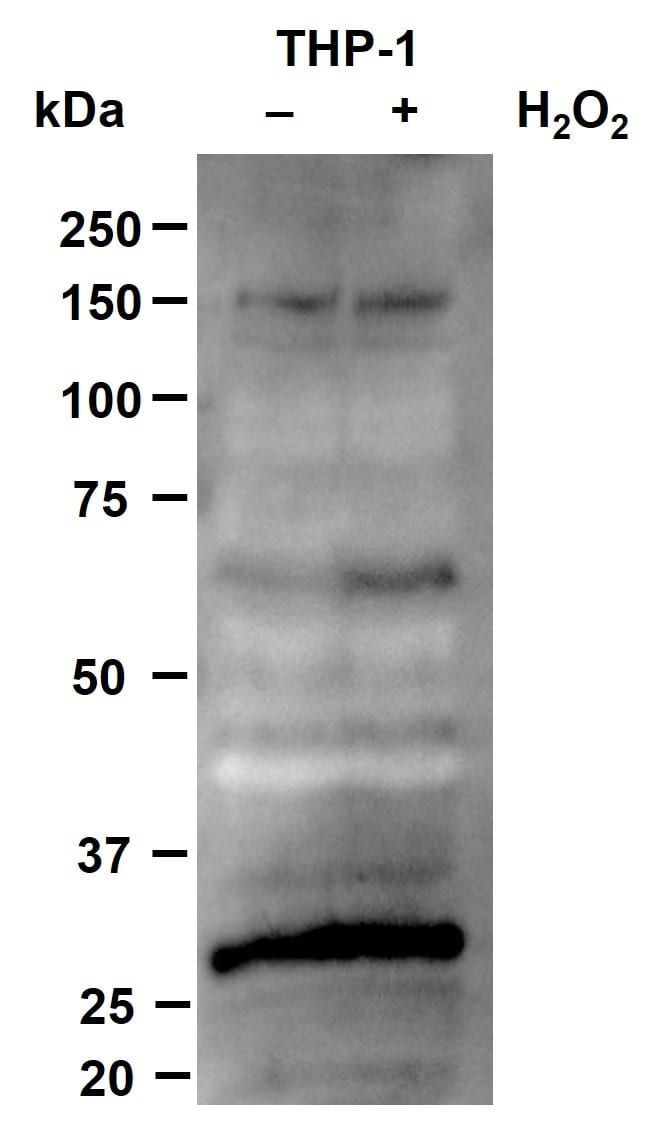
Application: Western BlotSample Tested: THP-1 human acute monocytic leukemia cell lineSpecies: HumanVerified Customer | Posted 03/15/2024SDS-PAGE 10% gel of THP-1 monocytes with/without 5 mins 2mM H2O2 treatment. 30ug of protein run. Anti-PAR/pADPr used at 1:2,000 diln in 5% BSA in TBS-T for 1h.

-
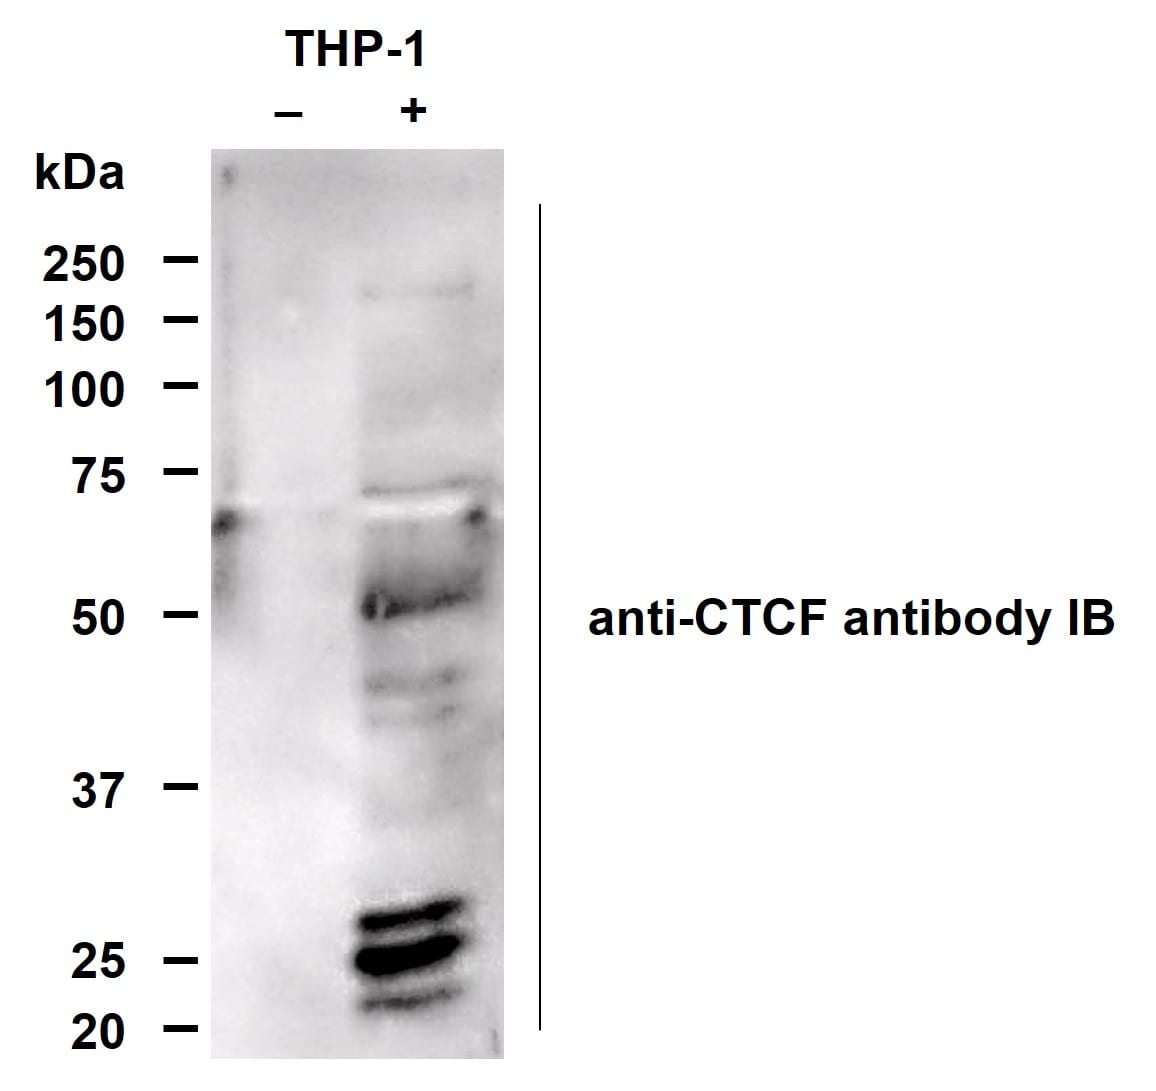
Application: ImmunoprecipitationSample Tested: THP-1 human acute monocytic leukemia cell lineSpecies: HumanVerified Customer | Posted 03/08/2024Antibody was used to perform immunoprecipitation (2ug) of THP-1 lysates before SDS-PAFE of samples and immunoblot was performed with anti-CTCF (1:5k diln). Parylated-CTCF found at 180kDa in righthand lane.
-
Application: Western BlotSample Tested: Breast cancer cellsSpecies: HumanVerified Customer | Posted 02/02/20218% polyacrylamide gel run until 55 kDa band. 1:750 primary antibody dilution; 1:10000 secondary antibody dilution. UT=untreated cells.
There are no reviews that match your criteria.
Protocols
Find general support by application which include: protocols, troubleshooting, illustrated assays, videos and webinars.
- 7-Amino Actinomycin D (7-AAD) Cell Viability Flow Cytometry Protocol
- Antigen Retrieval Protocol (PIER)
- Antigen Retrieval for Frozen Sections Protocol
- Appropriate Fixation of IHC/ICC Samples
- Cellular Response to Hypoxia Protocols
- Chromogenic IHC Staining of Formalin-Fixed Paraffin-Embedded (FFPE) Tissue Protocol
- Chromogenic Immunohistochemistry Staining of Frozen Tissue
- ClariTSA™ Fluorophore Kits
- Detection & Visualization of Antibody Binding
- Extracellular Membrane Flow Cytometry Protocol
- Flow Cytometry Protocol for Cell Surface Markers
- Flow Cytometry Protocol for Staining Membrane Associated Proteins
- Flow Cytometry Staining Protocols
- Flow Cytometry Troubleshooting Guide
- Fluorescent IHC Staining of Frozen Tissue Protocol
- Graphic Protocol for Heat-induced Epitope Retrieval
- Graphic Protocol for the Preparation and Fluorescent IHC Staining of Frozen Tissue Sections
- Graphic Protocol for the Preparation and Fluorescent IHC Staining of Paraffin-embedded Tissue Sections
- Graphic Protocol for the Preparation of Gelatin-coated Slides for Histological Tissue Sections
- ICC Cell Smear Protocol for Suspension Cells
- ICC Immunocytochemistry Protocol Videos
- ICC for Adherent Cells
- IHC Sample Preparation (Frozen sections vs Paraffin)
- Immunocytochemistry (ICC) Protocol
- Immunocytochemistry Troubleshooting
- Immunofluorescence of Organoids Embedded in Cultrex Basement Membrane Extract
- Immunofluorescent IHC Staining of Formalin-Fixed Paraffin-Embedded (FFPE) Tissue Protocol
- Immunohistochemistry (IHC) and Immunocytochemistry (ICC) Protocols
- Immunohistochemistry Frozen Troubleshooting
- Immunohistochemistry Paraffin Troubleshooting
- Intracellular Flow Cytometry Protocol Using Alcohol (Methanol)
- Intracellular Flow Cytometry Protocol Using Detergents
- Intracellular Nuclear Staining Flow Cytometry Protocol Using Detergents
- Intracellular Staining Flow Cytometry Protocol Using Alcohol Permeabilization
- Intracellular Staining Flow Cytometry Protocol Using Detergents to Permeabilize Cells
- Preparing Samples for IHC/ICC Experiments
- Preventing Non-Specific Staining (Non-Specific Binding)
- Primary Antibody Selection & Optimization
- Propidium Iodide Cell Viability Flow Cytometry Protocol
- Protocol for Heat-Induced Epitope Retrieval (HIER)
- Protocol for Liperfluo
- Protocol for Making a 4% Formaldehyde Solution in PBS
- Protocol for VisUCyte™ HRP Polymer Detection Reagent
- Protocol for the Characterization of Human Th22 Cells
- Protocol for the Characterization of Human Th9 Cells
- Protocol for the Fluorescent ICC Staining of Cell Smears - Graphic
- Protocol for the Fluorescent ICC Staining of Cultured Cells on Coverslips - Graphic
- Protocol for the Preparation & Fixation of Cells on Coverslips
- Protocol for the Preparation and Chromogenic IHC Staining of Frozen Tissue Sections
- Protocol for the Preparation and Chromogenic IHC Staining of Frozen Tissue Sections - Graphic
- Protocol for the Preparation and Chromogenic IHC Staining of Paraffin-embedded Tissue Sections
- Protocol for the Preparation and Chromogenic IHC Staining of Paraffin-embedded Tissue Sections - Graphic
- Protocol for the Preparation and Fluorescent ICC Staining of Cells on Coverslips
- Protocol for the Preparation and Fluorescent ICC Staining of Non-adherent Cells
- Protocol for the Preparation and Fluorescent ICC Staining of Stem Cells on Coverslips
- Protocol for the Preparation and Fluorescent IHC Staining of Frozen Tissue Sections
- Protocol for the Preparation and Fluorescent IHC Staining of Paraffin-embedded Tissue Sections
- Protocol for the Preparation of Gelatin-coated Slides for Histological Tissue Sections
- Protocol for the Preparation of a Cell Smear for Non-adherent Cell ICC - Graphic
- Protocol: Annexin V and PI Staining by Flow Cytometry
- Protocol: Annexin V and PI Staining for Apoptosis by Flow Cytometry
- TUNEL and Active Caspase-3 Detection by IHC/ICC Protocol
- The Importance of IHC/ICC Controls
- Troubleshooting Guide: Fluorokine Flow Cytometry Kits
- Troubleshooting Guide: Immunohistochemistry
- View all Protocols, Troubleshooting, Illustrated assays and Webinars
FAQs for PAR/pADPr Antibody (10HA)
Showing
1
-
1 of
1 FAQ
Showing All
-
Q: What is the concentration of PAR/pADPr Antibody (Catalog # 4335-MC-100)
A: The PAR/pADPr Antibody (Catalog # 4335-MC-100) is supplied as a solution in TBS containing glycerol, at a concentration of 100 µg/100 µL.
Loading...