beta-Actin Antibody (937215)
R&D Systems | Catalog # MAB8929

Key Product Details
Validated by
Biological Validation
Species Reactivity
Validated:
Human, Mouse, Rat
Cited:
Human, Mouse, Rat, Hamster - Mesocricetus auratus (Golden Hamster), Primate - Cercopithecus aethiops (African Green Monkey), Transgenic Mouse
Applications
Validated:
Western Blot, Immunocytochemistry, Simple Western
Cited:
Immunohistochemistry, Western Blot, Immunocytochemistry, Simple Western, Immunoprecipitation, Bioassay, Westen Blot, Western Blot Control
Label
Unconjugated
Antibody Source
Monoclonal Mouse IgG1 Clone # 937215
Loading...
Product Specifications
Immunogen
Peptide containing a sequence at the N-terminus of human beta ‑Actin
Accession # P60709
Accession # P60709
Specificity
Detects human, mouse, and rat beta ‑Actin in Western blots.
Clonality
Monoclonal
Host
Mouse
Isotype
IgG1
Scientific Data Images for beta-Actin Antibody (937215)
Detection of Human, Mouse, and Rat beta ‑Actin by Western Blot.
Western blot shows lysates of A431 human epithelial carcinoma cell line, C2C12 mouse myoblast cell line, and Rat-2 rat embryonic fibroblast cell line. PVDF membrane was probed with 0.01 µg/mL of Mouse Anti-Human/Mouse/Rat beta -Actin Monoclonal Antibody (Catalog # MAB8929) followed by HRP-conjugated Anti-Mouse IgG Secondary Antibody (Catalog # HAF018). A specific band was detected for beta -Actin at approximately 45 kDa (as indicated). This experiment was conducted under reducing conditions and using Immunoblot Buffer Group 1.
beta ‑Actin in NIH‑3T3 Mouse Cell Line.
beta -Actin was detected in immersion fixed NIH-3T3 mouse embryonic fibroblast cell line using Mouse Anti-Human/Mouse/Rat beta -Actin Monoclonal Antibody (Catalog # MAB8929) at 0.1 µg/mL for 3 hours at room temperature. Cells were stained using the NorthernLights™ 557-conjugated Anti-Mouse IgG Secondary Antibody (red; Catalog # NL007) and counterstained with DAPI (blue). Cells were fixated in methanol. Specific staining was localized to cytoskeleton.
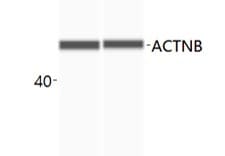
Detection of Human beta ‑Actin by Simple WesternTM.
Simple Western lane view shows lysate of A431 human epithelial carcinoma cell line, loaded at 0.2 mg/mL. A specific band was detected for beta ‑Actin at approximately 49 kDa (as indicated) using 1 µg/mL of Mouse Anti-Human/Mouse/Rat beta ‑Actin Monoclonal Antibody (Catalog # MAB8929). This experiment was conducted under reducing conditions and using the 12-230 kDa separation system.
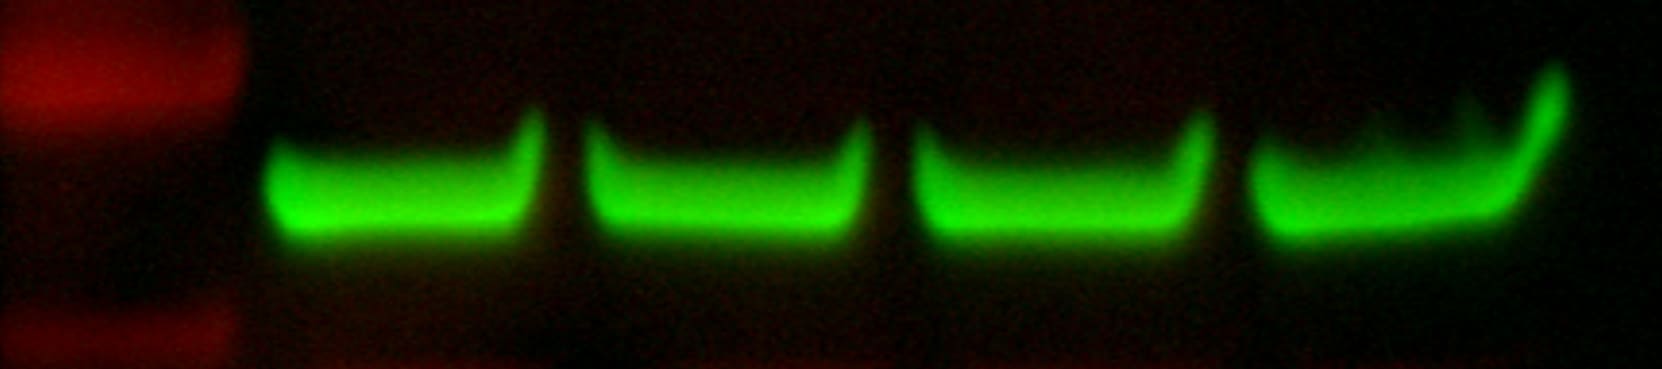
Detection of Human, Mouse, and Rat beta ‑Actin by Simple WesternTM.
Simple Western lane view shows lysates of Jurkat human acute T cell leukemia cell line, HeLa human cervical epithelial carcinoma cell line, C2C12 mouse myoblast cell line, and C6 rat glioma cell line, loaded at 0.2 mg/mL. A specific band was detected for beta ‑Actin at approximately 48 kDa (as indicated) using 1 µg/mL of Mouse Anti-Human/Mouse/Rat beta ‑Actin Monoclonal Antibody (Catalog # MAB8929). This experiment was conducted under reducing conditions and using the 12-230 kDa separation system.
Detection of Human beta-Actin by Western Blot
The treatment of n-BP rescued the progression of QA-induced excitotoxicity in SCA3 PPs. The control and/or SCA3 PPs were treated with or without QA (1 μM) in the presence of n-BP (0, 10, 20, and 40 μg/mL) for 12 h. (A) Images of QA-treated SCA3 PPs in the presence of BP (40 μg/mL). (B) Confocal images of poly Q localization in BP (40 μg/mL)-treated SCA3 PPs in the presence of QA (1 um). When compared with Figure 2C, 40 μg/mL of n-BP prevented the amounts of colocalized polyQ in the cell nucleus of PPs. The distribution of polyQ in the nucleus is indicated by white arrowheads. Scale bar = 100 μm; (C) protein analysis of wild-type, mutant ATXN3 and its proteolytic fragment in cell lysates of control and SCA3 PPs, as assessed by immunoblots. Soluble, soluble protein; Insoluble, insoluble protein; (D,E) representative immunoblot of control and cleaved PARP1 in cell lysates of control and SCA3 PPs, as assessed by immunoblots. The HDAC2 were used as loading controls. The quantification from three independent images is presented as the means ± standard deviation. t(4) = 2.824, p < 0.05, for lane 1 vs. lane 2; t(4) = 5.613, p < 0.01, for lane 1 vs. lane 3; t(4) = 3.522, p < 0.05, for lane 1 vs. lane 4; (F) the quantification result of calcium concentration in SCA3 PPs, as assessed by Fura-2 indicator. Cells were treated with QA (1 μM) in the presence of n-BP (0, 10, 20, and 40 μg/mL). Data are presented as the means ± standard deviation. t(4) = 2.95, p < 0.05; (G) the calpain activity in control and SCA3 PPs cell lysates, as assessed by ELISA assay. The quantification results from three independent replicates are presented as the means ± standard deviation. t(4) = 3.27, p < 0.05, for lane 3 vs. lane 4; t(4) = 17.55, p < 0.01, for lane 3 vs. lane 5; t(4) = 9.019, p < 0.01, for lane 3 vs. lane 6. (H) Protein analysis of calpain 1, calpain 2 and calpastatin in cell lysates of SCA3 PPs, as assessed by immunoblots. Cells were treated with or without QA (1 μM) in the presence of
Detection of Human beta-Actin by Simple Western
Identification of menin-associated proteins (MAPs) in breast cancer cells. (A) and (B) WES of BirA-Menin fusion proteins (A) and biotin-labeled proteins (B) in total lysates of BirA-MEN1 BioID engineered T47D or MCF-7 cells after incubating with or without doxycycline and biotin. (C) Schematic purification and proteomic identification of MAPs using LC–MS/MS. (D) Heatmap of the quantification of 35 MAPs commonly shared in T47D and MCF-7 cells. MAPs further verified by WES immunoassays were indicated by arrows. (E) Network analysis of 35 MAPs in MCF-7 cells. The distance between menin and MAPs represented the quantitative ratio of each MAP and menin. MAPs marked in blue were further assayed by WES. (F) Nuclear or cytoplasmic lysates of BirA-MEN1 BioID engineered T47D or MCF-7 cells after streptavidin beads pull-down were detected by WES with antibodies against menin, KMT2A, MED12, WAPL, GATA3, LaminA/C, or GAPDH. FL, full length; SP, spliced form. Image collected and cropped by CiteAb from the following publication (https://pubmed.ncbi.nlm.nih.gov/32971831), licensed under a CC-BY license. Not internally tested by R&D Systems.
Detection of Human beta-Actin by Simple Western
Identification of MEN1-modulated genes in breast cancer cells. (A) RT-qPCR of MEN1 in T47D or MCF-7 cells treated with vehicle or MEN1 shRNA lentivirus (n = 3). (B) Quantitative Western immunoassays (WES) of menin expression in T47D or MCF-7 cells treated with vehicle or MEN1 shRNA lentivirus (n = 3). (C) Venn diagrams of differentially expressed genes (fold change ≥1.5 or ≤0.66) in T47D or MCF-7 cells after shMEN1 knockdown compared with vehicle controls (n = 2). (D) Pathway annotation analysis of MEN1-upregulated and MEN1-downregulated genes in T47D or MCF-7 cells using DAVID including cancer hallmark pathways. (E) Schematic illustration of five major metabolic pathways. (F) Expression heat maps of oxidative phosphorylation (OXPHOS) and glycolytic genes in both MEN1 knockdown T47D and MCF-7 cells (fold changes relative to vehicle controls). (G) Bar charts of the expression levels of representative OXPHOS and glycolytic genes affected by MEN1 knockdown in T47D or MCF-7 cells using RT-qPCR. Data are presented as mean ± S.D. Unpaired two-tailed Student’s t-test was used for statistics. * p < 0.05, ** p < 0.01, and *** p < 0.001. Image collected and cropped by CiteAb from the following publication (https://pubmed.ncbi.nlm.nih.gov/32971831), licensed under a CC-BY license. Not internally tested by R&D Systems.
Detection of Rat beta-Actin by Western Blot
Nesfatin promoted nuclear translocation of Nrf‐2 with decreased cellular ROS levels. (A) The levels of Nrf‐2 and NQO‐1 in cytoplasmic fractions as measured by western blot analysis. (B) The levels of Nrf‐2 and NQO‐1 in nuclear fractions as measured by western blot analysis (**, p < 0.01 vs. vehicle group, #, ##, p < 0.05, 0.01 vs. CA group). Image collected and cropped by CiteAb from the following open publication (https://pubmed.ncbi.nlm.nih.gov/39097921), licensed under a CC-BY license. Not internally tested by R&D Systems.
Detection of Human beta -Actin by Western Blot
Effect of CAPG suppression on EBOV release from cells. (A) Measurement of the quantity of viral RNA released from siRNA treated cells. At 48 hpi, RNA was extracted from the supernatant (sup) and the remaining cells (cell lysate), then virus RNA levels measured by RT-qPCR using primers for NP. The graph indicates Cq supernatant-cell lysate signals in each sample relative to the siRNA control. (B) The efficiency of VLP formation from cells treated with each indicated siRNA. Hela cells seeded in a 6 well plate were transduced with siRNA (40 nM each) and pCAGGS-Ebola VP40 plasmid (0.5 µg). At 48 h post transfection, the supernatant was collected and centrifuged to remove cell debris. VLPs were collected by pelleting through a 20% sucrose cushion. VLP pellets and cell lysates were analyzed by immunoblot. Band intensity from each sample is shown relative to siRNA non-targeting control. All assays were repeated at least twice and the representative data sets are shown. One-way ANOVA with Dunnett’s multiple comparisons test was used for statistical analysis relative to control samples. One-way ANOVA with Dunnett’s multiple comparisons test was used for statistical analysis relative to control samples. The means at least two independent experiments ± SDs are shown. **, p < 0.01; ****, p < 0.0001. Image collected and cropped by CiteAb from the following open publication (https://pubmed.ncbi.nlm.nih.gov/36146710), licensed under a CC-BY license. Not internally tested by R&D Systems.
Detection of beta -Actin by Western Blot
High expression of fibroblast growth factor receptor 2 (FGFR2) coincides with liver fibrosis. (A) The expression of FGFR2 in fibrotic liver and normal liver tissues was evaluated through data mining of human samples affected by Hepatitis B infection (GSE38941), alcohol abuse (GSE28619), and nonalcoholic steatohepatitis (GSE48452), as well as mouse samples induced with carbon tetrachloride (CCl4) (GSE152329, GSE98577). The differential fold expression was determined by comparing the expression of FGFR2 in the fibrotic liver and normal liver tissues. (B) A comparison of changes in FGFR2 expression in liver fibrosis patients in remission (improved) or not in remission (not improved) with mining data of GSE175448. (C) The correlation between FGFR2 expression and the liver fibrosis score (Ishak score) was analyzed by comparing FGFR2 expression in three pairs of liver fibrotic tissues and normal liver tissues through immunohistochemistry. (D) FGFR2 expression in liver fibrosis tissues and normal liver tissues was verified by Western blot and (E) q-PCR analyses. (E) Liver tissues from mice treated with CCl4 for different durations were used to determine the expression of the liver fibrosis markers Actin Alpha 2 (ACTA2) and FGFR2 by q-PCR and the trends of their expression with increasing days of induction. (F) The expression of ACTA2 and (G) FGFR2 was determined by q-PCR in liver tissues from mice treated with CCl4 for varying durations. The statistical significance was determined based on the p-value. The results are marked as significant “*” when p < 0.05, “**” when p < 0.01, “***” when p < 0.001, and not significant (ns) if p ≥ 0.05. Image collected and cropped by CiteAb from the following open publication (https://pubmed.ncbi.nlm.nih.gov/37111305), licensed under a CC-BY license. Not internally tested by R&D Systems.
Detection of beta -Actin by Western Blot
Regulation of Wnt and NF-kappa B signaling after acute alcohol intoxication (AAI) and fracture in the liver. Two hours before the initiation of experiments, the animals received an intragastric gavage of either sodium chloride (ctrl, n = 12) or ethanol (EtOH, n = 12) to simulate an AAI. Fx groups underwent osteotomy with the placement of an external fixator, and sham groups received only the external fixator. Twenty-four hours later, mice were euthanized, and liver sampling was performed. (A) Western blot analysis and quantification of protein expression levels of (B) A20, (C) Wnt1, (D) Wnt3a, (E) non-phosphorylated beta -catenin, and (F) phosphorylated beta -catenin, as well as (G) the ratio of phosphorylated and non-phosphorylated I kappa B alpha in liver tissue. The relative protein expression of normalized to beta -actin was calculated and is shown. * p < 0.05, n = 6 per group. Image collected and cropped by CiteAb from the following open publication (https://pubmed.ncbi.nlm.nih.gov/40430063), licensed under a CC-BY license. Not internally tested by R&D Systems.
Detection of beta -Actin by Western Blot
Importance of the mTOR pathway for podocyte differentiation. (A) Protein expression of mTOR, p-mTOR, p70 S6K, p-p70 S6K, S6, p-S6, AKT, and p-AKT, assessed using western blotting analysis. (B) mRNA expression of podocyte-associated genes (NEPHRIN, PODOCIN, SYNAPTOPODIN, WT1, and MAFB) following the addition of the S6 inhibitor LY2584702. Results are shown as the mean ± SD of 6 samples. Statistical analysis was performed using one-way ANOVA with Bonferroni’s test. ***p < 0.001. Image collected and cropped by CiteAb from the following open publication (https://pubmed.ncbi.nlm.nih.gov/37973990), licensed under a CC-BY license. Not internally tested by R&D Systems.
Detection of beta -Actin by Western Blot
TREM1 inhibition via VJDT depletes LCSLCs, reduces tumor size, and decreases spheroid formation. (A) Tumor growth curves for Huh7 vehicle and VJDT treated mice (mean ± SEM, n=5 mice/group). Representative images of tumors from indicated groups on day 22. (B) Flow cytometry analysis shows a significant reduction in CD133+EpCAM+ LCSLCs in VJDT-treated tumors compared to the vehicle (n=4 per group). (C) Western blot analysis of two vehicle-treated and two VJDT-treated tumors shows reduced expression of stem cell-related proteins in VJDT-treated tumors. (D) Representative images from the spheroid formation assay demonstrate reduced spheroid formation following VJDT treatment. Scale bar = 50 µm. Spheroids were counted using ImageJ. **p<0.01, ***p<0.001, ns-not significant. Image collected and cropped by CiteAb from the following open publication (https://pubmed.ncbi.nlm.nih.gov/40677705), licensed under a CC-BY license. Not internally tested by R&D Systems.Applications for beta-Actin Antibody (937215)
Application
Recommended Usage
Immunocytochemistry
0.1-25 µg/mL
Sample: Immersion fixed NIH-3T3 mouse embryonic fibroblast cell line
Sample: Immersion fixed NIH-3T3 mouse embryonic fibroblast cell line
Simple Western
1 µg/mL
Sample: A431 human epithelial carcinoma cell line, Jurkat human acute T cell leukemia cell line, HeLa human cervical epithelial carcinoma cell line, C2C12 mouse myoblast cell line, and C6 rat glioma cell line
Sample: A431 human epithelial carcinoma cell line, Jurkat human acute T cell leukemia cell line, HeLa human cervical epithelial carcinoma cell line, C2C12 mouse myoblast cell line, and C6 rat glioma cell line
Western Blot
0.01 µg/mL
Sample: A431 human epithelial carcinoma cell line, C2C12 mouse myoblast cell line, and Rat‑2 rat embryonic fibroblast cell line
Sample: A431 human epithelial carcinoma cell line, C2C12 mouse myoblast cell line, and Rat‑2 rat embryonic fibroblast cell line
Reviewed Applications
Read 15 reviews rated 4.8 using MAB8929 in the following applications:
Formulation, Preparation, and Storage
Purification
Protein A or G purified from hybridoma culture supernatant
Reconstitution
Reconstitute at 0.5 mg/mL in sterile PBS. For liquid material, refer to CoA for concentration.
Loading...
Formulation
Lyophilized from a 0.2 μm filtered solution in PBS with Trehalose. *Small pack size (SP) is supplied either lyophilized or as a 0.2 µm filtered solution in PBS.
Shipping
Lyophilized product is shipped at ambient temperature. Liquid small pack size (-SP) is shipped with polar packs. Upon receipt, store immediately at the temperature recommended below.
Stability & Storage
Use a manual defrost freezer and avoid repeated freeze-thaw cycles.
- 12 months from date of receipt, -20 to -70 °C as supplied.
- 1 month, 2 to 8 °C under sterile conditions after reconstitution.
- 6 months, -20 to -70 °C under sterile conditions after reconstitution.
Calculators
Background: beta-Actin
( gamma -Smooth Muscle, gamma -non-muscle) isoforms. Non-muscle beta - and gamma -actin are also known as cytoplasmic actin.
Alternate Names
ACTB, betaActin
Gene Symbol
ACTB
UniProt
Additional beta-Actin Products
Product Documents for beta-Actin Antibody (937215)
Certificate of Analysis
To download a Certificate of Analysis, please enter a lot or batch number in the search box below.
Note: Certificate of Analysis not available for kit components.
Product Specific Notices for beta-Actin Antibody (937215)
For research use only
Related Research Areas
Citations for beta-Actin Antibody (937215)
 Powered by Bioz
Customer Reviews for beta-Actin Antibody (937215) (15)
4.8 out of 5
15 Customer Ratings
Have you used beta-Actin Antibody (937215)?
Submit a review and receive an Amazon gift card!
$25/€18/£15/$25CAN/¥2500 Yen for a review with an image
$10/€7/£6/$10CAN/¥1110 Yen for a review without an image
Submit a review
Customer Images

Showing
1
-
5 of
15 reviews
Showing All
Filter By:
-
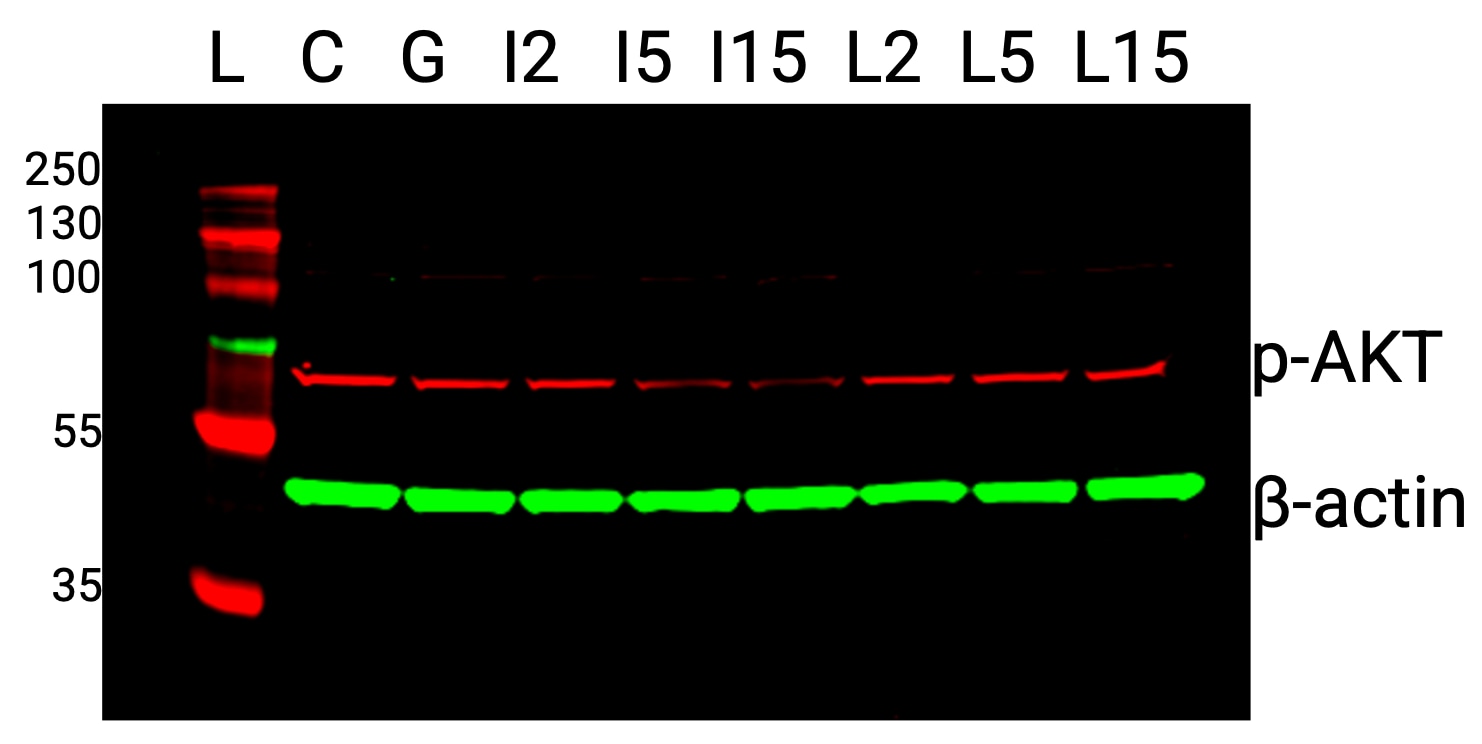
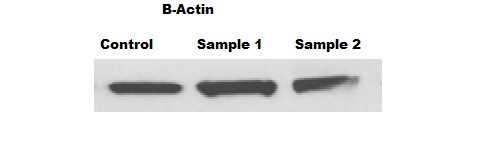
Application: Western BlotSample Tested: HeLa human cervical epithelial carcinoma cell lineSpecies: HumanVerified Customer | Posted 04/29/2026a.p-AKT detected using (p-AKT1/2/3 antibody Ser 473 Santa Cruz) 1:500 and IRDye 680RD Donkey anti-Rabbit at 1:10000 b.Beta-actin detected using (Human/mouse/rat beta-actin MAB8929 R&D Systems) 1:25000 and IRDye 800CW Donkey anti-mouse at 1:10000Western blot analysis of HeLa cell lysates (cells were treated prior to Gas-6 activation) to monitor how phospho-AKT changes after Gas-6 activation. Concentration of beta-actin used in this assay was 1:25000. Antibody used in-vitro.

-
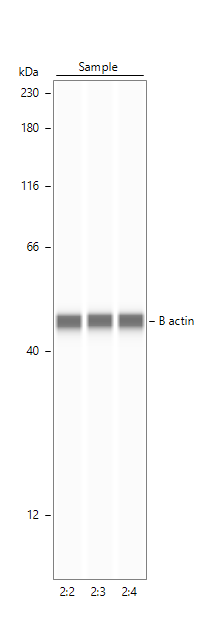
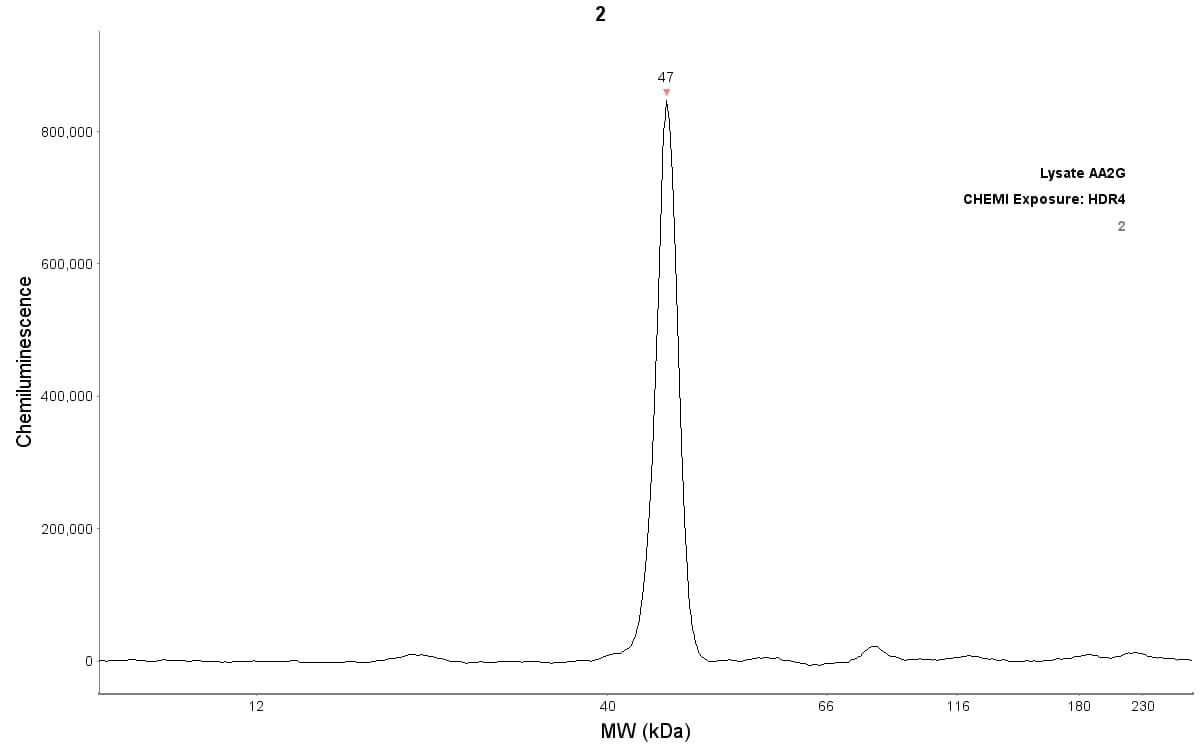
Application: Simple WesternSample Tested: Lung tissueVerified Customer | Posted 11/19/2024B actin in human lungs1:40 in antibody diluent 2
-
Application: Western BlotSample Tested: Skin tissueSpecies: MouseVerified Customer | Posted 08/09/2021
-
Application: Simple WesternSample Tested: HCT-116 human colorectal carcinoma cell lineSpecies: HumanVerified Customer | Posted 08/27/2020Beta Actin on HCT116 cell lysates
-
Application: Western BlotSample Tested: MDA-MB-231 human breast cancer cell lineSpecies: HumanVerified Customer | Posted 03/07/2020
-
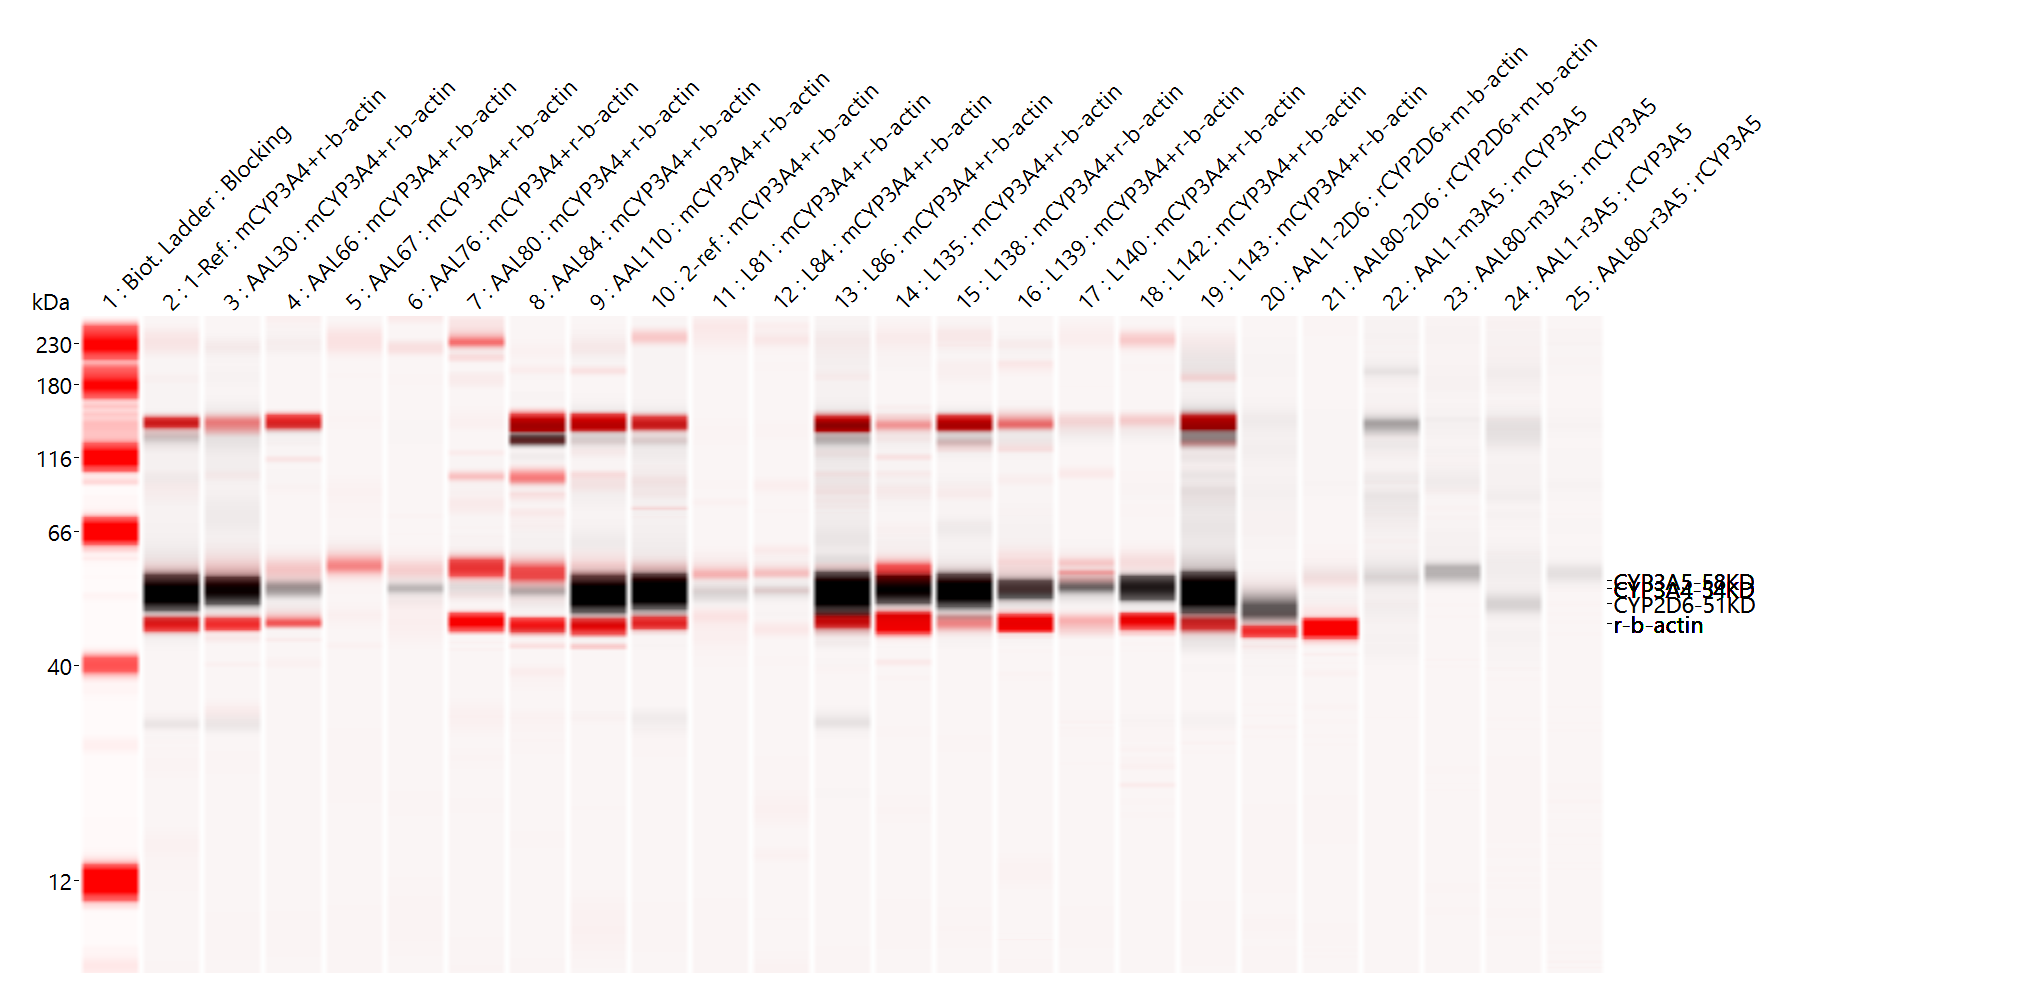
Application: Simple WesternSample Tested: Human liverSpecies: HumanVerified Customer | Posted 11/07/2019In Lane 20 and 21, two Human Liver Tissue Lysate samples are blotted with both rabbit CYP2D6 and mouse b-actin Cat# MAB8929 (red, NIR channel). The red 47KD mouse-b-actin band seems lower than rabbit-b-actin. Dilution are 1:50.On Jess from Protein Simple
-
Application: Western BlotSample Tested: A549 human lung carcinoma cell lineSpecies: HumanVerified Customer | Posted 08/12/2019Used at 50 ng/ml
-
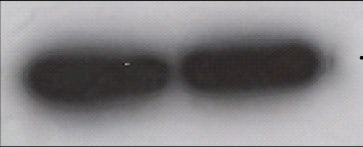
Application: Western BlotSample Tested: Cartilage tissueSpecies: HumanVerified Customer | Posted 08/06/2019Antibody dilution was 1:100. Beta-Actin clearly expressed in mouse meniscus lysates, detected with ECL kit.
-
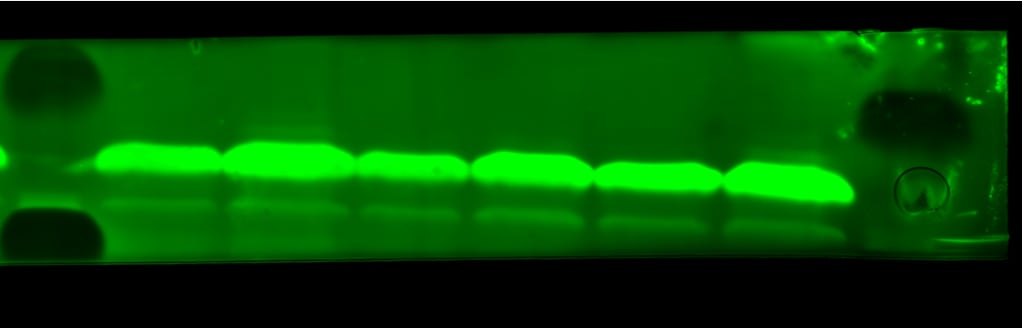
Application: Simple WesternSample Tested: Skin tissueSpecies: HumanVerified Customer | Posted 06/17/2019Actin expression in reconstructed human epidermis lysate (200 µg/mL protein concentration) detected in chemiluminescence. Antibody dilution 1:50, works also at 1:100 dilution.
-
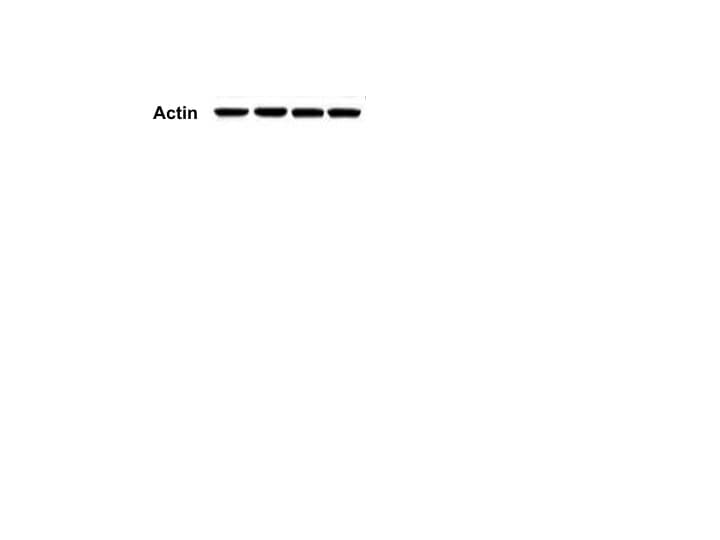
Application: Western BlotSample Tested: Cancer cell lysates and Xenograft lysatesSpecies: Human and MouseVerified Customer | Posted 07/03/2018
-
Application: Western BlotSample Tested: IPS2 induced pluripotent stem cellsSpecies: MouseVerified Customer | Posted 01/25/2018
-
Application: Immunocytochemistry/ImmunofluorescenceSample Tested: Endothelial progenitor cellsSpecies: Human and MouseVerified Customer | Posted 12/15/2016I have used for detecting expression of protein in Human and mouse Endothelial Progenitor cells (EPCs).
-
Application: Western BlotSample Tested: Lineage depleted bone marrow cellsSpecies: MouseVerified Customer | Posted 10/25/2016
-
Application: Western BlotSample Tested: Liver tissue, Hepa 1-6 mouse hepatoma cell line and HepG2 human hepatocellular carcinoma cell lineSpecies: Mouse and HumanVerified Customer | Posted 08/22/2016
-
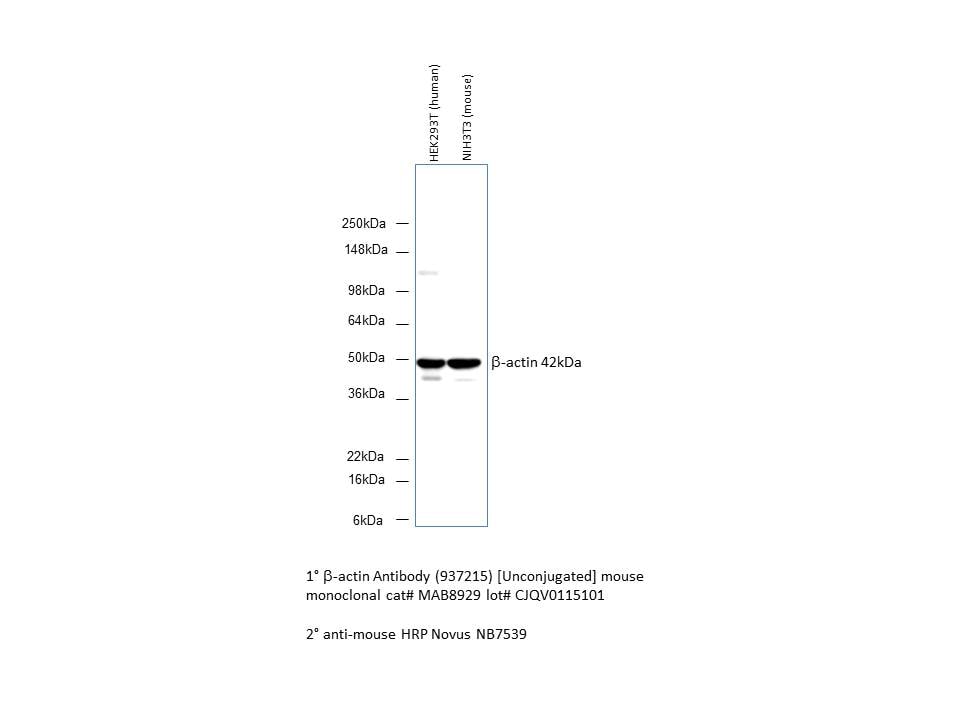
Application: Western BlotSample Tested: HEK293T and NIH3T3 whole cell lysateSpecies: HumanVerified Customer | Posted 03/15/2016beta-Actin Antibody (MAB8929)
There are no reviews that match your criteria.
Protocols
Find general support by application which include: protocols, troubleshooting, illustrated assays, videos and webinars.
- Appropriate Fixation of IHC/ICC Samples
- Cellular Response to Hypoxia Protocols
- ClariTSA™ Fluorophore Kits
- Detection & Visualization of Antibody Binding
- ICC Cell Smear Protocol for Suspension Cells
- ICC Immunocytochemistry Protocol Videos
- ICC for Adherent Cells
- Immunocytochemistry (ICC) Protocol
- Immunocytochemistry Troubleshooting
- Immunofluorescence of Organoids Embedded in Cultrex Basement Membrane Extract
- Immunohistochemistry (IHC) and Immunocytochemistry (ICC) Protocols
- Preparing Samples for IHC/ICC Experiments
- Preventing Non-Specific Staining (Non-Specific Binding)
- Primary Antibody Selection & Optimization
- Protocol for VisUCyte™ HRP Polymer Detection Reagent
- Protocol for the Fluorescent ICC Staining of Cell Smears - Graphic
- Protocol for the Fluorescent ICC Staining of Cultured Cells on Coverslips - Graphic
- Protocol for the Preparation and Fluorescent ICC Staining of Cells on Coverslips
- Protocol for the Preparation and Fluorescent ICC Staining of Non-adherent Cells
- Protocol for the Preparation and Fluorescent ICC Staining of Stem Cells on Coverslips
- Protocol for the Preparation of a Cell Smear for Non-adherent Cell ICC - Graphic
- R&D Systems Quality Control Western Blot Protocol
- TUNEL and Active Caspase-3 Detection by IHC/ICC Protocol
- The Importance of IHC/ICC Controls
- Troubleshooting Guide: Western Blot Figures
- Western Blot Conditions
- Western Blot Protocol
- Western Blot Protocol for Cell Lysates
- Western Blot Troubleshooting
- Western Blot Troubleshooting Guide
- View all Protocols, Troubleshooting, Illustrated assays and Webinars
FAQs for beta-Actin Antibody (937215)
Showing
1
-
1 of
1 FAQ
Showing All
-
Q: Does this Beta-Actin antibody come in lyophilized form?
A: Yes, we carry this beta-actin antibody in lyophilized format.
Loading...
Associated Pathways