
Key Product Details
Validated by
Biological Validation
Species Reactivity
Validated:
Human, Mouse, Rat
Cited:
Human, Mouse, Rat, Hamster, Transgenic Mouse
Applications
Validated:
Immunohistochemistry, Western Blot, Immunocytochemistry, Simple Western
Cited:
Western Blot, Flow Cytometry, Simple Western, Western Blot Control
Label
Unconjugated
Antibody Source
Polyclonal Goat IgG
Loading...
Product Specifications
Immunogen
E. coli-derived recombinant human GAPDH/G3PDH
Met1-Ala150
Accession # P04406
Met1-Ala150
Accession # P04406
Specificity
Detects human, mouse, and rat GAPDH/G3PDH in direct ELISAs. In direct ELISAs, approximately 25% cross-reactivity with recombinant human GAPDH-2 is observed.
Clonality
Polyclonal
Host
Goat
Isotype
IgG
Scientific Data Images for GAPDH Antibody
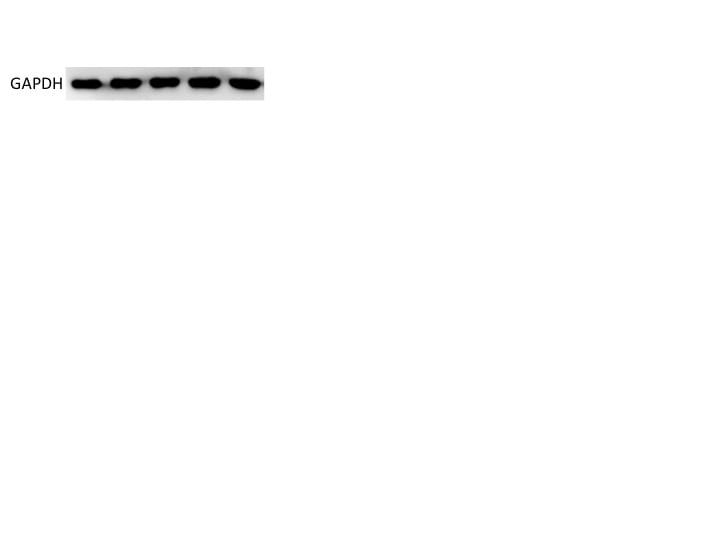
Detection of Human/Mouse/Rat GAPDH/G3PDH by Western Blot.
Western blot shows lysates of mouse, human, and rat brain tissue. PVDF membrane was probed with 1 µg/mL of Goat Anti-Human/Mouse/Rat GAPDH/G3PDH Antigen Affinity-purified Polyclonal Antibody (Catalog # AF5718) followed by HRP-conjugated Anti-Goat IgG Secondary Antibody (HAF017). A specific band was detected for GAPDH/G3PDH at approximately 38 kDa (as indicated). This experiment was conducted under reducing conditions and using Immunoblot Buffer Group 2.
GAPDH in HeLa Human Cell Line.
GAPDH was detected in immersion fixed HeLa human cervical epithelial carcinoma cell line using Goat Anti-Human/Mouse/Rat GAPDH Antigen Affinity-purified Polyclonal Antibody (Catalog # AF5718) at 5 µg/mL for 3 hours at room temperature. Cells were stained using the NorthernLights™ 557-conjugated Anti-Goat IgG Secondary Antibody (red; NL001) and counterstained with DAPI (blue). View our protocol for Fluorescent ICC Staining of Cells on Coverslips.
GAPDH/G3PDH in Human Kidney.
GAPDH/G3PDH was detected in immersion fixed paraffin-embedded sections of normal human kidney using Goat Anti-Human/Mouse/Rat GAPDH/G3PDH Antigen Affinity-purified Polyclonal Antibody (Catalog # AF5718) at 8 µg/mL overnight at 4 °C. Tissue was stained using the Anti-Goat HRP-DAB Cell & Tissue Staining Kit (brown; CTS008) and counterstained with hematoxylin (blue). Specific staining was localized to cytoplasm and nuclei of convoluted tubules. View our protocol for Chromogenic IHC Staining of Paraffin-embedded Tissue Sections.This application has not been tested in mouse or rat samples.
GAPDH in Human Prostate Cancer Tissue.
GAPDH was detected in immersion fixed paraffin-embedded sections of human prostate cancer tissue using Goat Anti-Human/Mouse/Rat GAPDH Antigen Affinity-purified Polyclonal Antibody (Catalog # AF5718) at 3 µg/mL for 1 hour at room temperature followed by incubation with the Anti-Goat IgG VisUCyte™ HRP Polymer Antibody (VC004). Tissue was stained using DAB (brown) and counterstained with hematoxylin (blue). Specific staining was localized to cytoplasm and nuclei. View our protocol for IHC Staining with VisUCyte HRP Polymer Detection Reagents.
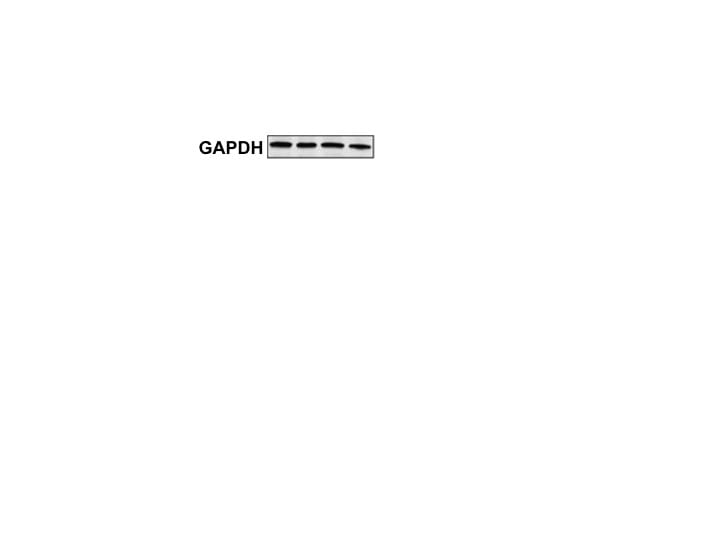
Detection of Human GAPDH by Simple WesternTM.
Simple Western lane view shows lysates of human brain (motor cortex) tissue and HepG2 human hepatocellular carcinoma cell line, loaded at 0.2 mg/mL. A specific band was detected for GAPDH at approximately 43 kDa (as indicated) using 10 µg/mL of Goat Anti-Human/Mouse/Rat GAPDH Antigen Affinity-purified Polyclonal Antibody (Catalog # AF5718) followed by 1:50 dilution of HRP-conjugated Anti-Goat IgG Secondary Antibody (HAF109). This experiment was conducted under reducing conditions and using the 12-230 kDa separation system.
Detection of Mouse GAPDH by Western Blot
Role of Akt pathway in aliskiren's effects on attenuating collagen expression.A and B demonstrate the results of Western blotting for phospho- and total Akt in hearts of mice treated with various diets. C shows changes in the protein levels of collagen type I, phospho- and total Akt in response to 24 hours of exposure to D,L. Homocysteine (200 µmol/L) with or without pre-treatment with aliskiren 10 µmol/L (AL), wortmannin 1 µmol/L or Akt Inhibitor VIII 1 µmol/L. Hhe – Hhe-inducing diet; D,L, homocysteine (lower panel); AL 0.05– aliskiren 0.5 mg/kg/day; AL 5– aliskiren 5 mg/kg/day; AL 50– aliskiren 50 mg/kg/day; Wort – wortmannin; Akt in – Akt inhibitor VIII. *p<0.05; **p<0.01; and ***p<0.001. Image collected and cropped by CiteAb from the following publication (https://pubmed.ncbi.nlm.nih.gov/24349097), licensed under a CC-BY license. Not internally tested by R&D Systems.
Detection of Rat GAPDH by Western Blot
Effect of prodigiosins on the mRNA and protein expression of HO-1 in gastric tissue.Data (means ± SEM of three assays) were normalized to the levels of GAPDH and expressed as fold induction (log2 scale), relative to the level of HO-1 in the control. aP < 0.05, significant difference vs. the health rats; bP < 0.05, significant difference vs. HCl/ethanol-induced rats, Duncan's post-hoc test. Image collected and cropped by CiteAb from the following publication (https://pubmed.ncbi.nlm.nih.gov/31194753), licensed under a CC-BY license. Not internally tested by R&D Systems.
Detection of Human GAPDH by Western Blot
The DU145FP cells express higher levels of cancer stemness related genes. (A) Transcriptome analyses of prostate cancer stemness-related markers. The Log2 transformed ratio of FPKM values (e.g., FP/WT) are indicated by color-coded index bars. (B) Cells were stained with fluorophore conjugated monoclonal antibodies against CD44 and EPCAM, the antibody against integrin alpha 2 beta 3 without fluorophore conjugation was detected by using secondary antibody conjugated with fluorophore, and stained cells were analyzed by flow cytometry. The scatter plots and histograms show representative results. CTRL denote cell stained with isotype control antibody or only secondary antibody; ST denote cell stained with antibody against EPCAM and integrin alpha 2 beta 3; US denote unstained cells. (C) Immunoblotting confirmation of the protein expression of A-tubulin, GAPDH, SOX9, SLUG, HIF1A, HIF2A, CD44 and integrin alpha 2 beta 3. Image collected and cropped by CiteAb from the following publication (https://pubmed.ncbi.nlm.nih.gov/28698547), licensed under a CC-BY license. Not internally tested by R&D Systems.
Detection of Rat GAPDH by Western Blot
Effects of aliskiren on homocysteine-induced matrix expression in cultured cardiac fibroblasts.Fibroblasts were cultured in the presence or absence of D,L, homocysteine 200 µmol/L for 24 hours after pretreatment with varying concentrations of aliskiren (0.1–10 µmol/L). Real time PCR was done to measure relative expression of COLIA2 (alpha 2 chain of type I collagen; A) and COL3A1 (alpha 1 chain of type III collagen; B) genes. Figure 5C demonstrates the results of real time PCR to compare the effects of losartan and captopril with aliskiren on homocysteine induced expression of COL1A2 gene. Western blotting was conducted to measure the expression of collagen type I protein (D and E) Glyceraldehyde 3 phosphate dehydrogenase (GAPDH) was used as internal control. Hcy-D,L, homocysteine; AL-aliskiren; Los – losartan; and Cap – captopril. *p<0.05. Image collected and cropped by CiteAb from the following publication (https://pubmed.ncbi.nlm.nih.gov/24349097), licensed under a CC-BY license. Not internally tested by R&D Systems.
Detection of Mouse GAPDH by Western Blot
Role of Akt pathway in aliskiren's effects on attenuating collagen expression.A and B demonstrate the results of Western blotting for phospho- and total Akt in hearts of mice treated with various diets. C shows changes in the protein levels of collagen type I, phospho- and total Akt in response to 24 hours of exposure to D,L. Homocysteine (200 µmol/L) with or without pre-treatment with aliskiren 10 µmol/L (AL), wortmannin 1 µmol/L or Akt Inhibitor VIII 1 µmol/L. Hhe – Hhe-inducing diet; D,L, homocysteine (lower panel); AL 0.05– aliskiren 0.5 mg/kg/day; AL 5– aliskiren 5 mg/kg/day; AL 50– aliskiren 50 mg/kg/day; Wort – wortmannin; Akt in – Akt inhibitor VIII. *p<0.05; **p<0.01; and ***p<0.001. Image collected and cropped by CiteAb from the following publication (https://pubmed.ncbi.nlm.nih.gov/24349097), licensed under a CC-BY license. Not internally tested by R&D Systems.
Detection of Mouse GAPDH by Western Blot
Effects of aliskiren on myocardial matrix gene expression.Real time PCR was performed with ventricular tissue obtained from mice after 12-inducing diet and different doses of aliskiren. Figure 3A demonstrates changes in expression of COL1A1(alpha 1 chain of type I collagen) and 3B shows changes in COL1A2(alpha2 chain of type I collagen) genes. Lower right panels (3C and 3D) demonstrate the results of western blotting for collagen type I in various groups. Hhe – Hhe-inducing diet; AL 0.5– aliskiren 0.5 mg/kg/day; AL 5– aliskiren 5 mg/kg/day; and AL 50– aliskiren 50 mg/kg/day. * p<0.05; and *** p<0.001. Image collected and cropped by CiteAb from the following publication (https://pubmed.ncbi.nlm.nih.gov/24349097), licensed under a CC-BY license. Not internally tested by R&D Systems.
Detection of Mouse Human/Mouse/Rat GAPDH Antibody by Western Blot
S. Typhimurium evades autophagy by disrupting Sirt1-dependent AMPK activation.(A) Immunofluorescence image of S. Typhimurium co-localization with LC3 in GFP-LC3 expressing BMDMs at indicated time points. Data shown are representative of 3 independent experiments (n = 3). (B) Immunoblot analysis of p62 and LC3 expression upon S. Typhimurium infection in BMDMs. (C) LC3 and p62 expression levels are quantified by densitometry analysis. Data shown are from 3 independent experiments. (D) Confocal image of macrophages stained for Sirt1 and LC3. (E) BMDMs stained for LC3 and AMPK upon S. Typhimurium infection. (F) Confocal image of macrophages stained for LKB1 and LC3. (G) Immunoblot analysis of Sirt1, AMPK and LKB1 in wild type (WT) and Atg7-deficient macrophages. (H) Densitometric analysis of Sirt1, AMPK and LKB1 immunoblots (n = 3). Bar graphs are expressed as mean ± SEM, ***p≤0.001, **p≤0.01 and *p≤0.05. Scale bar = 10μm for microscopical images. Image collected and cropped by CiteAb from the following publication (https://pubmed.ncbi.nlm.nih.gov/28192515), licensed under a CC-BY license. Not internally tested by R&D Systems.
Detection of Mouse Human/Mouse/Rat GAPDH Antibody by Western Blot
S. Typhimurium mediated targeting of Sirt1 for lysosomal degradation is virulence dependent.Immunoblot analysis of ACC and LKB1 activation upon infection with delta ssrB(A) and delta ssaV(B) compared to S. Typhimurium. Sirt1 and acetylated-NF kappa B from macrophages infected with delta ssrB(C)and delta ssaV(D) compared to S. Typhimurium. (E) Expression of Sirt1 from cytoplasmic (C) and nuclear (N) fraction from BMDMs infected with delta ssrB. (F) Confocal image of Sirt1 and LysoTracker Red in delta ssrB-infected BMDMs. Sirt1-LysoTracker Red co-localization in untreated BMDMs infected with S. Typhimurium for 4h is shown for comparison (n = 3). (G) Immunoblot analysis of LC3 and p62. (H) Densitometric analysis of LC3 lipidation and p62 (n = 4). (I) Immunofluorescence image of delta ssrB-infected BMDMs stained for LC3 and LPS of S. Typhimurium (n = 3). (J) Quantitation of LC3 co-localization with SCVs. 100 SCVs were counted and expressed as percentage co-localization. (K) AKT, mTOR, p70S6K, NDRG1 expression upon S. Typhimurium (ST) and delta ssrB infection in BMDMs. (L) Densitometric analysis of AKT, mTOR, p70S6K and NDRG1 are shown from 3 independent experiments. Bar graphs are expressed as mean ± SEM, ***p≤0.001. Scale bar = 10μm for microscopical images. Image collected and cropped by CiteAb from the following publication (https://pubmed.ncbi.nlm.nih.gov/28192515), licensed under a CC-BY license. Not internally tested by R&D Systems.
Detection of Mouse Human/Mouse/Rat GAPDH Antibody by Western Blot
S. Typhimurium evades autophagy by disrupting Sirt1-dependent AMPK activation.(A) Immunofluorescence image of S. Typhimurium co-localization with LC3 in GFP-LC3 expressing BMDMs at indicated time points. Data shown are representative of 3 independent experiments (n = 3). (B) Immunoblot analysis of p62 and LC3 expression upon S. Typhimurium infection in BMDMs. (C) LC3 and p62 expression levels are quantified by densitometry analysis. Data shown are from 3 independent experiments. (D) Confocal image of macrophages stained for Sirt1 and LC3. (E) BMDMs stained for LC3 and AMPK upon S. Typhimurium infection. (F) Confocal image of macrophages stained for LKB1 and LC3. (G) Immunoblot analysis of Sirt1, AMPK and LKB1 in wild type (WT) and Atg7-deficient macrophages. (H) Densitometric analysis of Sirt1, AMPK and LKB1 immunoblots (n = 3). Bar graphs are expressed as mean ± SEM, ***p≤0.001, **p≤0.01 and *p≤0.05. Scale bar = 10μm for microscopical images. Image collected and cropped by CiteAb from the following publication (https://pubmed.ncbi.nlm.nih.gov/28192515), licensed under a CC-BY license. Not internally tested by R&D Systems.
Detection of Mouse Human/Mouse/Rat GAPDH Antibody by Western Blot
S. Typhimurium mediated targeting of Sirt1 for lysosomal degradation is virulence dependent.Immunoblot analysis of ACC and LKB1 activation upon infection with delta ssrB(A) and delta ssaV(B) compared to S. Typhimurium. Sirt1 and acetylated-NF kappa B from macrophages infected with delta ssrB(C)and delta ssaV(D) compared to S. Typhimurium. (E) Expression of Sirt1 from cytoplasmic (C) and nuclear (N) fraction from BMDMs infected with delta ssrB. (F) Confocal image of Sirt1 and LysoTracker Red in delta ssrB-infected BMDMs. Sirt1-LysoTracker Red co-localization in untreated BMDMs infected with S. Typhimurium for 4h is shown for comparison (n = 3). (G) Immunoblot analysis of LC3 and p62. (H) Densitometric analysis of LC3 lipidation and p62 (n = 4). (I) Immunofluorescence image of delta ssrB-infected BMDMs stained for LC3 and LPS of S. Typhimurium (n = 3). (J) Quantitation of LC3 co-localization with SCVs. 100 SCVs were counted and expressed as percentage co-localization. (K) AKT, mTOR, p70S6K, NDRG1 expression upon S. Typhimurium (ST) and delta ssrB infection in BMDMs. (L) Densitometric analysis of AKT, mTOR, p70S6K and NDRG1 are shown from 3 independent experiments. Bar graphs are expressed as mean ± SEM, ***p≤0.001. Scale bar = 10μm for microscopical images. Image collected and cropped by CiteAb from the following publication (https://pubmed.ncbi.nlm.nih.gov/28192515), licensed under a CC-BY license. Not internally tested by R&D Systems.
Detection of Mouse Human/Mouse/Rat GAPDH Antibody by Western Blot
S. Typhimurium mediated targeting of Sirt1 for lysosomal degradation is virulence dependent.Immunoblot analysis of ACC and LKB1 activation upon infection with delta ssrB(A) and delta ssaV(B) compared to S. Typhimurium. Sirt1 and acetylated-NF kappa B from macrophages infected with delta ssrB(C)and delta ssaV(D) compared to S. Typhimurium. (E) Expression of Sirt1 from cytoplasmic (C) and nuclear (N) fraction from BMDMs infected with delta ssrB. (F) Confocal image of Sirt1 and LysoTracker Red in delta ssrB-infected BMDMs. Sirt1-LysoTracker Red co-localization in untreated BMDMs infected with S. Typhimurium for 4h is shown for comparison (n = 3). (G) Immunoblot analysis of LC3 and p62. (H) Densitometric analysis of LC3 lipidation and p62 (n = 4). (I) Immunofluorescence image of delta ssrB-infected BMDMs stained for LC3 and LPS of S. Typhimurium (n = 3). (J) Quantitation of LC3 co-localization with SCVs. 100 SCVs were counted and expressed as percentage co-localization. (K) AKT, mTOR, p70S6K, NDRG1 expression upon S. Typhimurium (ST) and delta ssrB infection in BMDMs. (L) Densitometric analysis of AKT, mTOR, p70S6K and NDRG1 are shown from 3 independent experiments. Bar graphs are expressed as mean ± SEM, ***p≤0.001. Scale bar = 10μm for microscopical images. Image collected and cropped by CiteAb from the following publication (https://pubmed.ncbi.nlm.nih.gov/28192515), licensed under a CC-BY license. Not internally tested by R&D Systems.
Detection of Mouse Human/Mouse/Rat GAPDH Antibody by Western Blot
S. Typhimurium mediated targeting of Sirt1 for lysosomal degradation is virulence dependent.Immunoblot analysis of ACC and LKB1 activation upon infection with delta ssrB(A) and delta ssaV(B) compared to S. Typhimurium. Sirt1 and acetylated-NF kappa B from macrophages infected with delta ssrB(C)and delta ssaV(D) compared to S. Typhimurium. (E) Expression of Sirt1 from cytoplasmic (C) and nuclear (N) fraction from BMDMs infected with delta ssrB. (F) Confocal image of Sirt1 and LysoTracker Red in delta ssrB-infected BMDMs. Sirt1-LysoTracker Red co-localization in untreated BMDMs infected with S. Typhimurium for 4h is shown for comparison (n = 3). (G) Immunoblot analysis of LC3 and p62. (H) Densitometric analysis of LC3 lipidation and p62 (n = 4). (I) Immunofluorescence image of delta ssrB-infected BMDMs stained for LC3 and LPS of S. Typhimurium (n = 3). (J) Quantitation of LC3 co-localization with SCVs. 100 SCVs were counted and expressed as percentage co-localization. (K) AKT, mTOR, p70S6K, NDRG1 expression upon S. Typhimurium (ST) and delta ssrB infection in BMDMs. (L) Densitometric analysis of AKT, mTOR, p70S6K and NDRG1 are shown from 3 independent experiments. Bar graphs are expressed as mean ± SEM, ***p≤0.001. Scale bar = 10μm for microscopical images. Image collected and cropped by CiteAb from the following publication (https://pubmed.ncbi.nlm.nih.gov/28192515), licensed under a CC-BY license. Not internally tested by R&D Systems.
Detection of GAPDH by Western Blot
CD44bright cells are mainly positive for ABCG2, Oct3/4 and Nanog.(A) Double staining of CD44 and ABCG2 surface markers with flow cytometry assay shows higher levels expressions of these factors in both cell lines under hypoxia for 48 hours. (B) The CD44bright cells under normoxia express higher levels of ABCG2, Oct3/4 and Nanog, but the CD44dim cells under the same normoxia condition express very low levels of these factors. The CD44bright cells pretreated under 1% O2 for 48 hours show even higher levels of these factors compared to the CD44bright cells cultivated under normoxia. Image collected and cropped by CiteAb from the following open publication (https://pubmed.ncbi.nlm.nih.gov/22216200), licensed under a CC-BY license. Not internally tested by R&D Systems.
Detection of Human GAPDH by Simple Western
Evaluation of ZL-2201 antiproliferative activity in vitro. A, Chemical structure of ZL-2201, a potent and selective DNA-PK inhibitor. B, Concentration-dependent response to ZL-2201 in M059J and M059K glioblastoma cancer cells measured by CTG after 6-day of treatment. The graph represents the average inhibitory (IC50) values (n = 3). C, Concentration-dependent response to ZL-2201 in CRISPR KO of ATM in A549 and FaDu cancer cells measured by CTG after 6 days of treatment. The graph represents the average inhibitory (IC50) values (n = 2–5). D, IC50 responses to ZL-2201 in ATM mutant cell lines (black bars) versus ATM WT A549 cell line (gray bar). Cell growth was measured by CTG after 6 days of treatment. The graph represents the average inhibitory (IC50) values (n = 2–6). NCI-H1703 (E) and A549 (F) cancer cells were treated with bleomycin (10 μmol/L) for 2 hours followed by the addition of increasing concentration of ZL-2201 for 2 hours. Whole-cell lysates were harvested, and concentration-dependent inhibition of DNA-PK protein were analyzed by Simple Western. Image collected and cropped by CiteAb from the following open publication (https://pubmed.ncbi.nlm.nih.gov/37663435), licensed under a CC-BY license. Not internally tested by R&D Systems.
Detection of Human GAPDH by Simple Western
Phenotypic evaluation of ZL-2201 synergy with various DNA-damaging agents. C, NCI-H1703 cells treated with ZL-2201 (0.1, 0.3, 0.5, 1,&3.6 μmol/L)&a low dose of doxorubicin (0.006 μmol/L) for 2 hours. Whole-cell lysates harvested,&Simple Western was used to show the inhibition of pDNA-PK upon combination treatment of ZL-2201 with doxorubicin. Image collected & cropped by CiteAb from the following open publication (https://pubmed.ncbi.nlm.nih.gov/37663435), licensed under a CC-BY license. Not internally tested by R&D Systems.
Detection of Human GAPDH by Simple Western
Evaluation of ZL-2201 antiproliferative activity in vitro. A, Chemical structure of ZL-2201, a potent and selective DNA-PK inhibitor. B, Concentration-dependent response to ZL-2201 in M059J and M059K glioblastoma cancer cells measured by CTG after 6-day of treatment. The graph represents the average inhibitory (IC50) values (n = 3). C, Concentration-dependent response to ZL-2201 in CRISPR KO of ATM in A549 and FaDu cancer cells measured by CTG after 6 days of treatment. The graph represents the average inhibitory (IC50) values (n = 2–5). D, IC50 responses to ZL-2201 in ATM mutant cell lines (black bars) versus ATM WT A549 cell line (gray bar). Cell growth was measured by CTG after 6 days of treatment. The graph represents the average inhibitory (IC50) values (n = 2–6). NCI-H1703 (E) and A549 (F) cancer cells were treated with bleomycin (10 μmol/L) for 2 hours followed by the addition of increasing concentration of ZL-2201 for 2 hours. Whole-cell lysates were harvested, and concentration-dependent inhibition of DNA-PK protein were analyzed by Simple Western. Image collected and cropped by CiteAb from the following open publication (https://pubmed.ncbi.nlm.nih.gov/37663435), licensed under a CC-BY license. Not internally tested by R&D Systems.Applications for GAPDH Antibody
Application
Recommended Usage
Immunocytochemistry
5-25 µg/mL
Sample: Immersion fixed HeLa human cervical epithelial carcinoma cell line
Sample: Immersion fixed HeLa human cervical epithelial carcinoma cell line
Immunohistochemistry
5-15 µg/mL
Sample: Immersion fixed paraffin-embedded sections of normal human kidney and human prostate cancer tissue
Sample: Immersion fixed paraffin-embedded sections of normal human kidney and human prostate cancer tissue
Simple Western
10 µg/mL
Sample: Human brain (motor cortex) tissue and HepG2 human hepatocellular carcinoma cell line
Sample: Human brain (motor cortex) tissue and HepG2 human hepatocellular carcinoma cell line
Western Blot
1 µg/mL
Sample: Mouse, human, and rat brain tissue
Sample: Mouse, human, and rat brain tissue
Reviewed Applications
Read 9 reviews rated 4.9 using AF5718 in the following applications:
Formulation, Preparation, and Storage
Purification
Antigen Affinity-purified
Reconstitution
Reconstitute at 0.2 mg/mL in sterile PBS. For liquid material, refer to CoA for concentration.
Loading...
Formulation
Lyophilized from a 0.2 μm filtered solution in PBS with Trehalose. See Certificate of Analysis for details.
*Small pack size (-SP) is supplied either lyophilized or as a 0.2 µm filtered solution in PBS.
*Small pack size (-SP) is supplied either lyophilized or as a 0.2 µm filtered solution in PBS.
Shipping
Lyophilized product is shipped at ambient temperature. Liquid small pack size (-SP) is shipped with polar packs. Upon receipt, store immediately at the temperature recommended below.
Stability & Storage
Use a manual defrost freezer and avoid repeated freeze-thaw cycles.
- 12 months from date of receipt, -20 to -70 °C as supplied.
- 1 month, 2 to 8 °C under sterile conditions after reconstitution.
- 6 months, -20 to -70 °C under sterile conditions after reconstitution.
Calculators
Background: GAPDH
Long Name
Glyceraldehyde-3-phosphate Dehydrogenase
Alternate Names
G3PDH
Gene Symbol
GAPDH
UniProt
Additional GAPDH Products
Product Documents for GAPDH Antibody
Certificate of Analysis
To download a Certificate of Analysis, please enter a lot or batch number in the search box below.
Note: Certificate of Analysis not available for kit components.
Product Specific Notices for GAPDH Antibody
For research use only
Related Research Areas
Citations for GAPDH Antibody
 Powered by Bioz
Customer Reviews for GAPDH Antibody (9)
4.9 out of 5
9 Customer Ratings
Have you used GAPDH Antibody?
Submit a review and receive an Amazon gift card!
$25/€18/£15/$25CAN/¥2500 Yen for a review with an image
$10/€7/£6/$10CAN/¥1110 Yen for a review without an image
Submit a review
Customer Images
Showing
1
-
5 of
9 reviews
Showing All
Filter By:
-
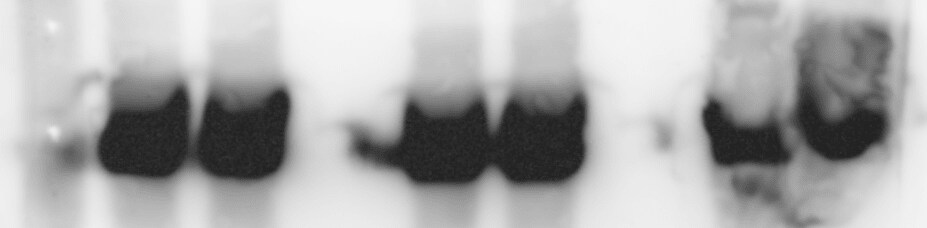
Application: Western BlotSample Tested: Colon tissueSpecies: MouseVerified Customer | Posted 02/23/2022PVDF membrane was probed with 1ug/ml of anti-mouse GAPDH (AF5718) followed by HRP-conjugated anti-goat IgG secondary antibody. GAPDH band was detected at 38kDa.

-
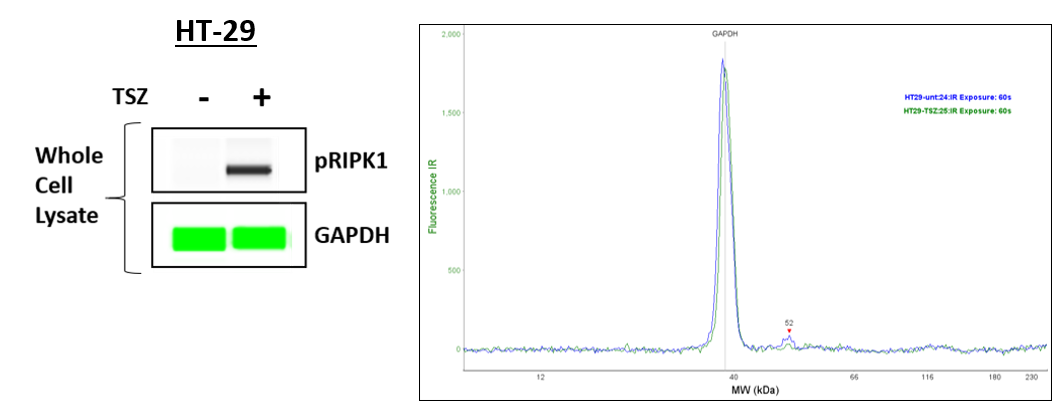
Application: Simple WesternSample Tested: HT-29 human colon adenocarcinoma cell lineSpecies: HumanVerified Customer | Posted 09/28/2020
-
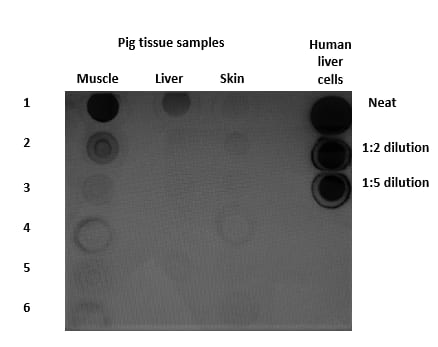
Application: Simple WesternSample Tested: Muscle tissue, Skin tissue, Liver tissue and human liver cellSpecies: Pig and HumanVerified Customer | Posted 08/05/2019Dot blot analysis of the GAPDH from the decomposed pig tissue samples. The protein samples were neat and not diluted. The samples were compared against three control dilutions from human liver cells.
-
Application: Western BlotSample Tested: 4T1 mouse breast cancer cell line and EMT6 cellsSpecies: MouseVerified Customer | Posted 10/17/2018
-
Application: Western BlotSample Tested: HEK293 human embryonic kidney cell lineSpecies: HumanVerified Customer | Posted 07/21/2018
-
Application: Western BlotSample Tested: IPS2 induced pluripotent stem cellsSpecies: MouseVerified Customer | Posted 01/25/2018
-
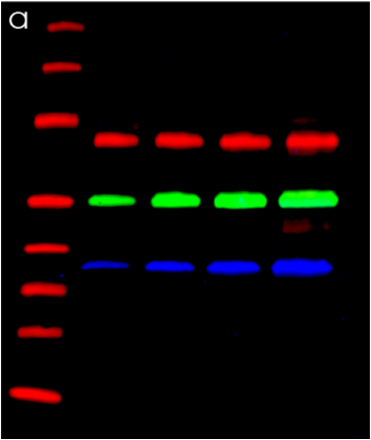
Application: Western BlotSample Tested: Lysate and purified proteinSpecies: HumanVerified Customer | Posted 05/16/2017The blot contains HeLa cell lysate (1, 2, 3 and 5 µg) spiked with 200 ng of human transferrin per lane. Transferrin is detected in the red channel, tubulin is detected in the green channel and GAPDH is detected in the blue channel.
-
Application: Western BlotSample Tested: See PMID 22868230Species: MouseVerified Customer | Posted 01/08/2015
-
Application: Western BlotSample Tested: See PMID 23841780Species: MouseVerified Customer | Posted 01/08/2015
There are no reviews that match your criteria.
Protocols
Find general support by application which include: protocols, troubleshooting, illustrated assays, videos and webinars.
- Antigen Retrieval Protocol (PIER)
- Antigen Retrieval for Frozen Sections Protocol
- Appropriate Fixation of IHC/ICC Samples
- Cellular Response to Hypoxia Protocols
- Chromogenic IHC Staining of Formalin-Fixed Paraffin-Embedded (FFPE) Tissue Protocol
- Chromogenic Immunohistochemistry Staining of Frozen Tissue
- ClariTSA™ Fluorophore Kits
- Detection & Visualization of Antibody Binding
- Fluorescent IHC Staining of Frozen Tissue Protocol
- Graphic Protocol for Heat-induced Epitope Retrieval
- Graphic Protocol for the Preparation and Fluorescent IHC Staining of Frozen Tissue Sections
- Graphic Protocol for the Preparation and Fluorescent IHC Staining of Paraffin-embedded Tissue Sections
- Graphic Protocol for the Preparation of Gelatin-coated Slides for Histological Tissue Sections
- ICC Cell Smear Protocol for Suspension Cells
- ICC Immunocytochemistry Protocol Videos
- ICC for Adherent Cells
- IHC Sample Preparation (Frozen sections vs Paraffin)
- Immunocytochemistry (ICC) Protocol
- Immunocytochemistry Troubleshooting
- Immunofluorescence of Organoids Embedded in Cultrex Basement Membrane Extract
- Immunofluorescent IHC Staining of Formalin-Fixed Paraffin-Embedded (FFPE) Tissue Protocol
- Immunohistochemistry (IHC) and Immunocytochemistry (ICC) Protocols
- Immunohistochemistry Frozen Troubleshooting
- Immunohistochemistry Paraffin Troubleshooting
- Preparing Samples for IHC/ICC Experiments
- Preventing Non-Specific Staining (Non-Specific Binding)
- Primary Antibody Selection & Optimization
- Protocol for Heat-Induced Epitope Retrieval (HIER)
- Protocol for Making a 4% Formaldehyde Solution in PBS
- Protocol for VisUCyte™ HRP Polymer Detection Reagent
- Protocol for the Fluorescent ICC Staining of Cell Smears - Graphic
- Protocol for the Fluorescent ICC Staining of Cultured Cells on Coverslips - Graphic
- Protocol for the Preparation & Fixation of Cells on Coverslips
- Protocol for the Preparation and Chromogenic IHC Staining of Frozen Tissue Sections
- Protocol for the Preparation and Chromogenic IHC Staining of Frozen Tissue Sections - Graphic
- Protocol for the Preparation and Chromogenic IHC Staining of Paraffin-embedded Tissue Sections
- Protocol for the Preparation and Chromogenic IHC Staining of Paraffin-embedded Tissue Sections - Graphic
- Protocol for the Preparation and Fluorescent ICC Staining of Cells on Coverslips
- Protocol for the Preparation and Fluorescent ICC Staining of Non-adherent Cells
- Protocol for the Preparation and Fluorescent ICC Staining of Stem Cells on Coverslips
- Protocol for the Preparation and Fluorescent IHC Staining of Frozen Tissue Sections
- Protocol for the Preparation and Fluorescent IHC Staining of Paraffin-embedded Tissue Sections
- Protocol for the Preparation of Gelatin-coated Slides for Histological Tissue Sections
- Protocol for the Preparation of a Cell Smear for Non-adherent Cell ICC - Graphic
- R&D Systems Quality Control Western Blot Protocol
- TUNEL and Active Caspase-3 Detection by IHC/ICC Protocol
- The Importance of IHC/ICC Controls
- Troubleshooting Guide: Immunohistochemistry
- Troubleshooting Guide: Western Blot Figures
- Western Blot Conditions
- Western Blot Protocol
- Western Blot Protocol for Cell Lysates
- Western Blot Troubleshooting
- Western Blot Troubleshooting Guide
- View all Protocols, Troubleshooting, Illustrated assays and Webinars
Loading...