The hypoxia-inducible transcription factor 1 alpha (HIF-1 alpha ) is the regulated member of the transcription factor heterodimer HIF-1. HIF-1 binds to hypoxia-response elements (HREs) in the promoters of many genes involved in adapting to an environment of insufficient oxygen or hypoxia. Hypoxic tissue environments occur in vascular and pulmonary diseases as well as cancer, which illustrates the broad impact of gene regulation by HIF-1 alpha.

Key Product Details
Validated by
Biological Validation
Species Reactivity
Validated:
Human, Mouse, Rat
Cited:
Human, Mouse, Rat, Transgenic Mouse
Applications
Validated:
Knockout Validated, Western Blot, Immunocytochemistry, Simple Western, Immunoprecipitation, Chromatin Immunoprecipitation (ChIP)
Cited:
Immunohistochemistry, Western Blot, Direct ELISA, Immunocytochemistry, Simple Western, Chromatin Immunoprecipitation (ChIP), IHC-F
Label
Unconjugated
Antibody Source
Polyclonal Goat IgG
Loading...
Product Specifications
Immunogen
E. coli-derived recombinant human HIF-1 alpha /HIF1A
Arg575-Asn826
Accession # Q16665.1
Arg575-Asn826
Accession # Q16665.1
Specificity
Detects human, mouse and rat HIF-1 alpha /HIF1A.
Clonality
Polyclonal
Host
Goat
Isotype
IgG
Scientific Data Images for HIF-1 alpha/HIF1A Antibody
Detection of Human HIF‑1 alpha /HIF1A by Western Blot.
Western blot shows lysates of MCF-7 human breast cancer cell line untreated (-) or treated (+) with 150 µM CoCl2for 16 hours. PVDF membrane was probed with 0.5 µg/mL of Goat Anti-Human/Mouse/Rat HIF-1a/HIF1A Antigen-affinity Purified Polyclonal Antibody, followed by HRP-conjugated Anti-Goat IgG Secondary Antibody (Catalog # HAF109). A specific band was detected for HIF-1a/HIF1A at approximately 120 kDa (as indicated). This experiment was conducted under reducing conditions and using Immunoblot Buffer Group 1.
Detection of HIF‑1 alpha /HIF1A-regulated Genes by Chromatin Immunoprecipitation.
Mouse primary kidney cells treated with 150 µM CoCl2 for overnight were fixed using formaldehyde, resuspended in lysis buffer, and sonicated to shear chromatin. HIF-1a/DNA complexes were immunoprecipitated using 5 µg Goat Anti-Human/Mouse/Rat HIF-1a/HIF1A Antigen Affinity-purified Polyclonal Antibody (Catalog # AF1935) or control antibody (Catalog # AB-108-C) for 15 minutes in an ultrasonic bath, followed by Biotinylated Anti-Goat IgG Secondary Antibody (Catalog # BAF109). Immunocomplexes were captured using 50 µL of MagCellect Streptavidin Ferrofluid (Catalog # MAG999) and DNA was purified using chelating resin solution. The epo promoter was detected by standard PCR.
HIF‑1 alpha /HIF1A Specificity is Shown by Immunocytochemistry in Knockout Cell Line.
HIF-1a/HIF1A was detected in immersion fixed HeLa human cervical epithelial carcinoma cell line treated with DFO but is not detected in HIF-1a/HIF1A knockout (KO) HeLa Human Cell Line cell line using Goat Anti-Human/Mouse/Rat HIF-1a/HIF1A Antigen Affinity-purified Polyclonal Antibody (Catalog # AF1935) at 0.3 µg/mL for 3 hours at room temperature. Cells were stained using the NorthernLights™ 557-conjugated Anti-Goat IgG Secondary Antibody (red; Catalog # NL001) and counterstained with DAPI (blue). Specific staining was localized to nuclei. View our protocol for Fluorescent ICC Staining of Cells on Coverslips.
Detection of Human HIF‑1 alpha /HIF1A by Simple WesternTM.
Simple Western lane view shows lysates of A549 human lung carcinoma cell line untreated (-) or treated (+) with Hypoxia (1% O2), loaded at 0.2 mg/mL. A specific band was detected for HIF-1a/HIF1A at approximately 115 kDa (as indicated) using 5 µg/mL of Goat Anti-Human/Mouse/Rat HIF-1a/HIF1A Antigen Affinity-purified Polyclonal Antibody (Catalog # AF1935) followed by 1:50 dilution of HRP-conjugated Anti-Goat IgG Secondary Antibody (Catalog # HAF109). This experiment was conducted under reducing conditions and using the 12-230 kDa separation system.
Detection of Mouse HIF-1 alpha by Simple Western
Ten days of IH increases hippocampal HIF1a and disrupts Barnes maze performance in wild-type mice but not in HIF1a+/−. A, left, Representative digitized Western blotting images for HIF1a (103 kDa) and PCNA (40 kDa) in hippocampal nuclear protein fractions from control (n = 4) and IH10 (n = 4). Right, Quantification of HIF1a protein normalized to PCNA revealed that nuclear HIF1a was increased in IH10 when compared with control (p = 0.019). B, Total latency to exit the Barnes maze during three training sessions in control (n = 10) and in IH10 (n = 11). Each blue (control) and red (IH10) line represents an individual performance during training. Training to the exit was conducted over three sessions. Each session was separated by 24 hours. C, Left, During the probe trial, the distance traveled to initially enter the exit zone was shorter in control when compared with IH10 (p = 0.048). Right, Latency to initial entry was smaller in control as well (p = 0.034). D, Heat maps of the mean entry probability across all false exits (1–19) and the exit zone during probe trial for the control and IH10. Comparison of entry probability into the exit zone during the probe trial reveals that control has a greater probability for entering the exit zone when compared with IH10 (p = 0.004). E, Left, Representative digitized Western blotting images HIF1a and PCNA in hippocampal nuclear protein fractions from 0-HIF1a+/− (n = 4) and 10-HIF1a+/− (n = 4). Right, Quantification of HIF1a protein normalized to PCNA revealed that nuclear HIF1a is similar between 0-HIF1a+/− and 10-HIF1a+/− (p = 0.84). F, Total latency to exit the Barnes maze during three training sessions in 0-HIF1a+/− (n = 7) and in 10-HIF1a+/− (n = 8). Each gray (0-HIF1a+/−) and yellow (10-HIF1a+/−) line represents an individual performance during training. All experimental groups exhibit decreased total latency over the course of training. G, Left, In HIF1a+/−, the distance initial to initial entry into the exit zone was sim
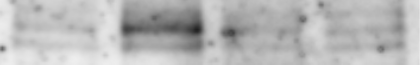
Detection of Human HIF-1 alpha by Western Blot
The DU145FP cells express higher levels of cancer stemness related genes. (A) Transcriptome analyses of prostate cancer stemness-related markers. The Log2 transformed ratio of FPKM values (e.g., FP/WT) are indicated by color-coded index bars. (B) Cells were stained with fluorophore conjugated monoclonal antibodies against CD44 and EPCAM, the antibody against integrin alpha 2 beta 3 without fluorophore conjugation was detected by using secondary antibody conjugated with fluorophore, and stained cells were analyzed by flow cytometry. The scatter plots and histograms show representative results. CTRL denote cell stained with isotype control antibody or only secondary antibody; ST denote cell stained with antibody against EPCAM and integrin alpha 2 beta 3; US denote unstained cells. (C) Immunoblotting confirmation of the protein expression of A-tubulin, GAPDH, SOX9, SLUG, HIF1A, HIF2A, CD44 and integrin alpha 2 beta 3. Image collected and cropped by CiteAb from the following publication (https://pubmed.ncbi.nlm.nih.gov/28698547), licensed under a CC-BY license. Not internally tested by R&D Systems.
Detection of Mouse HIF-1 alpha by Simple Western
Ten days of IH increases hippocampal HIF1a and disrupts Barnes maze performance in wild-type mice but not in HIF1a+/−. A, left, Representative digitized Western blotting images for HIF1a (103 kDa) and PCNA (40 kDa) in hippocampal nuclear protein fractions from control (n = 4) and IH10 (n = 4). Right, Quantification of HIF1a protein normalized to PCNA revealed that nuclear HIF1a was increased in IH10 when compared with control (p = 0.019). B, Total latency to exit the Barnes maze during three training sessions in control (n = 10) and in IH10 (n = 11). Each blue (control) and red (IH10) line represents an individual performance during training. Training to the exit was conducted over three sessions. Each session was separated by 24 hours. C, Left, During the probe trial, the distance traveled to initially enter the exit zone was shorter in control when compared with IH10 (p = 0.048). Right, Latency to initial entry was smaller in control as well (p = 0.034). D, Heat maps of the mean entry probability across all false exits (1–19) and the exit zone during probe trial for the control and IH10. Comparison of entry probability into the exit zone during the probe trial reveals that control has a greater probability for entering the exit zone when compared with IH10 (p = 0.004). E, Left, Representative digitized Western blotting images HIF1a and PCNA in hippocampal nuclear protein fractions from 0-HIF1a+/− (n = 4) and 10-HIF1a+/− (n = 4). Right, Quantification of HIF1a protein normalized to PCNA revealed that nuclear HIF1a is similar between 0-HIF1a+/− and 10-HIF1a+/− (p = 0.84). F, Total latency to exit the Barnes maze during three training sessions in 0-HIF1a+/− (n = 7) and in 10-HIF1a+/− (n = 8). Each gray (0-HIF1a+/−) and yellow (10-HIF1a+/−) line represents an individual performance during training. All experimental groups exhibit decreased total latency over the course of training. G, Left, In HIF1a+/−, the distance initial to initial entry into the exit zone was sim
Detection of Human HIF-1 alpha/HIF1A by Immunocytochemistry/ Immunofluorescence
Staining of HIF1A in HIF1A KO and WT HUVECs. (a–d) One representative image of the stained HIF1A KO and WT HUVECs, which were stained with Hoechst (blue), anti-actin (green), and anti-HIF1A (red). (a) WT HUVECs cultured in normoxic conditions. (b) WT HUVECs cultured in hypoxic conditions. (c) HIF1A KO HUVECs cultured in normoxic conditions. (d) HIF1A KO HUVECs cultured in hypoxic conditions. (e) Quantification of the HIF1A signal intensity (MFI) in the nucleus and the cytoplasm in WT and KO HUVECs in normoxic and hypoxic conditions, which is compared by two-way ANOVA multiple comparisons test, *** p ≤ 0.001. The experiment was performed with one biological replicate at p. 3 (n = 3) and five images were taken per well. Scale bar 10 µm. Image collected and cropped by CiteAb from the following open publication (https://pubmed.ncbi.nlm.nih.gov/36671408), licensed under a CC-BY license. Not internally tested by R&D Systems.
Detection of Human HIF-1 alpha/HIF1A by Immunocytochemistry/ Immunofluorescence
Staining of HIF1A in HIF1A KO and WT HUVECs. (a–d) One representative image of the stained HIF1A KO and WT HUVECs, which were stained with Hoechst (blue), anti-actin (green), and anti-HIF1A (red). (a) WT HUVECs cultured in normoxic conditions. (b) WT HUVECs cultured in hypoxic conditions. (c) HIF1A KO HUVECs cultured in normoxic conditions. (d) HIF1A KO HUVECs cultured in hypoxic conditions. (e) Quantification of the HIF1A signal intensity (MFI) in the nucleus and the cytoplasm in WT and KO HUVECs in normoxic and hypoxic conditions, which is compared by two-way ANOVA multiple comparisons test, *** p ≤ 0.001. The experiment was performed with one biological replicate at p. 3 (n = 3) and five images were taken per well. Scale bar 10 µm. Image collected and cropped by CiteAb from the following open publication (https://pubmed.ncbi.nlm.nih.gov/36671408), licensed under a CC-BY license. Not internally tested by R&D Systems.Applications for HIF-1 alpha/HIF1A Antibody
Application
Recommended Usage
Chromatin Immunoprecipitation (ChIP)
5 µg/5 x 106 cells
Sample: CoCl2 treated mouse primary kidney cells chromatin, epo promoter detected by standard PCR.
Sample: CoCl2 treated mouse primary kidney cells chromatin, epo promoter detected by standard PCR.
Immunocytochemistry
0.3-15 µg/mL
Sample: Immersion fixed HeLa human cervical epithelial carcinoma cell line treated with DFO
Sample: Immersion fixed HeLa human cervical epithelial carcinoma cell line treated with DFO
Immunoprecipitation
2 µg/500 µg cell lysate
Sample: MCF‑7 human breast cancer cell line treated with CoCl2, see our available Western blot detection antibodies
Sample: MCF‑7 human breast cancer cell line treated with CoCl2, see our available Western blot detection antibodies
Knockout Validated
HIF-1 alpha /HIF1A is specifically detected in HeLa human cervical epithelial carcinoma cell line but is not detectable in HIF-1 alpha/HIF1A knockout HeLa cell line.
Simple Western
5 µg/mL
Sample: A549 human lung carcinoma cell line treated with Hypoxia (1% O2),
Sample: A549 human lung carcinoma cell line treated with Hypoxia (1% O2),
Western Blot
0.5 µg/mL
Sample: CoCl2-treated MCF‑7 human breast cancer cell line
Sample: CoCl2-treated MCF‑7 human breast cancer cell line
Reviewed Applications
Read 3 reviews rated 4 using AF1935 in the following applications:
Formulation, Preparation, and Storage
Purification
Antigen Affinity-purified
Reconstitution
Reconstitute at 0.2 mg/mL in sterile PBS. For liquid material, refer to CoA for concentration.
Loading...
Formulation
Lyophilized from a 0.2 μm filtered solution in PBS with Trehalose. *Small pack size (SP) is supplied either lyophilized or as a 0.2 µm filtered solution in PBS.
Shipping
Lyophilized product is shipped at ambient temperature. Liquid small pack size (-SP) is shipped with polar packs. Upon receipt, store immediately at the temperature recommended below.
Stability & Storage
Use a manual defrost freezer and avoid repeated freeze-thaw cycles.
- 12 months from date of receipt, -20 to -70 °C as supplied.
- 1 month, 2 to 8 °C under sterile conditions after reconstitution.
- 6 months, -20 to -70 °C under sterile conditions after reconstitution.
Calculators
Background: HIF-1 alpha/HIF1A
Long Name
Hypoxia Inducible Factor 1 Subunit Alpha
Alternate Names
BHLHE78, HIF 1A, HIF-1a, HIF1 alpha, HIF1A, MOP1, PASD8
Gene Symbol
HIF1A
UniProt
Additional HIF-1 alpha/HIF1A Products
Product Documents for HIF-1 alpha/HIF1A Antibody
Certificate of Analysis
To download a Certificate of Analysis, please enter a lot or batch number in the search box below.
Note: Certificate of Analysis not available for kit components.
Product Specific Notices for HIF-1 alpha/HIF1A Antibody
For research use only
Citations for HIF-1 alpha/HIF1A Antibody
 Powered by Bioz
Customer Reviews for HIF-1 alpha/HIF1A Antibody (3)
4 out of 5
3 Customer Ratings
Have you used HIF-1 alpha/HIF1A Antibody?
Submit a review and receive an Amazon gift card!
$25/€18/£15/$25CAN/¥2500 Yen for a review with an image
$10/€7/£6/$10CAN/¥1110 Yen for a review without an image
Submit a review
Customer Images
Showing
1
-
3 of
3 reviews
Showing All
Filter By:
-
Sample Tested: HASMC human aortic smooth muscle cellsSpecies: HumanVerified Customer | Posted 12/04/2019I have tried HIF1A antibodies from several companies, this one is good compared to others, but sometimes there are multiple bands. 1:500

-
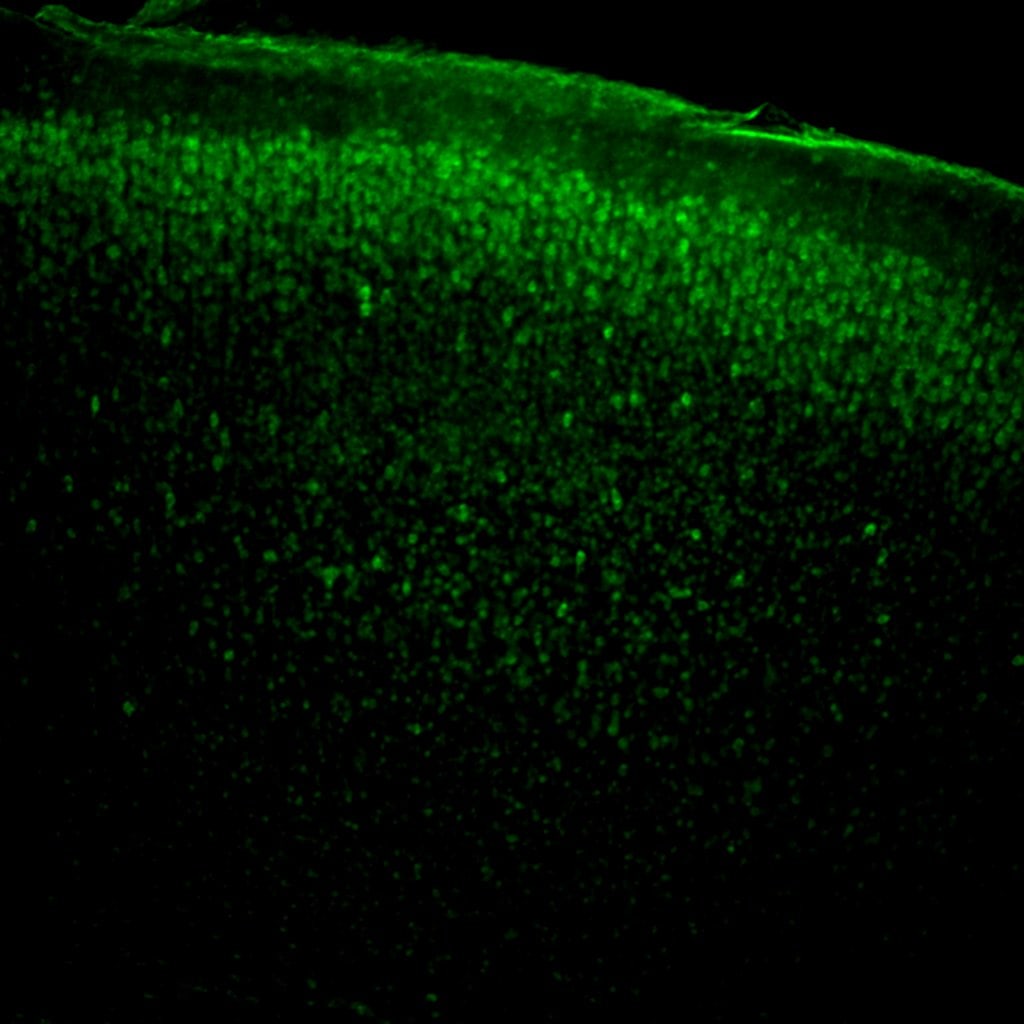
Application: ImmunohistochemistrySample Tested: PFA fixed P12 mouse brain Cortex-80µm vibratome and 80µm vibratome sections of P12 mouse brain cortexSpecies: mouse brain Tissue and MouseVerified Customer | Posted 10/29/2018HIF1a stained brain section -Biotin-streptavidin as secondary- the secondary antibody signal was amplified using Perkin Elmer amplification kit. The P12 section shows upper layer of neurons as Hif1a positivePerkin Elmer, antigen-antibody signal amplification Kit. Immunohistochemistry, vibratome sections of 80µm of PFA fixed P12 mouse brain cortex. Can also be used for Frozen PFA fixed sections
-
Application: Western BlotSample Tested: See PMIC 23918831Species: MouseVerified Customer | Posted 01/05/2015
There are no reviews that match your criteria.
Protocols
Find general support by application which include: protocols, troubleshooting, illustrated assays, videos and webinars.
- Appropriate Fixation of IHC/ICC Samples
- Cellular Response to Hypoxia Protocols
- ChIP Protocol Video
- Chromatin Immunoprecipitation (ChIP) Protocol
- Chromatin Immunoprecipitation Protocol
- ClariTSA™ Fluorophore Kits
- Detection & Visualization of Antibody Binding
- ICC Cell Smear Protocol for Suspension Cells
- ICC Immunocytochemistry Protocol Videos
- ICC for Adherent Cells
- Immunocytochemistry (ICC) Protocol
- Immunocytochemistry Troubleshooting
- Immunofluorescence of Organoids Embedded in Cultrex Basement Membrane Extract
- Immunohistochemistry (IHC) and Immunocytochemistry (ICC) Protocols
- Immunoprecipitation Protocol
- Preparing Samples for IHC/ICC Experiments
- Preventing Non-Specific Staining (Non-Specific Binding)
- Primary Antibody Selection & Optimization
- Protocol for VisUCyte™ HRP Polymer Detection Reagent
- Protocol for the Fluorescent ICC Staining of Cell Smears - Graphic
- Protocol for the Fluorescent ICC Staining of Cultured Cells on Coverslips - Graphic
- Protocol for the Preparation and Fluorescent ICC Staining of Cells on Coverslips
- Protocol for the Preparation and Fluorescent ICC Staining of Non-adherent Cells
- Protocol for the Preparation and Fluorescent ICC Staining of Stem Cells on Coverslips
- Protocol for the Preparation of a Cell Smear for Non-adherent Cell ICC - Graphic
- R&D Systems Quality Control Western Blot Protocol
- TUNEL and Active Caspase-3 Detection by IHC/ICC Protocol
- The Importance of IHC/ICC Controls
- Troubleshooting Guide: Western Blot Figures
- Western Blot Conditions
- Western Blot Protocol
- Western Blot Protocol for Cell Lysates
- Western Blot Troubleshooting
- Western Blot Troubleshooting Guide
- View all Protocols, Troubleshooting, Illustrated assays and Webinars
Loading...
Associated Pathways


