The neurotrophins, including NGF, BDNF, NT-3, and NT-4/5, constitute a group of structurally related, secreted proteins that play an important role in the development and function of the nervous system. The biological activities of the neurotrophins are mediated by binding to and activating two unrelated receptor types: the p75 neurotrophin receptor (p75NTR) and the Trk family of receptor tyrosine kinases (1, 2). p75NTR is a member of the tumor necrosis factor receptor superfamily (TNFRSF) and has been designated TNFRSF16. It binds all neurotrophins with low affinity to transduce cellular signaling pathways that synergize with or antagonize those activated by the Trk receptors. Three Trk family proteins, TrkA, TrkB, and TrkC, exhibiting different ligand specificities, have been identified. TrkA binds NGF and NT-3, TrkB binds BDNF, NT-3, and NT-4/5, and TrkC only binds NT-3 (1-2). All Trk family proteins share a conserved, complex subdomain organization consisting of a signal peptide, two cysteine-rich domains, a cluster of three leucine-rich motifs, and two immunoglobulin-like domains in the extracellular region, as well as an intracellular region that contains the tyrosine kinase domain (3). Natural splice variants of the different Trks, lacking the first cysteine-rich domain, the first and second or all three of the leucine-rich motifs, or the tyrosine kinase domain, have been described (4). At the protein sequence level, human and mouse TrkB show 94% amino acid sequence identity (5-6). The proteins also exhibit cross-species activity. The primary location of TrkB expression is in the central and peripheral nervous systems. Low level TrkB expression has also been observed in a wide variety of tissues outside the nervous system (6).

Key Product Details
Species Reactivity
Validated:
Human, Mouse, Rat
Cited:
Human, Mouse, Rat, Avian - Chicken, Primate, Primate - Callithrix jacchus (Common Marmoset), Transgenic Mouse
Applications
Validated:
Immunohistochemistry, Western Blot, Blockade of Receptor-ligand Interaction, Simple Western
Cited:
Immunohistochemistry, Immunohistochemistry-Paraffin, Immunohistochemistry-Frozen, Western Blot, Neutralization, Flow Cytometry, Immunocytochemistry, Immunoprecipitation, Bioassay, ELISA Capture, ELISA Development (Capture), Proximity Ligation Assay, IHC fixed frozen, IHC-F
Label
Unconjugated
Antibody Source
Polyclonal Goat IgG
Loading...
Product Specifications
Immunogen
Mouse myeloma cell line NS0-derived recombinant mouse TrkB
Cys32-His429
Accession # P15209
Cys32-His429
Accession # P15209
Specificity
Detects mouse TrkB in direct ELISAs. Detects human, mouse, and rat TrkB in Western blots.
Clonality
Polyclonal
Host
Goat
Isotype
IgG
Endotoxin Level
<0.10 EU per 1 μg of the antibody by the LAL method.
Scientific Data Images for TrkB Antibody
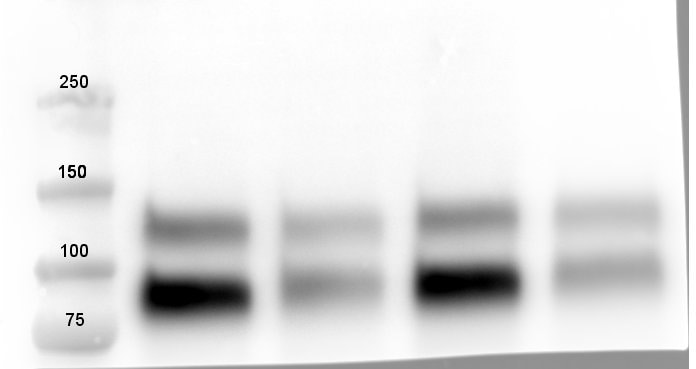
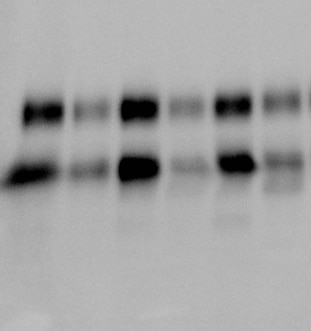
Detection of Human, Mouse, and Rat TrkB by Western Blot.
Western blot shows lysates of human brain (motor cortex) tissue, mouse brain (cortex) tissue, and rat brain (hippocampus) tissue. PVDF membrane was probed with 0.1 µg/mL of Goat Anti-Human/Mouse/Rat TrkB Antigen Affinity-purified Polyclonal Antibody (Catalog # AF1494) followed by HRP-conjugated Anti-Goat IgG Secondary Antibody (HAF017). Specific bands were detected for TrkB at approximately 95 kDa and 145 kDa (as indicated). This experiment was conducted under reducing conditions and using Immunoblot Buffer Group 1.
Detection of Mouse TrkB by Western Blot.
Western blot shows lysates of mouse brain (cerebellum) tissue and mouse brain (cortex) tissue. PVDF membrane was probed with 0.5 µg/mL of Goat Anti-Human/Mouse/Rat TrkB Antigen Affinity-purified Polyclonal Antibody (Catalog # AF1494) followed by HRP-conjugated Anti-Goat IgG Secondary Antibody (HAF017). Specific bands were detected for TrkB at approximately 90-100 and 140 kDa (as indicated). This experiment was conducted under reducing conditions and using Immunoblot Buffer Group 1.
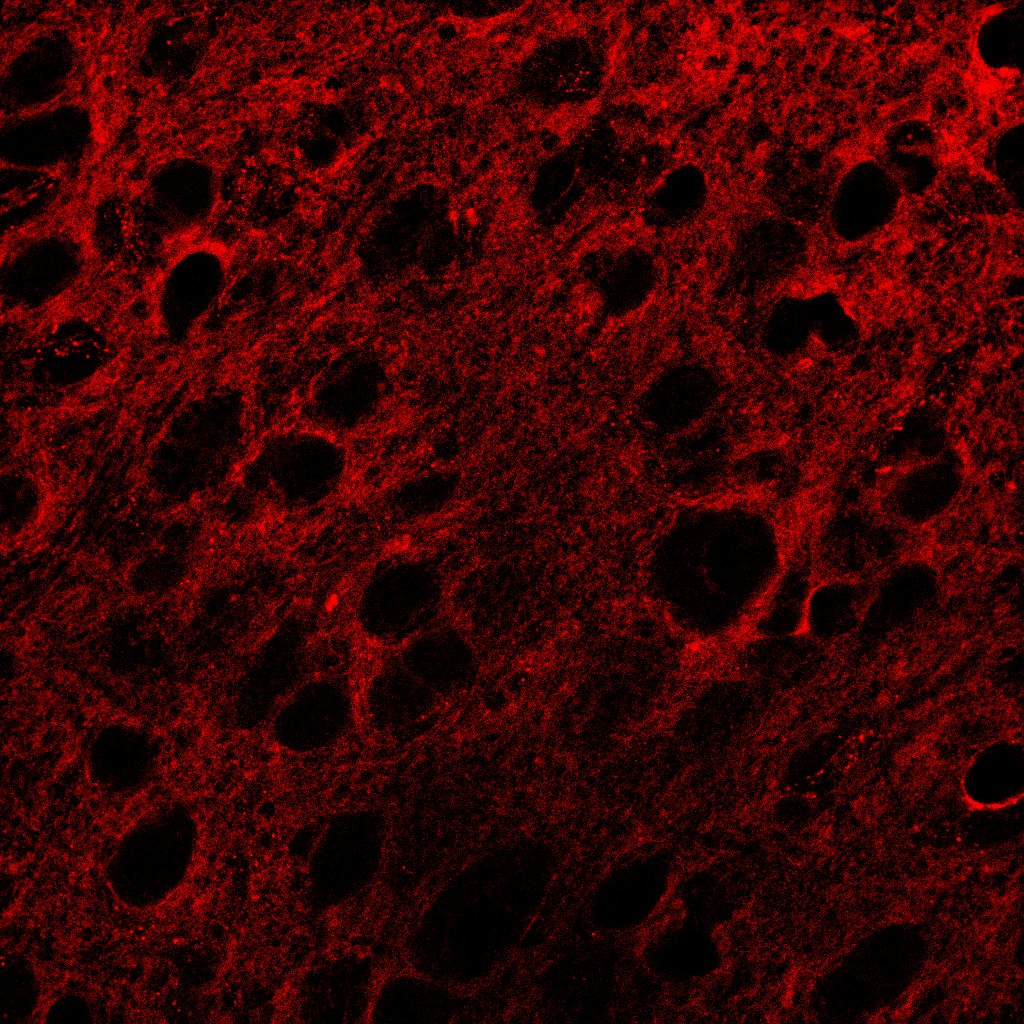
TrkB in Mouse Spinal Cord.
TrkB was detected in perfusion fixed frozen sections of mouse spinal cord using Goat Anti-Human/Mouse/Rat TrkB Antigen Affinity-purified Polyclonal Antibody (Catalog # AF1494) at 1.7 µg/mL overnight at 4 °C. Tissue was stained using the NorthernLights™ 557-conjugated Anti-Goat IgG Secondary Antibody (red; NL001) and counterstained with DAPI (blue). Specific staining was localized to neuronal processes and cell bodies. View our protocol for Fluorescent IHC Staining of Frozen Tissue Sections.
Detection of Mouse TrkB by Simple WesternTM.
Simple Western lane view shows lysates of mouse brain (cortex) tissue, loaded at 0.2 mg/mL. A specific band was detected for TrkB at approximately 154 kDa (as indicated) using 10 µg/mL of Goat Anti-Human/Mouse/Rat TrkB Antigen Affinity-purified Polyclonal Antibody (Catalog # AF1494) followed by 1:50 dilution of HRP-conjugated Anti-Goat IgG Secondary Antibody (HAF109). This experiment was conducted under reducing conditions and using the 12-230 kDa separation system.
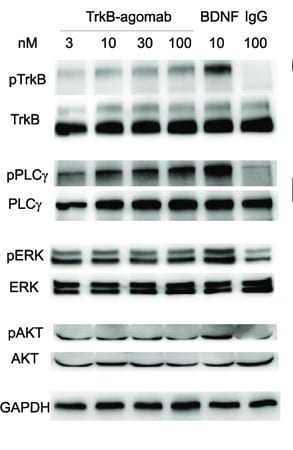
Detection of TrkB by Western Blot
Expression profile of neurotrophic factors and receptors 7 days post surgery.Seven days post surgery, injured (R) and intact (L) sides of C5–C7 segments were collected separately for Western blot with anti- TrkB, p75, BDNF, NT-3 and GDNF antibodies in control (Ctrl) and Celsr3|Emx1 (Mut) mice, and beta -tubulin was used as a control protein (A). The expression level of each protein was normalized to beta -tubulin (B). Comparisons were summarized in C. In control mices, the expression of TrkB and BDNF was significantly decreased, but that of p75 was significantly increased, on injured sides (R) compared to intact sides (L). There was not significant difference in expression of neurotrophic factors and receptors between injured and intact sides in mutant mice. On both sides, the expression level of p75 was significantly lower in the mutant than in the control. On injured sides, the expression of TrkB and BDNF was significantly higher in the mutant than in the control although their expression was comparable on intact sides between two groups. “↓”, lower or decreased expression; “↑”, higher or increased expression; “_”, no significant difference; *, P<0.05; **, P<0.01; Ctrl-L, left side of control mice; Ctrl-R, right side of control mice; Mut-L, left side of mutant mice; Mut-R, right side of mutant mice. Six animals were used in each group and t-test was used for comparisons. Image collected and cropped by CiteAb from the following open publication (https://pubmed.ncbi.nlm.nih.gov/25003601), licensed under a CC-BY license. Not internally tested by R&D Systems.
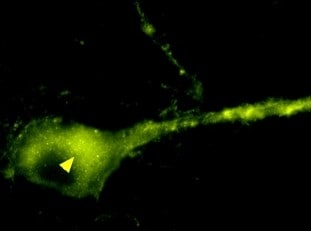
Detection of Mouse TrkB by Immunohistochemistry
Normal developmental Trk expression dynamics in the trigeminal ganglion and maxillary nerve.(A–C) Representative images of fluorescent immunohistochemistry on serial horizontal sections showing TrkA (A, green), TrkB (B, green), or TrkC (C, green) with Isl1 (A–C, purple) in Control embryos at embryonic day 11 (E11). Arrows point to the maxillary nerve (MxV). (D and E) Representative maximum intensity projections of confocal Z-stacks through the Control maxillary process at E11.5 after whole-mount immunohistochemistry to detect Tubb3 (D, white) and TrkA (E, white), followed by tissue clearing. (F–K) Representative images of fluorescent immunohistochemistry on serial horizontal sections showing TrkA (F and I, green), TrkB (G and J, green), or TrkC (H and K, green) in Control embryos at E11.5 (F–H) and E12.5 (I–K). Scale bars: 50 µm (A), applies to (B and C); 100 µm (D), applies to (E); 100 µm (F), applies to (G and K). Image collected and cropped by CiteAb from the following open publication (https://pubmed.ncbi.nlm.nih.gov/35713404), licensed under a CC-BY license. Not internally tested by R&D Systems.
Detection of TrkB by Western Blot
TrkB protein expression in DRG is decreased following SCI. A, Histogram shows that TrkB expression in DRGs are significantly decreased 5–7 d after SCI (open circles) compared with uninjured condition (black-filled circles; *p = 0.0469). B, Representative Western blot images are shown for TrkB 95 expression in the thoracic DRGs from uninjured and SCI animals (TrkB145 was not observed). C, Double immunofluorescence demonstrates TrkB expression (red fluorescence) in NeuN-positive neuron (green fluorescence; merged, yellow fluorescence). Scale bars represent 50 μm. Differential pattern of colocalization (indicated by arrowheads) of TrkB and NeuN shows a potentially altered expression of cell-surface TrkB in uninjured (left) versus SCI (right) small-diameter DRG neurons. Image collected and cropped by CiteAb from the following open publication (https://pubmed.ncbi.nlm.nih.gov/39753357), licensed under a CC-BY license. Not internally tested by R&D Systems.
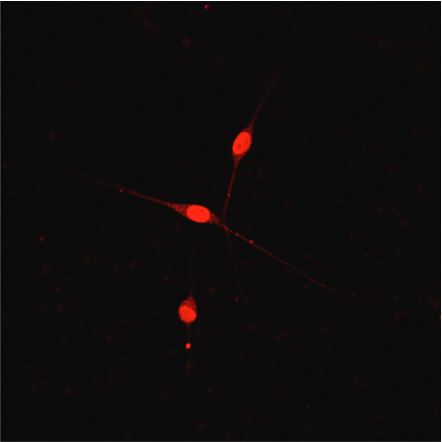
Detection of TrkB by Immunocytochemistry/ Immunofluorescence
TrkB protein expression in DRG is decreased following SCI. A, Histogram shows that TrkB expression in DRGs are significantly decreased 5–7 d after SCI (open circles) compared with uninjured condition (black-filled circles; *p = 0.0469). B, Representative Western blot images are shown for TrkB 95 expression in the thoracic DRGs from uninjured and SCI animals (TrkB145 was not observed). C, Double immunofluorescence demonstrates TrkB expression (red fluorescence) in NeuN-positive neuron (green fluorescence; merged, yellow fluorescence). Scale bars represent 50 μm. Differential pattern of colocalization (indicated by arrowheads) of TrkB and NeuN shows a potentially altered expression of cell-surface TrkB in uninjured (left) versus SCI (right) small-diameter DRG neurons. Image collected and cropped by CiteAb from the following open publication (https://pubmed.ncbi.nlm.nih.gov/39753357), licensed under a CC-BY license. Not internally tested by R&D Systems.Applications for TrkB Antibody
Application
Recommended Usage
Blockade of Receptor-ligand Interaction
In a functional ELISA, 0.5-2 µg/mL of this antibody will block 50% of the binding of 5 ng/mL of biotinylated recombinant Human BDNF to immobilized Recombinant Mouse TrkB (Catalog # 1494-TB) coated at 2 µg/mL (100 µL/well). At 50 μg/mL, this antibody will block >90% of the binding.
Immunohistochemistry
5-15 µg/mL
Sample: Perfusion fixed frozen sections of mouse brain and spinal cord
Sample: Perfusion fixed frozen sections of mouse brain and spinal cord
Simple Western
10 µg/mL
Sample: Mouse brain (cortex) tissue
Sample: Mouse brain (cortex) tissue
Western Blot
0.1-0.5 µg/mL
Sample: Human brain (motor cortex) tissue, Mouse brain (cortex) tissue, Rat brain (hippocampus) tissue, and Mouse brain (cerebellum) tissue
Sample: Human brain (motor cortex) tissue, Mouse brain (cortex) tissue, Rat brain (hippocampus) tissue, and Mouse brain (cerebellum) tissue
Reviewed Applications
Read 17 reviews rated 4.6 using AF1494 in the following applications:
Formulation, Preparation, and Storage
Purification
Antigen Affinity-purified
Reconstitution
Reconstitute at 0.2 mg/mL in sterile PBS. For liquid material, refer to CoA for concentration.
Loading...
Formulation
Lyophilized from a 0.2 μm filtered solution in PBS with Trehalose. *Small pack size (SP) is supplied either lyophilized or as a 0.2 µm filtered solution in PBS.
Shipping
Lyophilized product is shipped at ambient temperature. Liquid small pack size (-SP) is shipped with polar packs. Upon receipt, store immediately at the temperature recommended below.
Stability & Storage
Use a manual defrost freezer and avoid repeated freeze-thaw cycles.
- 12 months from date of receipt, -20 to -70 °C as supplied.
- 1 month, 2 to 8 °C under sterile conditions after reconstitution.
- 6 months, -20 to -70 °C under sterile conditions after reconstitution.
Calculators
Background: TrkB
References
- Huang, E.J. and L.F. Reichardt (2003) Annu. Rev. Biochem. 72:609.
- Dechant, G. (2001) Cell Tissue Res. 305:229.
- Schneider, R. and M. Schweiger (1991) Oncogene 6:1807.
- Ninkina, N. et al. (1997) J. Biol. Chem. 272:13019.
- Nakagawara A. et al. (1995) Genomics. 25:538.
- Klein, R. et al. (1989) EMBO J. 8:3701.
Long Name
Neurotrophic Tyrosine Kinase Receptor B
Alternate Names
NTRK2
Gene Symbol
NTRK2
UniProt
Additional TrkB Products
Product Documents for TrkB Antibody
Certificate of Analysis
To download a Certificate of Analysis, please enter a lot or batch number in the search box below.
Note: Certificate of Analysis not available for kit components.
Product Specific Notices for TrkB Antibody
For research use only
Citations for TrkB Antibody
 Powered by Bioz
Customer Reviews for TrkB Antibody (17)
4.6 out of 5
17 Customer Ratings
Have you used TrkB Antibody?
Submit a review and receive an Amazon gift card!
$25/€18/£15/$25CAN/¥2500 Yen for a review with an image
$10/€7/£6/$10CAN/¥1110 Yen for a review without an image
Submit a review
Customer Images
Showing
1
-
5 of
17 reviews
Showing All
Filter By:
-
Application: Immunocytochemistry/ImmunofluorescenceSample Tested: Hippocampal neuronsSpecies: MouseVerified Customer | Posted 07/15/2021

-
Application: Western BlotSample Tested: Brain (hypothalamus) tissueSpecies: MouseVerified Customer | Posted 05/03/2021
-
Application: Immunocytochemistry/ImmunofluorescenceSample Tested: E12 DRG neuronsSpecies: MouseVerified Customer | Posted 11/22/2019E12 mouse DRG neurons grown overnight with 10ng/ml NGF, then fixed in 4% PFA, blocked for 1 h with 5% BSA, and incubated overnight in 1% BSA containing AF1494 (1:300). A fluorophore-conjugated secondary antibody was used to visualise reactivity.
-
Application: Western BlotSample Tested: Brain (cortex) tissueSpecies: MouseVerified Customer | Posted 04/04/2019
-
Application: ImmunohistochemistrySample Tested: Brain (cortex) tissue and Adult brain (hippocampus)Species: MouseVerified Customer | Posted 09/12/2016
-
Application: Western BlotSample Tested: See PMID 23516305Species: MouseVerified Customer | Posted 01/05/2015
-
Application: Immunohistochemistry-FrozenSample Tested: See PMID 23224557Species: MouseVerified Customer | Posted 01/05/2015
-
Application: ImmunofluorescenceSample Tested: See PMID 23516305Species: MouseVerified Customer | Posted 01/05/2015
-
Application: ImmunoprecipitationSample Tested: Cultured hippocampal neuronsSpecies: MouseVerified Customer | Posted 12/19/2014
-
Application: Western BlotSample Tested: Cultured hippocampal neuronsSpecies: MouseVerified Customer | Posted 12/19/2014
-
Application: ImmunoprecipitationSample Tested: TrkB from hippocampal neuronsSpecies: MouseVerified Customer | Posted 12/19/2014
-
Application: Immunohistochemistry-FrozenSample Tested: Hippocampal cryosectionsSpecies: MouseVerified Customer | Posted 12/19/2014
-
Application: ImmunocytochemistrySample Tested: Hippocampal neuronsSpecies: MouseVerified Customer | Posted 12/19/2014
-
Application: Western BlotSample Tested: Hippocampus tissuesSpecies: MouseVerified Customer | Posted 12/19/2014WB analysis of TrkB in mouse synaptosomal preparations of mouse hippocampus
-
Application: ImmunoprecipitationSample Tested: Mouse hippocampal neuronsSpecies: MouseVerified Customer | Posted 12/16/2014
-
Application: ImmunocytochemistrySample Tested: mouse hippocampusSpecies: OtherVerified Customer | Posted 12/16/2014
-
Application: Western BlotSample Tested: mouse hippocampusSpecies: OtherVerified Customer | Posted 12/16/2014
There are no reviews that match your criteria.
Protocols
Find general support by application which include: protocols, troubleshooting, illustrated assays, videos and webinars.
- Antigen Retrieval Protocol (PIER)
- Antigen Retrieval for Frozen Sections Protocol
- Appropriate Fixation of IHC/ICC Samples
- Cellular Response to Hypoxia Protocols
- Chromogenic IHC Staining of Formalin-Fixed Paraffin-Embedded (FFPE) Tissue Protocol
- Chromogenic Immunohistochemistry Staining of Frozen Tissue
- ClariTSA™ Fluorophore Kits
- Detection & Visualization of Antibody Binding
- Fluorescent IHC Staining of Frozen Tissue Protocol
- Graphic Protocol for Heat-induced Epitope Retrieval
- Graphic Protocol for the Preparation and Fluorescent IHC Staining of Frozen Tissue Sections
- Graphic Protocol for the Preparation and Fluorescent IHC Staining of Paraffin-embedded Tissue Sections
- Graphic Protocol for the Preparation of Gelatin-coated Slides for Histological Tissue Sections
- IHC Sample Preparation (Frozen sections vs Paraffin)
- Immunofluorescent IHC Staining of Formalin-Fixed Paraffin-Embedded (FFPE) Tissue Protocol
- Immunohistochemistry (IHC) and Immunocytochemistry (ICC) Protocols
- Immunohistochemistry Frozen Troubleshooting
- Immunohistochemistry Paraffin Troubleshooting
- Preparing Samples for IHC/ICC Experiments
- Preventing Non-Specific Staining (Non-Specific Binding)
- Primary Antibody Selection & Optimization
- Protocol for Heat-Induced Epitope Retrieval (HIER)
- Protocol for Making a 4% Formaldehyde Solution in PBS
- Protocol for VisUCyte™ HRP Polymer Detection Reagent
- Protocol for the Preparation & Fixation of Cells on Coverslips
- Protocol for the Preparation and Chromogenic IHC Staining of Frozen Tissue Sections
- Protocol for the Preparation and Chromogenic IHC Staining of Frozen Tissue Sections - Graphic
- Protocol for the Preparation and Chromogenic IHC Staining of Paraffin-embedded Tissue Sections
- Protocol for the Preparation and Chromogenic IHC Staining of Paraffin-embedded Tissue Sections - Graphic
- Protocol for the Preparation and Fluorescent IHC Staining of Frozen Tissue Sections
- Protocol for the Preparation and Fluorescent IHC Staining of Paraffin-embedded Tissue Sections
- Protocol for the Preparation of Gelatin-coated Slides for Histological Tissue Sections
- R&D Systems Quality Control Western Blot Protocol
- TUNEL and Active Caspase-3 Detection by IHC/ICC Protocol
- The Importance of IHC/ICC Controls
- Troubleshooting Guide: Immunohistochemistry
- Troubleshooting Guide: Western Blot Figures
- Western Blot Conditions
- Western Blot Protocol
- Western Blot Protocol for Cell Lysates
- Western Blot Troubleshooting
- Western Blot Troubleshooting Guide
- View all Protocols, Troubleshooting, Illustrated assays and Webinars
Loading...
Associated Pathways

