Human Prox1 Antibody
R&D Systems | Catalog # AF2727

Key Product Details
Validated by
Biological Validation
Species Reactivity
Validated:
Human
Cited:
Human, Mouse, Rat, Porcine, Avian - Chicken, Fish - Danio rerio (Zebrafish), Primate - Callithrix jacchus (Common Marmoset), Transgenic Mouse, Xenograft
Applications
Validated:
Western Blot, Immunocytochemistry, Simple Western
Cited:
Immunohistochemistry, Immunohistochemistry-Paraffin, Immunohistochemistry-Frozen, Western Blot, Flow Cytometry, Immunocytochemistry, Immunocytochemistry/ Immunofluorescence, Simple Western, Immunoprecipitation, Chromatin Immunoprecipitation (ChIP)
Label
Unconjugated
Antibody Source
Polyclonal Goat IgG
Loading...
Product Specifications
Immunogen
E. coli-derived recombinant human Prox1
Pro2-Gln259
Accession # Q92786
Pro2-Gln259
Accession # Q92786
Specificity
Detects human Prox1 in direct ELISAs and Western blots.
Clonality
Polyclonal
Host
Goat
Isotype
IgG
Scientific Data Images for Human Prox1 Antibody
Detection of Human Prox1 by Western Blot.
Western blot shows lysates of HepG2 human hepatocellular carcinoma cell line. PVDF membrane was probed with 1 µg/mL of Goat Anti-Human Prox1 Antigen Affinity-purified Polyclonal Antibody (Catalog # AF2727) followed by HRP-conjugated Anti-Goat IgG Secondary Antibody (Catalog # HAF019). A specific band was detected for Prox1 at approximately 83 kDa (as indicated). This experiment was conducted under reducing conditions and using Immunoblot Buffer Group 1.
Prox1 in HepG2 Human Hepatocellular Carcinoma Cell Line.
Prox1 was detected in immersion fixed HepG2 human hepatocellular carcinoma cell line using Goat Anti-Human Prox1 Antigen Affinity-purified Polyclonal Antibody (Catalog # AF2727) at 15 µg/mL for 3 hours at room temperature. Cells were stained using the NorthernLights™ 557-conjugated Anti-Goat IgG Secondary Antibody (left panel, red; Catalog # NL001) and counterstained with DAPI (right panel, blue). Specific staining was localized to nuclei. View our protocol for Fluorescent ICC Staining of Cells on Coverslips.
Detection of Human Prox1 by Simple WesternTM.
Simple Western lane view shows lysates of HepG2 human hepatocellular carcinoma cell line, loaded at 0.2 mg/mL. A specific band was detected for Prox1 at approximately 114 kDa (as indicated) using 10 µg/mL of Goat Anti-Human Prox1 Antigen Affinity-purified Polyclonal Antibody (Catalog # AF2727) followed by 1:50 dilution of HRP-conjugated Anti-Goat IgG Secondary Antibody (Catalog # HAF109). This experiment was conducted under reducing conditions and using the 12-230 kDa separation system.
Detection of Mouse Prox1 by Western Blot
RNA-seq identifies the targets of GATA2 in primary human LECs. (A) Principal component analysis (PCA) was performed on RNA-seq data from control shRNA- and shGATA2-infected primary HLECs. A high level of similarity was observed within the groups as indicated by their proximity to each other. (B) Hierarchical clustering shows that approximately 1000 genes were consistently downregulated and 600 genes were upregulated in shGATA2-treated HLECs. (C) GO revealed a list of genes that are likely relevant to the phenotypes observed in mice lacking GATA2. (D) GATA2 was knocked out from a second HLEC line using CRISPR/Cas9. Western blot revealed the lack of GATA2 in the knockout cells (HLEC delta GATA2). In contrast, no obvious differences were observed in the expression of PROX1. Additionally, qRT-PCR revealed the downregulation of miR-126. (A) n=3 independent experiments per shRNA; (D) n=3 independent experiments (antibiotic selection, western blot and qRT-PCR). **P<0.01. Image collected and cropped by CiteAb from the following publication (https://pubmed.ncbi.nlm.nih.gov/31582413), licensed under a CC-BY license. Not internally tested by R&D Systems.
Detection of Mouse Prox1 by Western Blot
Prox1 regulates myoblast differentiation.(a) Analysis of Prox1 mRNA and protein during C2C12 myoblast differentiation (indicated by the increase in MyoD1 mRNA). (b) Prox1 protein and mRNA in human myoblasts before and after differentiation. Primary myoblast lines from two different individuals were analysed. (c–f) Analysis of myoblast proliferation and differentiation-related CyclinD1, Myf5 and MyoD mRNAs in shProx1 and shScr transduced primary human myoblasts before (c) and after differentiation for 7d (d), as well as in mouse C2C12 myoblasts before (e) and after (f) differentiation. (g) Myosin staining of C2C12 cells after 7d of differentiation. Note that Prox1 silencing completely blocked myotube development, as only occasional cells expressed myosin and these cells were negative for shProx1-GFP. Data is presented as mean±s.e.m., n=3+3 biological replicates in a–g (all experiments were repeated three times). One-way analysis of variance with repeated measures followed by Tukey's posthoc test and Student's two-tailed unpaired t-test, *P<0.05, **P<0.01, ***P<0.001. Scale bars, 50 μm. Image collected and cropped by CiteAb from the following publication (https://www.nature.com/articles/ncomms13124), licensed under a CC-BY license. Not internally tested by R&D Systems.
Detection of Human Prox1 by Immunocytochemistry/Immunofluorescence
In situ localization of Ptx3-LECs and transition between Ptx3-LECs and Marco-LECs in human LNs. (A) Expression of CD36/Cd36 in LN LEC subsets of human and mouse. Dots indicate mean log-normalized transcript count. (B–D) Identification of CD36high Ptx3-LECs in human head and neck LNs by immunostaining. (B,C) Immunofluorescence of PROX-1, MARCO and CD36 (B), or PROX-1, LYVE-1 and CLEC4M (C). Zoomed-in images (inset marked by blue dotted lines) in (B) and (C) demonstrate CD36high LYVE-1+ paracortical sinuses (filled arrowhead). Scale bars = 500 μm (left panels) and 100 μm (right panel inset). (D) CD36high LYVE-1+ Ptx3-LECs (filled arrowhead) can be seen associated with MARCO+ CLEC4M+ Marco-LECs (empty arrowhead) in human LNs. Scale bars = 100 μm. CD36high Ptx3-LECs were detected in four out of seven human LNs. Images are representative of four biological replicates. Image collected and cropped by CiteAb from the following publication (https://pubmed.ncbi.nlm.nih.gov/32426372), licensed under a CC-BY license. Not internally tested by R&D Systems.
Detection of Mouse Prox1 by Western Blot
Prox1 regulates the slow muscle fibre gene program in skeletal muscle.(a) MyHC I (Myh7) expression in muscle fibres (arrows) in AAV8-Prox1 and AAV8-Ctrl transduced TA muscle. (b) Expression of myosin heavy chain and calcium-signalling genes in AAV8-Prox1 and AAV8-Ctrl transduced TA muscle. Note that the expression of slow fibre -specific genes are upregulated and fast MyHC genes downregulated in Prox1 overexpressing muscles. (c) Heat map from GSEA analysis showing that Prox1 overexpression in TA muscle leads to expression of many soleus specific myofibrillar genes (red colour indicates positive and blue negative enrichment). (d) Effect of Prox1 deletion on soleus muscle gene expression (HSA-CreERT2;Prox1fl/fl mice). Note the increased expression of fast MyHCs Myh2 and Myh4 RNAs, whereas slow troponin isoform RNAs and Myh7 RNA are decreased. (e) Deletion of Prox1 in slow soleus muscle with AAV-Cre leads to marked downregulation of MyHC I protein. Data is presented as mean±s.e.m., n=5+5 in a,b, n=3+3 in c, n=4+4 in d,e. Student's two-tailed unpaired t-test, *P<0.05, **P<0.01, ***P<0.001. Both overexpression and deletion experiments were conducted two times on independent mouse cohorts. WT, wild-type. Scale bars, 50 μm. Image collected and cropped by CiteAb from the following publication (https://www.nature.com/articles/ncomms13124), licensed under a CC-BY license. Not internally tested by R&D Systems.
Detection of Human Prox1 by Immunocytochemistry/Immunofluorescence
In situ localization of Ptx3-LECs and transition between Ptx3-LECs and Marco-LECs in human LNs. (A) Expression of CD36/Cd36 in LN LEC subsets of human and mouse. Dots indicate mean log-normalized transcript count. (B–D) Identification of CD36high Ptx3-LECs in human head and neck LNs by immunostaining. (B,C) Immunofluorescence of PROX-1, MARCO and CD36 (B), or PROX-1, LYVE-1 and CLEC4M (C). Zoomed-in images (inset marked by blue dotted lines) in (B) and (C) demonstrate CD36high LYVE-1+ paracortical sinuses (filled arrowhead). Scale bars = 500 μm (left panels) and 100 μm (right panel inset). (D) CD36high LYVE-1+ Ptx3-LECs (filled arrowhead) can be seen associated with MARCO+ CLEC4M+ Marco-LECs (empty arrowhead) in human LNs. Scale bars = 100 μm. CD36high Ptx3-LECs were detected in four out of seven human LNs. Images are representative of four biological replicates. Image collected and cropped by CiteAb from the following publication (https://pubmed.ncbi.nlm.nih.gov/32426372), licensed under a CC-BY license. Not internally tested by R&D Systems.
Detection of Mouse Prox1 by Immunohistochemistry
TLS formation in models of heart failure, conditional lymphatic-EC deletion of Rbpj or kidney ischemia reperfusion. D PAS staining of representative, paraffin-embedded kidney sections. Quantification of infiltrated area [in mm2] per transversal kidney cross-section (sum of all infiltrated areas per section), N = 8 biological replicates per group, Mann–Whitney test, two-tailed, p = 0.51. Graph: Scatter dot blot, Mean, SD (whiskers). ERbpj delta EC Whole kidney staining for B220 (TLS)&Prox1/Lyve1 for lymphatic collecting vessels, light sheet microscopy, ventral view, 3D reconstruction via IMARIS software; scale bar: left image 1000 µm; insets are magnifications of boxed detail, scale bar 150 µm. Exemplary image, kidneys from N = 3 mice stained. F Induction protocol for lymphatic endothelial-restricted deletion of Rbpj (Rbpj delta LEC). Image collected & cropped by CiteAb from the following open publication (https://pubmed.ncbi.nlm.nih.gov/35440634), licensed under a CC-BY license. Not internally tested by R&D Systems.Applications for Human Prox1 Antibody
Application
Recommended Usage
Immunocytochemistry
5-15 µg/mL
Sample: Immersion fixed HepG2 human hepatocellular carcinoma cell line
Sample: Immersion fixed HepG2 human hepatocellular carcinoma cell line
Simple Western
10 µg/mL
Sample: HepG2 human hepatocellular carcinoma cell line
Sample: HepG2 human hepatocellular carcinoma cell line
Western Blot
1 µg/mL
Sample: HepG2 human hepatocellular carcinoma cell line
Sample: HepG2 human hepatocellular carcinoma cell line
Reviewed Applications
Read 6 reviews rated 4.7 using AF2727 in the following applications:
Formulation, Preparation, and Storage
Purification
Antigen Affinity-purified
Reconstitution
Reconstitute at 0.2 mg/mL in sterile PBS. For liquid material, refer to CoA for concentration.
Loading...
Formulation
Lyophilized from a 0.2 μm filtered solution in PBS with Trehalose. *Small pack size (SP) is supplied either lyophilized or as a 0.2 µm filtered solution in PBS.
Shipping
Lyophilized product is shipped at ambient temperature. Liquid small pack size (-SP) is shipped with polar packs. Upon receipt, store immediately at the temperature recommended below.
Stability & Storage
Use a manual defrost freezer and avoid repeated freeze-thaw cycles.
- 12 months from date of receipt, -20 to -70 °C as supplied.
- 1 month, 2 to 8 °C under sterile conditions after reconstitution.
- 6 months, -20 to -70 °C under sterile conditions after reconstitution.
Calculators
Background: Prox1
Long Name
Prospero-related Homeobox 1
Alternate Names
Homeobox prospero-like protein PROX1, prospero homeobox 1, prospero homeobox protein 1, prospero-related homeobox 1, PROX-1
Entrez Gene IDs
5629 (Human)
Gene Symbol
PROX1
UniProt
Additional Prox1 Products
Product Documents for Human Prox1 Antibody
Certificate of Analysis
To download a Certificate of Analysis, please enter a lot or batch number in the search box below.
Note: Certificate of Analysis not available for kit components.
Product Specific Notices for Human Prox1 Antibody
For research use only
Related Research Areas
Citations for Human Prox1 Antibody
 Powered by Bioz
Customer Reviews for Human Prox1 Antibody (6)
4.7 out of 5
6 Customer Ratings
Have you used Human Prox1 Antibody?
Submit a review and receive an Amazon gift card!
$25/€18/£15/$25CAN/¥2500 Yen for a review with an image
$10/€7/£6/$10CAN/¥1110 Yen for a review without an image
Submit a review
Customer Images
Showing
1
-
5 of
6 reviews
Showing All
Filter By:
-
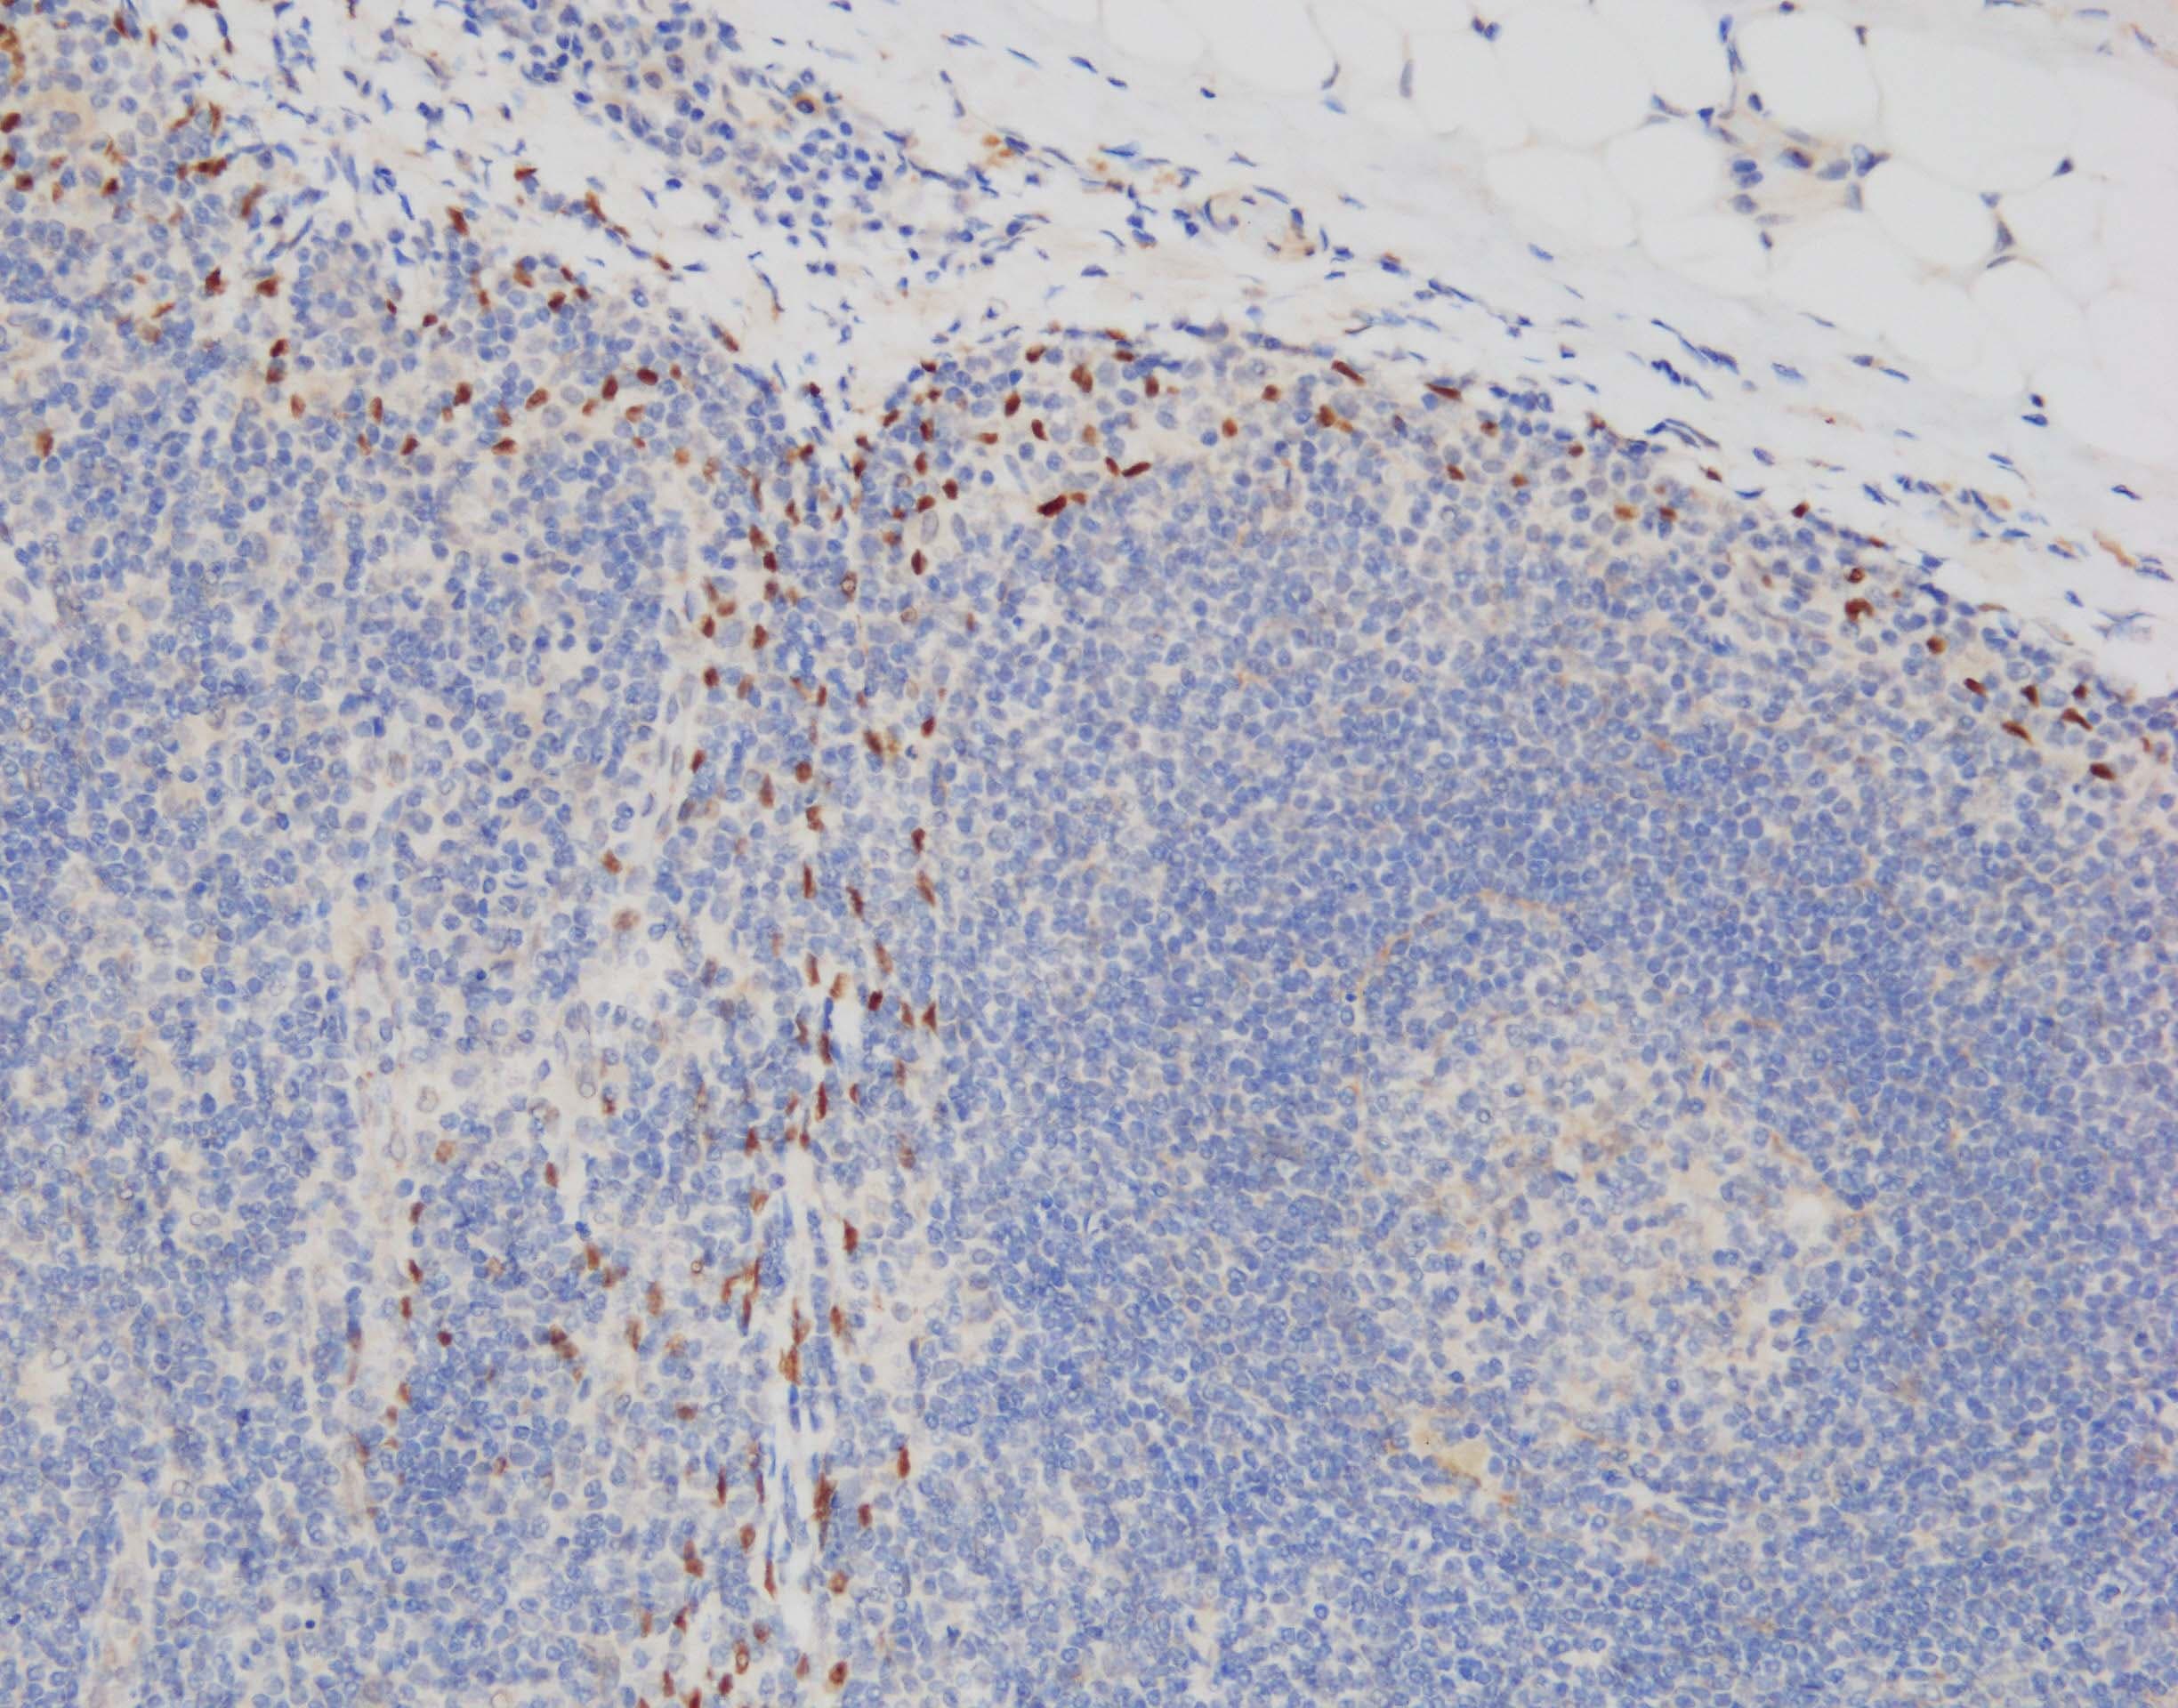
Application: ImmunohistochemistrySample Tested: Lymph node tissueSpecies: HumanVerified Customer | Posted 07/25/2023IHC-P: pH 9 antigen retrieval, primary Ab x50 30min, HRP-polymer detection system + DAB

-
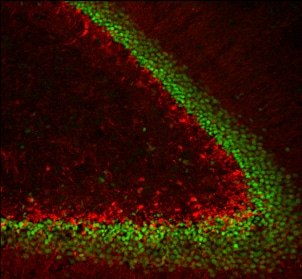
Application: Immunohistochemistry-FrozenSample Tested: brain hippocampus section and Rabbit Brain dentate gyrus sectionSpecies: RabbitVerified Customer | Posted 07/07/2020Rabbit Brain dentate gyrus section with Prox 1+ cells (shown in green color)
-
Application: Immunocytochemistry/ImmunofluorescenceSample Tested: Embryonic kidneySpecies: MouseVerified Customer | Posted 08/10/2017
-
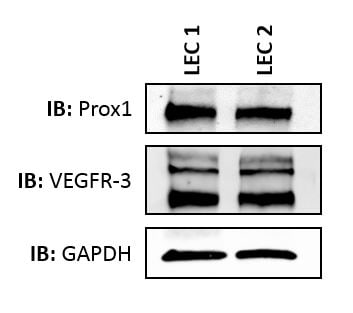
Application: Western BlotSample Tested: primary human lymphatic endothelial cellsSpecies: HumanVerified Customer | Posted 07/13/2015Prox1 expression in human lymphatic endothelial cells
-
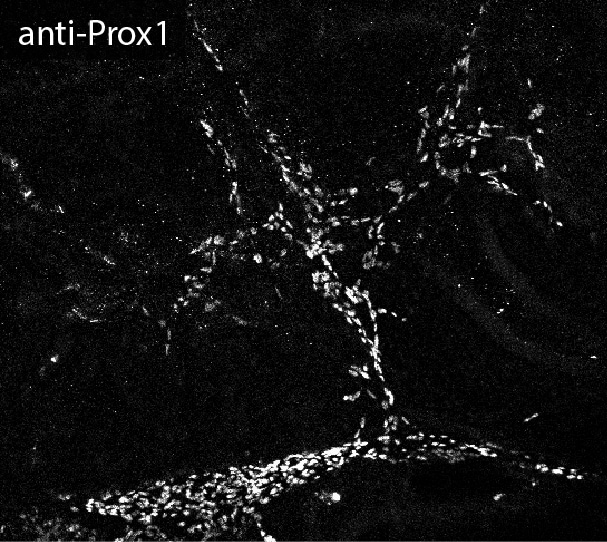
Application: ImmunofluorescenceSample Tested: See PMID 23299940Species: MouseVerified Customer | Posted 01/07/2015
-
Application: Immunohistochemistry-ParaffinSample Tested: See PMID 22115316Species: OtherVerified Customer | Posted 01/07/2015
There are no reviews that match your criteria.
Protocols
Find general support by application which include: protocols, troubleshooting, illustrated assays, videos and webinars.
- Appropriate Fixation of IHC/ICC Samples
- Cellular Response to Hypoxia Protocols
- ClariTSA™ Fluorophore Kits
- Detection & Visualization of Antibody Binding
- ICC Cell Smear Protocol for Suspension Cells
- ICC Immunocytochemistry Protocol Videos
- ICC for Adherent Cells
- Immunocytochemistry (ICC) Protocol
- Immunocytochemistry Troubleshooting
- Immunofluorescence of Organoids Embedded in Cultrex Basement Membrane Extract
- Immunohistochemistry (IHC) and Immunocytochemistry (ICC) Protocols
- Preparing Samples for IHC/ICC Experiments
- Preventing Non-Specific Staining (Non-Specific Binding)
- Primary Antibody Selection & Optimization
- Protocol for VisUCyte™ HRP Polymer Detection Reagent
- Protocol for the Fluorescent ICC Staining of Cell Smears - Graphic
- Protocol for the Fluorescent ICC Staining of Cultured Cells on Coverslips - Graphic
- Protocol for the Preparation and Fluorescent ICC Staining of Cells on Coverslips
- Protocol for the Preparation and Fluorescent ICC Staining of Non-adherent Cells
- Protocol for the Preparation and Fluorescent ICC Staining of Stem Cells on Coverslips
- Protocol for the Preparation of a Cell Smear for Non-adherent Cell ICC - Graphic
- R&D Systems Quality Control Western Blot Protocol
- TUNEL and Active Caspase-3 Detection by IHC/ICC Protocol
- The Importance of IHC/ICC Controls
- Troubleshooting Guide: Western Blot Figures
- Western Blot Conditions
- Western Blot Protocol
- Western Blot Protocol for Cell Lysates
- Western Blot Troubleshooting
- Western Blot Troubleshooting Guide
- View all Protocols, Troubleshooting, Illustrated assays and Webinars
Loading...
Associated Pathways
