
Human SOX21 Antibody
R&D Systems | Catalog # AF3538

Scientific images may be resized, cropped, or adjusted for brightness or contrast for presentation purposes. These updates are limited to presentation and do not affect the underlying scientific interpretation of the data. Where available, additional source data may be provided upon request.
Key Product Details
Species Reactivity
Validated:
Cited:
Applications
Validated:
Cited:
Label
Antibody Source
Product Specifications
Immunogen
Ser2-Leu276 (Gly102Ser)
Accession # Q9Y651
Specificity
Clonality
Host
Isotype
Scientific Data Images for Human SOX21 Antibody
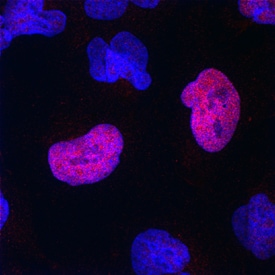
SOX21 in NTera‑2 Human Cell Line.
SOX21 was detected in immersion fixed NTera-2 human testicular embryonic carcinoma cell line using Goat Anti-Human SOX21 Antigen Affinity-purified Polyclonal Antibody (Catalog # AF3538) at 10 µg/mL for 3 hours at room temperature. Cells were stained using the NorthernLights™ 557-conjugated Anti-Goat IgG Secondary Antibody (red; NL001) and counterstained with DAPI (blue). Specific staining was localized to nuclei. View our protocol for Fluorescent ICC Staining of Cells on Coverslips.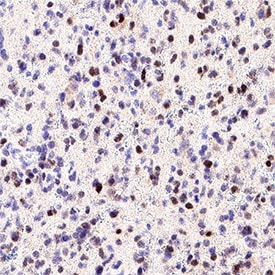
Detection of SOX21 in Human Glioblastoma.
SOX21 was detected in immersion fixed paraffin-embedded sections of human glioblastoma using Goat Anti-Human SOX21 Antigen Affinity-purified Polyclonal Antibody (Catalog # AF3538) at 0.5 µg/ml for 1 hour at room temperature followed by incubation with the HRP-conjugated Anti-Goat IgG Secondary Antibody (Catalog # HAF017) or the Anti-Goat IgG VisUCyte™ HRP Polymer Antibody (Catalog # VC004). Before incubation with the primary antibody, tissue was subjected to heat-induced epitope retrieval using VisUCyte Antigen Retrieval Reagent-Basic (Catalog # VCTS021). Tissue was stained using DAB (brown) and counterstained with hematoxylin (blue). Specific staining was localized to the nucleus. View our protocol for Chromogenic IHC Staining of Paraffin-embedded Tissue Sections.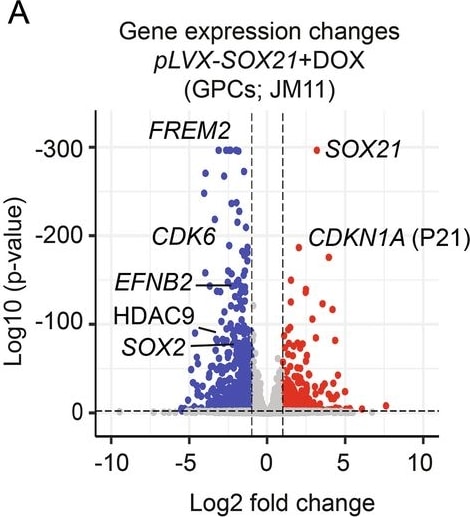
Detection of SOX21 by Flow Cytometry
Transcriptomic impact of SOX21 expression in GPCs.Volcano plots displaying differential gene expression induced by SOX21 in JM11 (A) and JM13 (B) GPCs after 48 hours. Genes significantly upregulated (red) and downregulated (blue) are shown (false discovery rate < 0.01). C Heatmaps show gene sets and associated Gene Ontology (GO) terms deregulated upon SOX21 induction. D, E Enrichment analysis of SOX motifs (black line) and AP-1 motifs (green line) within SOX21 ChIP-seq peaks detected in JM11 (D) and JM13 (E) GPCs, with motif distances to the center of SOX21 peaks measured in base pairs (bp). P-values of best-matching SOX and AP-1 motifs are shown. F Enrichment of transcription factor binding motifs across SOX21 ChIP-seq regions in comparison with non-targeted control chromatin regions. Graphs illustrating the most significant spacing distances between centrally enriched SOX and AP-1 motifs in SOX21 ChIP-seq peaks detected in JM11 (G) and JM13 (H) GPCs. The gap between motifs is based on the spacing between the last nucleotide in the SOX motif and the first nucleotide in AP-1. I, J Co-immunoprecipitation assays showing interactions between FLAG-tagged SOX21 and c-JUN in JM11 and JM13 GPCs treated with DNase I. K Genomic mapping of c-JUN ChIP-seq reads within SOX21 ChIP-seq peak regions detected in JM11 and JM13 GPCs. L, M Genomic regions surrounding CAMK2D (L) and ADRA1D (M) genes, illustrating ChIP-seq binding profiles for c-JUN, SOX21, and SOX2 in JM11 GPCs. Image collected and cropped by CiteAb from the following open publication (https://www.nature.com/articles/s41419-026-08442-5), licensed under a CC-BY license. Not internally tested by R&D Systems.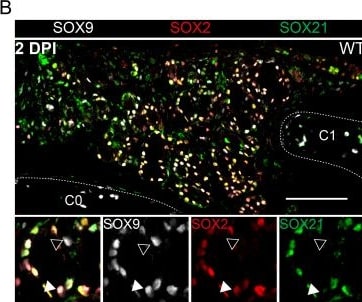
Detection of SOX21 by Immunohistochemistry
Regeneration is delayed in SOX2 deficient tracheal epithelium.(A) Immunofluorescence staining on tracheal sections of wild-type (WT), Sox2+/−, and Sox21+/−, 2 days post injury (2 DPI) of Keratin 5 (KRT, grey), Keratin 8 (KRT8, green), TubilinIV (TUBIV, red). (B) Tracheal section showing Submucosal Glands (SMGs) at 2 DPI of wild-type mice. SOX2 (red) and SOX21 (green) expression is detected in SOX9+ SMG cells. Closed white arrowheads (u) indicate cells only expressing SOX2 and SOX9, open arrowheads (w) indicate cells only expressing SOX9. Scale bar = 100 µm. Scale bar = 100 µm. C = cartilage ring. (C) Immunofluorescence of FOXJ1+ ciliated cells (top row) or TRP63+ KI67+ dividing basal cells (bottom row), 5 DPI in wild-type (WT), Sox2+/− and Sox21+/− mice. Scale bar = 100 µm. Quantification of the number of FOXJ1+-ciliated cells from C0 till C1 between genotypes. One-way ANOVA (WT n=8, Sox2+/− n=8, Sox21+/− n=5, * p<0.05). (D) Immunofluorescence of FOXJ1+ (red) ciliated cells and SCGB1A1+ (yellow) secretory cells(left) or TRP63+ (green) KI67+ (red) dividing basal cells (right), on tracheal sections of corn oil exposed (CO) mice. Scale bar = 100 µm. Quantification of the number of FOXJ1+-ciliated cells, SCGB1A1+ secretory cells TRP63+KI67+-dividing basal cells or TRP63+ basal cells from C0 till C6 between genotypes in corn oil exposed (CO) mice. One-way ANOVA (WT n = 5, Sox2+/− n = 3, Sox21+/− n = 5). Image collected and cropped by CiteAb from the following open publication (https://pubmed.ncbi.nlm.nih.gov/34286693), licensed under a CC-BY license. Not internally tested by R&D Systems.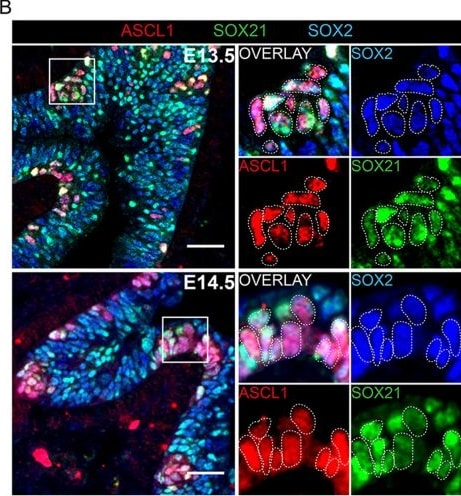
Detection of SOX21 by Immunohistochemistry
Differentiation to NE cells of SOX2 + airway progenitor cells occurs in SOX21 + airway region. A Immunofluorescence staining of ASCL1 (red) and DAPI (blue) at gestational ages E13.5 and E14.5. C = cluster, S = solitary. Scale bar = 50 µm. B Immunofluorescence staining of ASCL1 (red), SOX21 (green) and SOX2 (blue) at gestational age E13.5 and E14.5. Cells positive for ASCL1 are encircled. Scale bar = 25 µm. C Immunofluorescence staining of ASCL1 (red), SOX21 (green) and SOX2 (blue) at gestational age E14.5. In the encircled cells the MFI of ASCL1, SOX21 and SOX2 is shown at that specific region. Scale bar = 25 µm. The graph shows the MFI of ASCL1, SOX21 and SOX2 in ASCL- and ASCL + airway epithelium. Data are represented as mean ± SD. Two-way ANOVA (n = 3, *** p < 0.001). D Immunofluorescence staining of TRP63 (violet), ASCL1 (red), SOX21 (green) and DAPI (blue) at gestational age E14.5. Cells positive for TRP63 are encircled. Scale bar = 25 µm. The graph shows the MFI of TRP63, SOX21 and SOX2 in TRP63- and TRP63 + airway epithelium. Data are represented as mean ± SD. Two-way ANOVA (n = 3, *** p < 0.001) Image collected and cropped by CiteAb from the following open publication (https://pubmed.ncbi.nlm.nih.gov/36867267), licensed under a CC-BY license. Not internally tested by R&D Systems.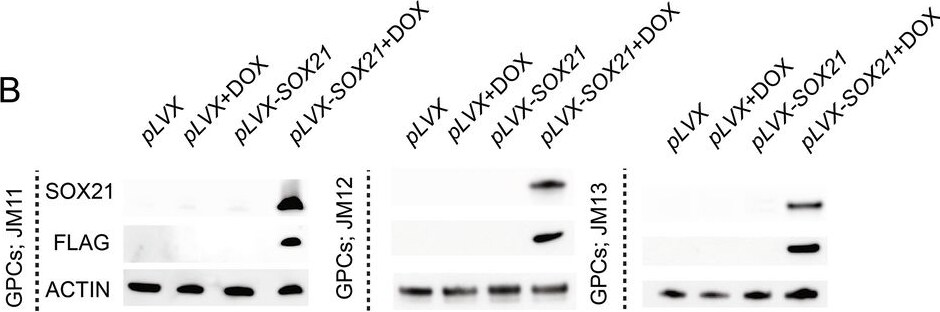
Detection of SOX21 by Western Blot
Effects of Inducible SOX21 Expression on GPC Growth.A Schematic representation of the tetracycline-inducible (Tet-On) SOX21 expression system. rtTA tetracycline-controlled transactivator, TRE tetracycline response element, DOX doxycycline. B Western blot analysis of FLAG-tagged SOX21 expression in GPC lines (JM11, JM12 and JM13) transduced with either control (pLVX) or inducible SOX21 expression vectors (pLVX-SOX21), cultured with or without DOX for 48 h. C Representative images showing reduced cell density in GPC monolayer cultures following DOX-induced SOX21 expression. Scale bar, 70 µm. D Quantification of EdU incorporation in control and SOX21-expressing GPCs (JM11 and JM13). Flow cytometry analysis of JM11 (E) and JM13 (F) GPCs transduced with control (pLVX) or SOX21-inducible (pLVX-SOX21) vectors and cultured with or without DOX for 4 days. Quadrant distributions: Q1 (live cells), Q2 (early apoptotic cells), Q3 (late apoptotic cells), and Q4 (necrotic cells). G, H Quantification of flow cytometry experiments showing increased apoptosis in GPCs following DOX-induced SOX21 expression, as assayed by Annexin V labeling. Representative images illustrating the sphere forming capacity of JM11 (I) and JM13 (J) GPCs with or without SOX21 induction. Scale bar, 500 µm. Bar graphs quantifying the number and size of spheroids formed by control or SOX21-induced JM11 (K) and JM13 (L) GPCs. Dots in bar graphs represent analyzed biological replicates. Image collected and cropped by CiteAb from the following open publication (https://www.nature.com/articles/s41419-026-08442-5), licensed under a CC-BY license. Not internally tested by R&D Systems.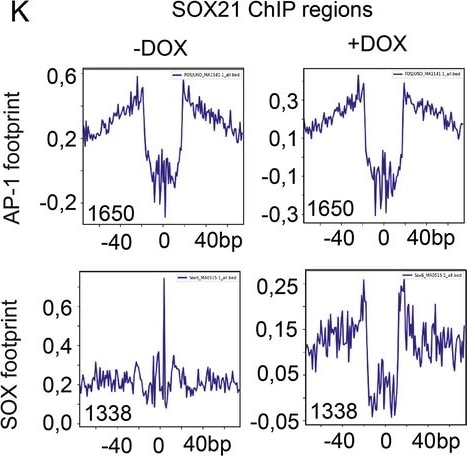
Detection of SOX21 by Flow Cytometry
SOX21 mediated epigenetic repression of AP-1 targeted genes.A Bar graph showing the proportion of transcriptionally activated (red) and repressed (blue) SOX21- and SOX2-bound genes after DOX-induced SOX21 or SOX2 expression in JM11 and JM13 GPCs. p-values are based on overlap between regulated and bound genes. RNA-seq analyses of JM11 (B) and JM13 (C) GPCs reveal a significant overlap between genes downregulated by SOX21 and AP-1 inhibitors (T-5224 and SR 11302) (blue), but not among genes upregulated by AP-1 inhibitors (red). Gene Set Enrichment Analysis (GSEA) comparing transcriptional effects of AP-1 inhibition (T-5224) and SOX21 expression on E2F target genes (D) and the p53 pathway (E) in JM11 and JM13 GPCs (NES, Normalized Enrichment Score). Read mean density profiles for ATAC-seq (F), H3K27ac ChIP-seq (G), and H3K4me1 ChIP-seq (H) mapped onto SOX21 and c-JUN bound chromatin regions in control (red line) and SOX21-induced (blue line) JM11 GPCs. Distances from SOX21 ChIP-seq peak centers are indicated in base pairs (bp). I, J Representative genome browser tracks displaying SOX21 ChIP-seq (black), c-JUN ChIP-seq (green), ATAC-seq (red), H3K27ac ChIP-seq (gray), and H3K4me1 ChIP-seq (yellow) signal intensities in control and SOX21-induced JM11 GPCs. Numbers denote peak heights from the respective ATAC-seq and ChIP-seq datasets. K, L Footprint analyses of ATAC-seq data at AP-1 and SOX motifs, present within SOX21 ChIP-seq regions or control chromatin. Mean aggregate ATAC-seq signals are shown on y-axes and the number of analyzed motifs is stated in the graphs. Image collected and cropped by CiteAb from the following open publication (https://www.nature.com/articles/s41419-026-08442-5), licensed under a CC-BY license. Not internally tested by R&D Systems.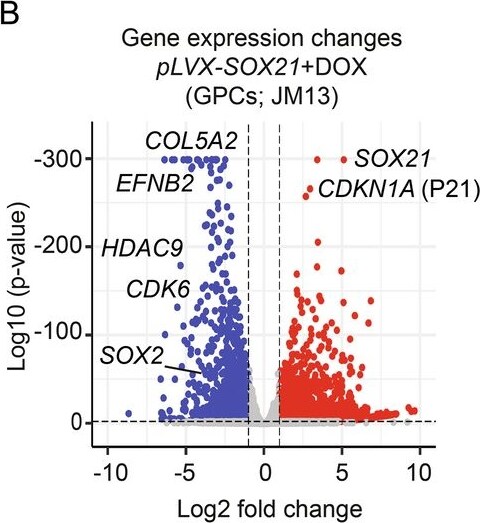
Detection of SOX21 by Flow Cytometry
Transcriptomic impact of SOX21 expression in GPCs.Volcano plots displaying differential gene expression induced by SOX21 in JM11 (A) and JM13 (B) GPCs after 48 hours. Genes significantly upregulated (red) and downregulated (blue) are shown (false discovery rate < 0.01). C Heatmaps show gene sets and associated Gene Ontology (GO) terms deregulated upon SOX21 induction. D, E Enrichment analysis of SOX motifs (black line) and AP-1 motifs (green line) within SOX21 ChIP-seq peaks detected in JM11 (D) and JM13 (E) GPCs, with motif distances to the center of SOX21 peaks measured in base pairs (bp). P-values of best-matching SOX and AP-1 motifs are shown. F Enrichment of transcription factor binding motifs across SOX21 ChIP-seq regions in comparison with non-targeted control chromatin regions. Graphs illustrating the most significant spacing distances between centrally enriched SOX and AP-1 motifs in SOX21 ChIP-seq peaks detected in JM11 (G) and JM13 (H) GPCs. The gap between motifs is based on the spacing between the last nucleotide in the SOX motif and the first nucleotide in AP-1. I, J Co-immunoprecipitation assays showing interactions between FLAG-tagged SOX21 and c-JUN in JM11 and JM13 GPCs treated with DNase I. K Genomic mapping of c-JUN ChIP-seq reads within SOX21 ChIP-seq peak regions detected in JM11 and JM13 GPCs. L, M Genomic regions surrounding CAMK2D (L) and ADRA1D (M) genes, illustrating ChIP-seq binding profiles for c-JUN, SOX21, and SOX2 in JM11 GPCs. Image collected and cropped by CiteAb from the following open publication (https://www.nature.com/articles/s41419-026-08442-5), licensed under a CC-BY license. Not internally tested by R&D Systems.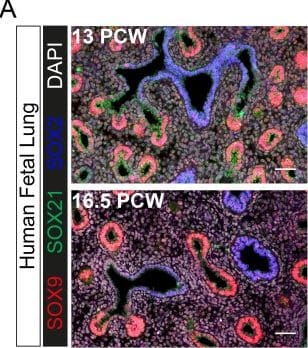
Detection of SOX21 by Immunohistochemistry
Evolutionary conserved expression of SOX21 in human airway epithelium.(A) Immunofluorescence on human fetal lung sections post-conceptional week (PCW) 13, 16.5, and 17. Proximal–distal patterning of human developing airways is analyzed with SOX9 (red) and SOX2 (blue) (left). In the small developing airways (left), no expression of SOX21 (green) was observed. On the right, co-staining of SOX2 (blue), SOX21 (green), and TP63 (red). The closed white arrowheads show cells co-expressing TP63 and SOX21. Scale bar = 50 µm. (B) Top and middle row: Immunofluorescence analysis of fetal lung organoids shows SOX2 (grey), SOX9 (red), and SOX21 (green) positive cells. White closed triangles (►) show cells positive for SOX2 and SOX9, open triangles (w) show cells positive for SOX2, SOX21, and SOX9. Arrows (g) show cells positive for SOX21 and SOX2. Bottom row: Immunofluorescence analysis of SOX2 (grey), TP63 (red), and SOX21 (green) in fetal lung organoids. White closed arrowheads (►) show cells positive for SOX2, TP63, and SOX21. Scale bar = 50 µm. (C) Fetal lung organoids differentiated to airway epithelium, as shown by the presence of ciliated cells (TUBIV; left) or basal cells (TP63, right), have an abundant expression of SOX21 (green). Scale bar = 50 µm. (D) Immunofluorescence analysis of sections of human adult bronchi shows co-localization of SOX2 (red) and SOX21 (green) throughout the epithelium (1, top row). SOX21 (green) is expressed in luminal (KRT8; grey) and basal (KRT5; red) cells (2, middle row). SOX21 is expressed in basal (TP63; red) and ciliated (FOXJ1; grey) and is high expressed in cells absent of TP63 and FOXJ1(g) (3, bottom row). Scale bar = 25 µm. Image collected and cropped by CiteAb from the following open publication (https://pubmed.ncbi.nlm.nih.gov/34286693), licensed under a CC-BY license. Not internally tested by R&D Systems.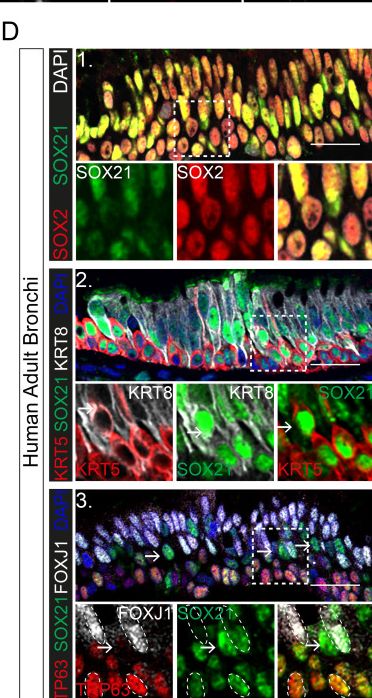
Detection of SOX21 by Immunohistochemistry
Evolutionary conserved expression of SOX21 in human airway epithelium.(A) Immunofluorescence on human fetal lung sections post-conceptional week (PCW) 13, 16.5, and 17. Proximal–distal patterning of human developing airways is analyzed with SOX9 (red) and SOX2 (blue) (left). In the small developing airways (left), no expression of SOX21 (green) was observed. On the right, co-staining of SOX2 (blue), SOX21 (green), and TP63 (red). The closed white arrowheads show cells co-expressing TP63 and SOX21. Scale bar = 50 µm. (B) Top and middle row: Immunofluorescence analysis of fetal lung organoids shows SOX2 (grey), SOX9 (red), and SOX21 (green) positive cells. White closed triangles (►) show cells positive for SOX2 and SOX9, open triangles (w) show cells positive for SOX2, SOX21, and SOX9. Arrows (g) show cells positive for SOX21 and SOX2. Bottom row: Immunofluorescence analysis of SOX2 (grey), TP63 (red), and SOX21 (green) in fetal lung organoids. White closed arrowheads (►) show cells positive for SOX2, TP63, and SOX21. Scale bar = 50 µm. (C) Fetal lung organoids differentiated to airway epithelium, as shown by the presence of ciliated cells (TUBIV; left) or basal cells (TP63, right), have an abundant expression of SOX21 (green). Scale bar = 50 µm. (D) Immunofluorescence analysis of sections of human adult bronchi shows co-localization of SOX2 (red) and SOX21 (green) throughout the epithelium (1, top row). SOX21 (green) is expressed in luminal (KRT8; grey) and basal (KRT5; red) cells (2, middle row). SOX21 is expressed in basal (TP63; red) and ciliated (FOXJ1; grey) and is high expressed in cells absent of TP63 and FOXJ1(g) (3, bottom row). Scale bar = 25 µm. Image collected and cropped by CiteAb from the following open publication (https://pubmed.ncbi.nlm.nih.gov/34286693), licensed under a CC-BY license. Not internally tested by R&D Systems.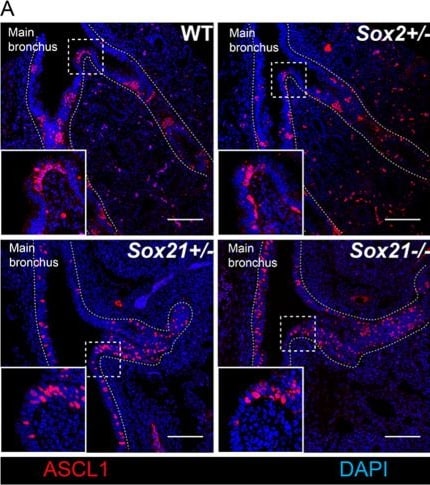
Detection of SOX21 by Immunohistochemistry
Loss of SOX21 increases differentiation of SOX2 + airway progenitor cell to NE precursor cells. A Immunofluorescence staining of ASCL1 (red) on the first bifurcation of the main bronchus at gestational age E14.5 of wild-type (WT), Sox2+/−, Sox21+/− and Sox21−/− mice. B Quantification of the percentage of NE precursor cells in a box of 400 µm2 around the first bifurcation of the main bronchus. Data are represented as mean ± SEM. One-way ANOVA (n WT = 5, n Sox2+/− = 4, Sox21+/− = 3, Sox21−/− = 3, **p < 0.01, ***p < 0.001, ****p < 0.0001) Image collected and cropped by CiteAb from the following open publication (https://pubmed.ncbi.nlm.nih.gov/36867267), licensed under a CC-BY license. Not internally tested by R&D Systems.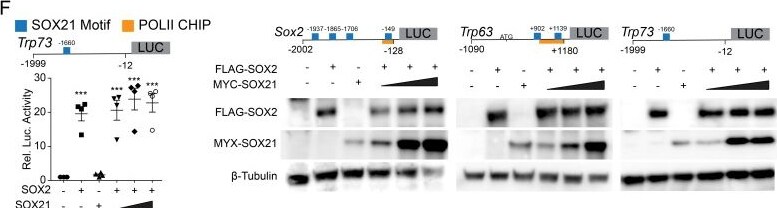
Detection of SOX21 by Western Blot
SOX21 counter balances SOX2+ progenitor differentiation to airway specific cell types.(A–D) Immunofluorescence and quantification of the number of TRP63+ basal cells (A), TRP73+ cells (B), FOXJ1+-ciliated cells (C), and KI67+-dividing cells (D) at E14.5 in wild-type (WT) and Sox2+/− mice. The number of cells were counted within the first 400 µm immediately distal of the carina at the medial side of the airway. Unpaired T-test (n = 5; *p<0.05, ***p<0.001). Scale bar = 50 µm. (E) Immunofluorescence and quantification of the number of TRP63+ (green) basal cells, FOXJ1+ (red) ciliated cells, and SCGB1A1+ (yellow) secretory cells at E18.5 in wild-type (WT) and Sox2+/− mice. The number of cells were counted within the first 400 µm immediately distal of the carina at the medial side of the airway. Unpaired T-test (n = 3; *p<0.05). Scale bar = 50 µm. (F) Luciferase assay to test the transcriptional activity of the Trp73 promotor region from −1999 till −12 (+one is considered the transcriptional start site). One-way ANOVA (n = 3; ***p<0.001, stars show significance compared to control). Western blots showing the protein levels of transfected FLAG-SOX2 and MYC-SOX21 of the luciferase assay belonging to Figure 3F. Beta-tubulin was used as loading control. Image collected and cropped by CiteAb from the following open publication (https://pubmed.ncbi.nlm.nih.gov/34286693), licensed under a CC-BY license. Not internally tested by R&D Systems.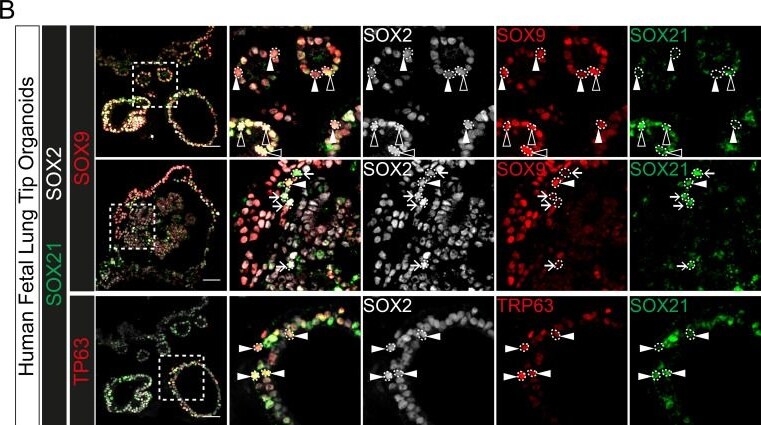
Detection of SOX21 by Immunohistochemistry
Evolutionary conserved expression of SOX21 in human airway epithelium.(A) Immunofluorescence on human fetal lung sections post-conceptional week (PCW) 13, 16.5, and 17. Proximal–distal patterning of human developing airways is analyzed with SOX9 (red) and SOX2 (blue) (left). In the small developing airways (left), no expression of SOX21 (green) was observed. On the right, co-staining of SOX2 (blue), SOX21 (green), and TP63 (red). The closed white arrowheads show cells co-expressing TP63 and SOX21. Scale bar = 50 µm. (B) Top and middle row: Immunofluorescence analysis of fetal lung organoids shows SOX2 (grey), SOX9 (red), and SOX21 (green) positive cells. White closed triangles (►) show cells positive for SOX2 and SOX9, open triangles (w) show cells positive for SOX2, SOX21, and SOX9. Arrows (g) show cells positive for SOX21 and SOX2. Bottom row: Immunofluorescence analysis of SOX2 (grey), TP63 (red), and SOX21 (green) in fetal lung organoids. White closed arrowheads (►) show cells positive for SOX2, TP63, and SOX21. Scale bar = 50 µm. (C) Fetal lung organoids differentiated to airway epithelium, as shown by the presence of ciliated cells (TUBIV; left) or basal cells (TP63, right), have an abundant expression of SOX21 (green). Scale bar = 50 µm. (D) Immunofluorescence analysis of sections of human adult bronchi shows co-localization of SOX2 (red) and SOX21 (green) throughout the epithelium (1, top row). SOX21 (green) is expressed in luminal (KRT8; grey) and basal (KRT5; red) cells (2, middle row). SOX21 is expressed in basal (TP63; red) and ciliated (FOXJ1; grey) and is high expressed in cells absent of TP63 and FOXJ1(g) (3, bottom row). Scale bar = 25 µm. Image collected and cropped by CiteAb from the following open publication (https://pubmed.ncbi.nlm.nih.gov/34286693), licensed under a CC-BY license. Not internally tested by R&D Systems.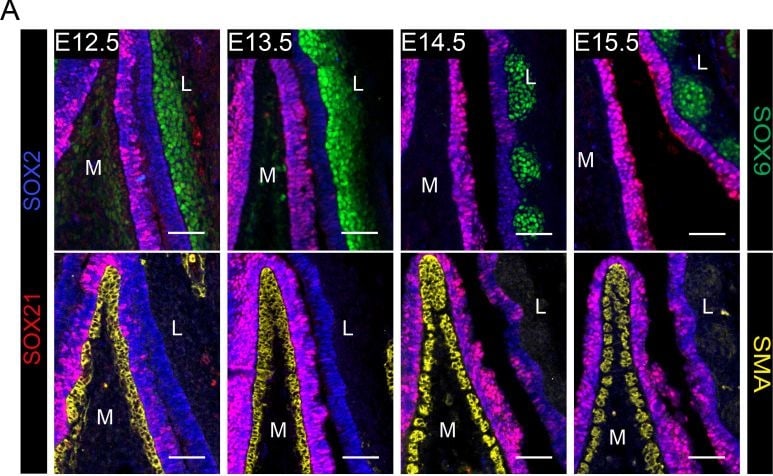
Detection of SOX21 by Immunohistochemistry
SOX21 is unilaterally detected in the developing trachea and overexpression of SOX21 leads to lung cysts.(A) Immunostaining on sections of the main bronchi immediately distal of the carina from mice at embryonic day (E) 12.5, 13.5, 14.5, and 15.5 using SOX2 (blue), SOX21 (red), and either SOX9 (green, top row) or smooth muscle actin (SMA; yellow, bottom row). The mesenchymal cells on the medial (M) side express SMA. At the lateral (L) side, mesenchymal cells express SOX9. Scale bar = 50 µm. (B) Schematic representation of the iSox2SPC-rtTA and iSox21SPC-rtTA mouse models. (C) Bright field images of E18.5 lungs from control, iSox2SPC-rtTA and iSox21SPC-rtTA mice that received doxycycline from E6 onwards. Scale bar = 2 mm. HE staining of the lungs show the size of the cysts that are present in the lungs of iSox2SPC-rtTA and iSox21SPC-rtTA mice. Scale bar = 0.5 mm. Image collected and cropped by CiteAb from the following open publication (https://pubmed.ncbi.nlm.nih.gov/34286693), licensed under a CC-BY license. Not internally tested by R&D Systems.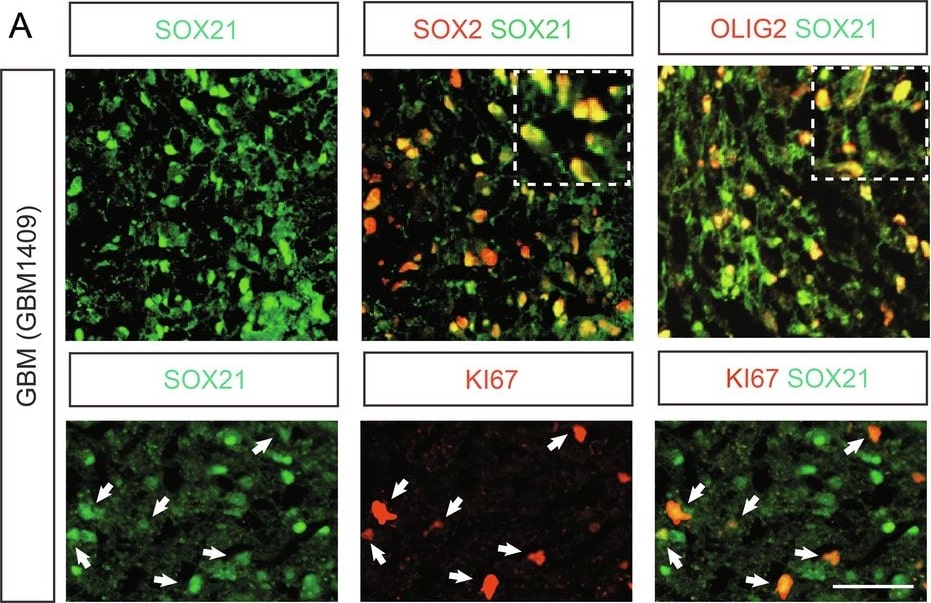
Detection of SOX21 by Immunohistochemistry
SOX21 expression is associated with improved survival in GBM patients.A–F Immunohistochemical and statistical analyses of GBM surgical specimens (GBM1409, GBM1705 and GBM1405) show that SOX21 protein (green) is predominantly expressed in SOX2+ cells (red) and is present in most OLIG2+ and KI67⁺ cells (red). Insets display magnified regions of the tumor. Scale bars: 50 µm in (A, C, E). Dots represent technical replicates (sections) analyzed per tumor. Kaplan-Meier survival analyses of IDH wildtype GBM patient cohorts from TCGA (n = 143) (G) and CGGA (n = 155) (H), classified according to the 2021 WHO (CNS5) criteria, demonstrate significantly improved overall survival in patients with high SOX21 expression (red line) compared with those with low expression (blue line). TCGA: p = 6 × 10⁻³, HR = 0.59; CGGA: p = 7 × 10⁻³, HR = 0.63. Image collected and cropped by CiteAb from the following open publication (https://www.nature.com/articles/s41419-026-08442-5), licensed under a CC-BY license. Not internally tested by R&D Systems.Applications for Human SOX21 Antibody
Immunocytochemistry
Sample: Immersion fixed NTera‑2 human testicular embryonic carcinoma cell line
Immunohistochemistry
Sample: Immersion fixed paraffin-embedded sections of human glioblastoma
Western Blot
Sample: Recombinant Human SOX21
Formulation, Preparation, and Storage
Purification
Reconstitution
Reconstitute at 0.2 mg/mL in sterile PBS. For liquid material, refer to CoA for concentration.
Formulation
Shipping
Stability & Storage
- 12 months from date of receipt, -20 to -70 °C as supplied.
- 1 month, 2 to 8 °C under sterile conditions after reconstitution.
- 6 months, -20 to -70 °C under sterile conditions after reconstitution.
Calculators
Background: SOX21
Long Name
Alternate Names
Gene Symbol
UniProt
Additional SOX21 Products
Product Documents for Human SOX21 Antibody
Certificate of Analysis
To download a Certificate of Analysis, please enter a lot or batch number in the search box below.
Note: Certificate of Analysis not available for kit components.
Product Specific Notices for Human SOX21 Antibody
For research use only
Citations for Human SOX21 Antibody
 Powered by Bioz
Customer Reviews for Human SOX21 Antibody
There are currently no reviews for this product. Be the first to review Human SOX21 Antibody and earn rewards!
Have you used Human SOX21 Antibody?
Submit a review and receive an Amazon gift card!
$25/€18/£15/$25CAN/¥2500 for a review with an image
$10/€7/£6/$10CAN/¥1110 for a review without an image
Submit a review
Protocols
Find general support by application which include: protocols, troubleshooting, illustrated assays, videos and webinars.
- Antigen Retrieval Protocol (PIER)
- Antigen Retrieval for Frozen Sections Protocol
- Appropriate Fixation of IHC/ICC Samples
- Cellular Response to Hypoxia Protocols
- Chromogenic IHC Staining of Formalin-Fixed Paraffin-Embedded (FFPE) Tissue Protocol
- Chromogenic Immunohistochemistry Staining of Frozen Tissue
- ClariTSA™ Fluorophore Kits
- Detection & Visualization of Antibody Binding
- Fluorescent IHC Staining of Frozen Tissue Protocol
- Graphic Protocol for Heat-induced Epitope Retrieval
- Graphic Protocol for the Preparation and Fluorescent IHC Staining of Frozen Tissue Sections
- Graphic Protocol for the Preparation and Fluorescent IHC Staining of Paraffin-embedded Tissue Sections
- Graphic Protocol for the Preparation of Gelatin-coated Slides for Histological Tissue Sections
- ICC Cell Smear Protocol for Suspension Cells
- ICC Immunocytochemistry Protocol Videos
- ICC for Adherent Cells
- IHC Sample Preparation (Frozen sections vs Paraffin)
- Immunocytochemistry (ICC) Protocol
- Immunocytochemistry Troubleshooting
- Immunofluorescence of Organoids Embedded in Cultrex Basement Membrane Extract
- Immunofluorescent IHC Staining of Formalin-Fixed Paraffin-Embedded (FFPE) Tissue Protocol
- Immunohistochemistry (IHC) and Immunocytochemistry (ICC) Protocols
- Immunohistochemistry Frozen Troubleshooting
- Immunohistochemistry Paraffin Troubleshooting
- Preparing Samples for IHC/ICC Experiments
- Preventing Non-Specific Staining (Non-Specific Binding)
- Primary Antibody Selection & Optimization
- Protocol for Heat-Induced Epitope Retrieval (HIER)
- Protocol for Making a 4% Formaldehyde Solution in PBS
- Protocol for VisUCyte™ HRP Polymer Detection Reagent
- Protocol for the Fluorescent ICC Staining of Cell Smears - Graphic
- Protocol for the Fluorescent ICC Staining of Cultured Cells on Coverslips - Graphic
- Protocol for the Preparation & Fixation of Cells on Coverslips
- Protocol for the Preparation and Chromogenic IHC Staining of Frozen Tissue Sections
- Protocol for the Preparation and Chromogenic IHC Staining of Frozen Tissue Sections - Graphic
- Protocol for the Preparation and Chromogenic IHC Staining of Paraffin-embedded Tissue Sections
- Protocol for the Preparation and Chromogenic IHC Staining of Paraffin-embedded Tissue Sections - Graphic
- Protocol for the Preparation and Fluorescent ICC Staining of Cells on Coverslips
- Protocol for the Preparation and Fluorescent ICC Staining of Non-adherent Cells
- Protocol for the Preparation and Fluorescent ICC Staining of Stem Cells on Coverslips
- Protocol for the Preparation and Fluorescent IHC Staining of Frozen Tissue Sections
- Protocol for the Preparation and Fluorescent IHC Staining of Paraffin-embedded Tissue Sections
- Protocol for the Preparation of Gelatin-coated Slides for Histological Tissue Sections
- Protocol for the Preparation of a Cell Smear for Non-adherent Cell ICC - Graphic
- R&D Systems Quality Control Western Blot Protocol
- TUNEL and Active Caspase-3 Detection by IHC/ICC Protocol
- The Importance of IHC/ICC Controls
- Troubleshooting Guide: Immunohistochemistry
- Troubleshooting Guide: Western Blot Figures
- Western Blot Conditions
- Western Blot Protocol
- Western Blot Protocol for Cell Lysates
- Western Blot Troubleshooting
- Western Blot Troubleshooting Guide
- View all Protocols, Troubleshooting, Illustrated assays and Webinars