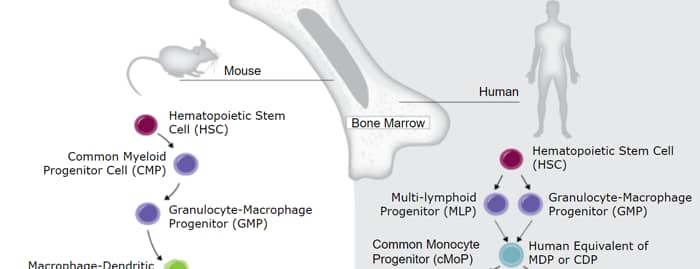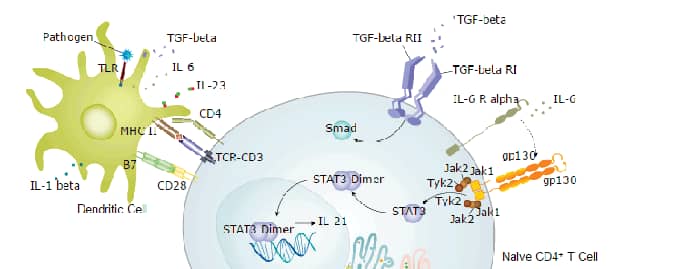
CD4 (Cluster of Differentiation #4; also L3T4) is a 55 kDa member of the Ig Superfamily of molecules. It is expressed on a variety of hematopoietic cell types, including immature thymocytes, a number of variable phenotype single positive T cells (i.e.- CD25+; CD39+; Th1, 2 and 17 type cells), stimulated CD8+ T cells, pluripotent bone marrow stem cells, and NKT cells. Although CD4 is a standard phenotype marker, functionally, the molecule is known to bind to APC MHC class II, and to associate with adjacent CD3 molecules to link p56lck with the lymphocyte TCR:CD3 complex. Mature mouse CD4 is a 431 amino acid (aa) type I transmembrane glycoprotein. It contains a 368 aa extracellular region (aa 27-394) plus a 40 aa cytoplasmic domain (aa 418-457). The extracellular region contains one V-type (aa 27-128) and three C2-type Ig-like domains (aa 129-374). There is one alternative start site at Met241 that is utilized in brain. Over aa 27-394, mouse CD4 shares 53% and 72% aa identity with human and rat CD4, respectively.

Scientific images may be resized, cropped, or adjusted for brightness or contrast for presentation purposes. These updates are limited to presentation and do not affect the underlying scientific interpretation of the data. Where available, additional source data may be provided upon request.
Key Product Details
Species Reactivity
Validated:
Cited:
Applications
Validated:
Cited:
Label
Antibody Source
Product Specifications
Immunogen
Lys27-Thr394
Accession # P06332
Specificity
Clonality
Host
Isotype
Scientific Data Images for Mouse CD4 Antibody
Detection of CD4 by Flow Cytometry
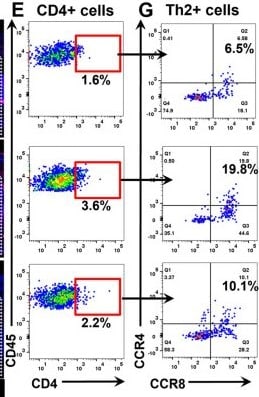
Chronic wounds result in a delayed Th2 response that persists as the wound heals. (A) Representative high-power immunohistochemistry (zoom-out 2×; zoom-in 40×) and quantification of (B) CD4+ T-helper cells in the distal peri-wound regions (n = 5, 2–3 HPF/animal, p < 0.01 at week 2, p < 0.0001 at week 4, and p < 0.001 at week 6 post-operation) (C) Representative high-power immunohistochemistry (zoom-out 2×; zoom-in 40×) and (D) quantification of Gata3+ Th2 cells in the distal peri-wound regions (n = 5, 2–3 HPF/animal, p < 0.01 at week 2, p < 0.0001 at week 4, and p < 0.001 at week 6 post-operation). (E) Representative flow cytometry plots displaying CD45+ on the y axis and CD4+ cells (T cells) on the x axis. (F) Quantification of CD4+ T cells as a percentage of CD45+ cells (p < 0.05 between weeks 2 and 4 post-operation). (G) Representative flow cytometry plots displaying CCR4+ on the y axis and CCR8+ on the x axis to identify Th2 cells. (H) Quantification of Th2+ T cells as a percentage of CD4+ T cells (p < 0.05 between weeks 2 and 4 post-operation). Red square represents gating for CD4+ & CD45+ double positive cells. As for colors, there are only 3 as mentioned in the figure: CD4 (green) LYVE (red) or Gata3 (red) DAPI (blue) and when they colocalize they may appear in different shades * denotes p < 0.05, ** denotes p < 0.01, # denotes p < 0.0001. Image collected and cropped by CiteAb from the following open publication (https://pubmed.ncbi.nlm.nih.gov/40426856), licensed under a CC-BY license. Not internally tested by R&D Systems.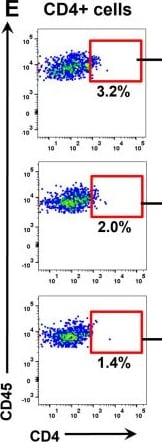
Detection of CD4 by Flow Cytometry
Inhibition of Th2 cytokines results in decreased peri-wound Th2 cell infiltration. (A) Representative high-power immunohistochemistry (zoom-out 2×; zoom-in 40×) and quantification of (B) CD4+ T-helper cells in the distal peri-wound regions (n = 5, 2–3 HPF/animal; p < 0.01). (C) Representative high-power immunohistochemistry (zoom-out 2×; zoom-in 40×) and quantification of (D) Gata3+ Th2 cells in the distal peri-wound regions (n = 5, 2–3 HPF/animal; p < 0.01 when comparing between isotype and IL-4 mAB and p < 0.0001 when comparing between isotype and IL-13 mAb-treated animals). (E) Representative flow cytometry plots displaying CD45+ on the y axis and CD4+ cells (T cells) on the x axis. (F) Quantification of CD4+ T cells as a percentage of CD45+ cells (p < 0.01). (G) Representative flow cytometry plots displaying CCR4+ on the y axis and CCR8+ on the x axis to identify Th2 cells. (H) Quantification of Th2+ T cells as a percentage of CD4+ T cells (p < 0.01). As for colors, there are only 3 as mentioned in the figure: CD4 (green) Gata3 (red) DAPI (blue) and when they colocalize they may appear in different shades. ** denotes p < 0.01, **** denotes p < 0.0001. Image collected and cropped by CiteAb from the following open publication (https://pubmed.ncbi.nlm.nih.gov/40426856), licensed under a CC-BY license. Not internally tested by R&D Systems.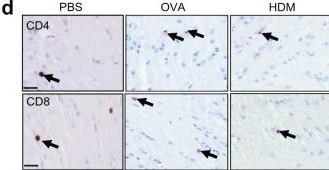
Detection of CD4 by Immunohistochemistry
Asthma reduces T cell induction of Ccl5 in microglia.a Schematic representation of the mouse Nf1OPG neuron-immune-cancer cell axis in the setting of asthma. b No difference in optic nerve Mdk RNA expression was observed between OVA- (n = 3) or HDM- (n = 3) treated mice and controls (n = 6). Bar graphs represent the means ± SEM of independent biological samples. One-way ANOVA with Bonferroni post hoc correction. c Ccl4 levels are similarly induced with increasing midkine concentrations (0–100 ng/ml) in CD3+ T cells from OVA- and PBS-treated mice. Data are presented as the means ± SEM of n = 3 independent biological samples. One-way ANOVA with Bonferroni post hoc correction. Data are presented as the means ± SEM. d, e Similarly increased CD8+, relative to CD4+, T cell content was detected in the optic nerves of Nf1OPG mice treated with PBS (n = 8), OVA (n = 8) or HDM (n = 8). One-way ANOVA with Bonferroni post hoc correction. Activated T cell medium from (f) OVA- (n = 4) and g HDM- (n = 4) treated mice induced lower levels of microglial Ccl5 relative to PBS-treated Nf1OPG mice. Two-tailed Student’s t test. Similar reductions of Ccl5 expression were observed in CD4+ and CD8+ T cells from (h) OVA- (n = 3) and (i) HDM- (n = 3) treated mice relative to PBS-treated controls (n = 3). One-way ANOVA with Bonferroni post hoc correction. Data are presented as the means ± SEM. d Scale bars, 40 µm. From left to right in each panel: b ns; c ns; ns; ns; ns; eP < 0.0001, P = 0.0022, P = 0.0011; fP = 0.0008; gP = 0.0015; hP = 0.0186, P = 0.0054; iP = 0.0224, P = 0.0007. Image collected and cropped by CiteAb from the following open publication (https://pubmed.ncbi.nlm.nih.gov/34880260), licensed under a CC-BY license. Not internally tested by R&D Systems.Applications for Mouse CD4 Antibody
Western Blot
Sample: Recombinant Mouse CD4
Formulation, Preparation, and Storage
Purification
Reconstitution
Reconstitute at 0.2 mg/mL in sterile PBS. For liquid material, refer to CoA for concentration.
Formulation
Shipping
Stability & Storage
- 12 months from date of receipt, -20 to -70 °C as supplied.
- 1 month, 2 to 8 °C under sterile conditions after reconstitution.
- 6 months, -20 to -70 °C under sterile conditions after reconstitution.
Calculators
Background: CD4
Alternate Names
Entrez Gene IDs
Gene Symbol
UniProt
Additional CD4 Products
Product Documents for Mouse CD4 Antibody
Certificate of Analysis
To download a Certificate of Analysis, please enter a lot or batch number in the search box below.
Note: Certificate of Analysis not available for kit components.
Product Specific Notices for Mouse CD4 Antibody
For research use only
Citations for Mouse CD4 Antibody
 Powered by Bioz
Customer Reviews for Mouse CD4 Antibody
There are currently no reviews for this product. Be the first to review Mouse CD4 Antibody and earn rewards!
Have you used Mouse CD4 Antibody?
Submit a review and receive an Amazon gift card!
$25/€18/£15/$25CAN/¥2500 for a review with an image
$10/€7/£6/$10CAN/¥1110 for a review without an image
Submit a review
Protocols
Find general support by application which include: protocols, troubleshooting, illustrated assays, videos and webinars.
- Cellular Response to Hypoxia Protocols
- R&D Systems Quality Control Western Blot Protocol
- Troubleshooting Guide: Western Blot Figures
- Western Blot Conditions
- Western Blot Protocol
- Western Blot Protocol for Cell Lysates
- Western Blot Troubleshooting
- Western Blot Troubleshooting Guide
- View all Protocols, Troubleshooting, Illustrated assays and Webinars