Close homolog of L1 (CHL-1), also known as cell adhesion L1-like (CALL) and L1 cell adhesion molecule 2 (L1CAM-2), belongs to the L1 subfamily of immunoglobulin (Ig) superfamily cell adhesion molecules, which also includes L1, neurofascin and NgCAM-related cell adhesion molecule (NrCAM) (1‑3). These molecules are type I transmembrane proteins that have 6 Ig-like domains and 4‑5 fibronectin type III-like (FNIII) domains in their extracellular regions. They also share a highly conserved cytoplasmic region of approximately 110 amino acid (aa) residues containing an ankyrin-binding site. CHL-1 is expressed as a highly glycosylated 185 kDa transmembrane protein by subpopulations of neurons and glia of the central and peripheral nervous system (4, 5). Ectodomain shedding via the metalloprotease-disintegrin ADAM8 releases 165 kDa and 125 kDa soluble CHL-1 fragments, which can diffuse away to function at distant sites (6). CHL-1 is not capable of homotypic interactions, but an extracellular binding partner of CHL-1 has not been identified (4). Human CHL1 has been mapped to chromosome 3p26 and is a candidate gene for 3p- syndrome characterized by mental impairment (7). A missense CHL1 polymorphism associated increased risk of schizophrenia, has also been reported (8). The functional importance of CHL-1 in the nervous system is also evident in CHL-1 deficient mice, which display behavioral abnormalities and show misguided axons within the hippocampus and olfactory tract (9). Enhanced ectodomain-shedding of CHL-1 is also observed in Wobbler mice, the neurodegenerative mutant mice (6). In vitro, soluble or substrate-coated CHL-1 promotes neurite outgrowth and neuronal survival of both cerebellar and hippocampal neurons. Cell surface CHL-1 interacts with integrins in cis to potentiate integrin-dependent cell migration toward extracellular matrix proteins (10). For this enhanced cell motility, CHL-1 linkage to the actin cytoskeleton via interaction between ankyrin and the CHL-1 cytoplasmic region is required.

Key Product Details
Validated by
Biological Validation
Species Reactivity
Validated:
Mouse
Cited:
Human, Mouse, Rat, Transgenic Mouse
Applications
Validated:
Immunohistochemistry, Western Blot, Simple Western
Cited:
Immunohistochemistry, Immunohistochemistry-Frozen, Western Blot, Neutralization, Flow Cytometry, Immunocytochemistry, Immunoprecipitation, Cell Culture, Mass Spectrometry
Label
Unconjugated
Antibody Source
Polyclonal Goat IgG
Loading...
Product Specifications
Immunogen
Mouse myeloma cell line NS0-derived recombinant mouse CHL‑1/L1CAM‑2
Ala25-Gln1043 (Leu227-Gln242 del, Ala243Ser)
Accession # BAC30699
Ala25-Gln1043 (Leu227-Gln242 del, Ala243Ser)
Accession # BAC30699
Specificity
Detects mouse CHL‑1/L1CAM‑2 in direct ELISAs and Western blots. In direct ELISAs and Western blots, approximately 40% cross-reactivity with recombinant human CHL-1 is observed.
Clonality
Polyclonal
Host
Goat
Isotype
IgG
Scientific Data Images for Mouse CHL-1/L1CAM-2 Antibody
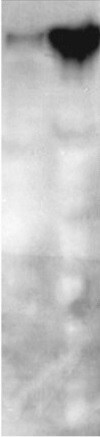
Detection of Mouse CHL‑1/L1CAM‑2 by Western Blot.
Western blot shows lysates of mouse brain stem tissue. PVDF membrane was probed with 0.25 µg/mL of Goat Anti-Mouse CHL-1/L1CAM-2 Antigen Affinity-purified Polyclonal Antibody (Catalog # AF2147) followed by HRP-conjugated Anti-Goat IgG Secondary Antibody (Catalog # HAF019). A specific band was detected for CHL-1/L1CAM-2 at approximately 200 kDa (as indicated). This experiment was conducted under reducing conditions and using Immunoblot Buffer Group 1.
Detection of Mouse CHL‑1/L1CAM‑2 by Simple WesternTM.
Simple Western lane view shows lysates of mouse brain (cortex) tissue and mouse brain stem tissue, loaded at 0.2 mg/mL. A specific band was detected for CHL-1/L1CAM-2 at approximately 196-201 kDa (as indicated) using 2.5 µg/mL of Goat Anti-Mouse CHL-1/L1CAM-2 Antigen Affinity-purified Polyclonal Antibody (Catalog # AF2147) followed by 1:50 dilution of HRP-conjugated Anti-Goat IgG Secondary Antibody (Catalog # HAF109). This experiment was conducted under reducing conditions and using the 12-230 kDa separation system.
Detection of Mouse CHL-1/L1CAM-2 by Western Blot
BACE1-mediated processing of APP and CHL1 is reduced in cortex of aged BACE1 cKO mice following tamoxifen treatment. Cortex homogenates from TAM- or VEH-treated mice were resolved by SDS-PAGE for Western blot analysis of APP and CHL1 processing. Homogenates from aged-matched BACE+/− and BACE1−/− were also loaded as control samples. APP-FL, pC99 and pC89 were normalized to GAPDH (MAB374) while CHL1-FL and CHL1-NTF were normalized to beta -tubulin (JDR.3B8). Protein amount was normalized to protein levels in control mice injected with vehicle (set at 1). Representative blots of (a) APP-FL (C1/6.1), (b) APP-CTFs (C1/6.1) and (c) CHL1. (d) Densitometry analysis of protein expression. APP processing was reduced in TAM-treated mice as demonstrated by the accumulation of APP-FL (C1/6.1), and reduced levels of the beta CTFs pC99 and pC89. beta CTFs were clearly identified because missing in the BACE1−/− sample. CHL1-FL (AF2147) levels were increased and CHL1-NTF levels were significantly reduced. Furthermore, the CHL1-NTF/CHL1-FL ratio was significantly decreased in TAM-treated mice demonstrating reduced BACE1 processing (VEH n = 7; TAM n = 7). (e) Quantification of A beta x-40 was performed by MSD immunoassay on cortex homogenates and expressed as pMol/g of cortex. The decrease of levels of A beta x-40 in TAM-treated mice was comparable to the one observed in samples collected from young TAM-treated mice (~50% decrease) (VEH n = 7; TAM n = 7). Results were plotted as Mean ± SEM, *p < 0.05; **p < 0.005; ***p < 0.001; ****p < 0.0001; n.s. = not significant, Student’s t test. Image collected and cropped by CiteAb from the following publication (https://pubmed.ncbi.nlm.nih.gov/31882662), licensed under a CC-BY license. Not internally tested by R&D Systems.
Detection of Mouse CHL-1/L1CAM-2 by Western Blot
Axon guidance defects were absent in hippocampus mossy fibers of aged BACE1 cKO mice following partial BACE1 deletion. (a) Coronal sections collected from aged mice were stained with anti-synaptoporin (SPO) antibody (green) and DAPI (blue). Scale bar 50 μm. (b) Quantification of IPB length showed no alteration in TAM-treated mice compared to controls. IPB length was normalized on the length of the CA3 stratum lucidum (VEH n = 8; TAM n = 7, 3 to 4 sections per mouse). (c) Representative microscopy images showing reduced BACE1 (D10E5) expression in the hippocampus of TAM-treated mice. BACE1 signal was totally absent in BACE−/− mice, used as control to evaluate the amount of background in the staining. Scale bar 200 μm. Hippocampus full homogenates from TAM- or VEH-treated mice were resolved by SDS-PAGE for analysis of APP processing and fractionated (soluble and membrane fractions) for the analysis of SEZ6 and CHL1 processing. Homogenates from aged-matched BACE+/− and BACE1−/− were loaded as control samples. Representative blots of (d) APP-FL (C1/6.1) and APP- CTFs (C1/6.1), (e) fractionation blots of sAPP beta (BAWT), SEZ6 (14E5) and CHL1 (AF2147). (f) Densitometry analysis of protein expression. APP processing was reduced in TAM-treated mice as demonstrated by the accumulation of APP-FL (C1/6.1), and reduced levels of the beta CTFs pC99 and pC89, and sAPP beta. beta CTFs and sAPP beta were identified because missing in the BACE1−/− sample. SEZ6 processing was decreased in TAM-treated mice with accumulation of the full length and decreased levels of the ectodomain (SEZ6-NTF) as well as decreased SEZ6-NTF/SEZ6FL ratio. Processing of CHL1 was also impaired as showed by increased of CHL1-FL levels, while CHL1-NTF was not altered. CHL1-NTF/CHL1-FL ratio was significantly decreased. APP-FL, CTFs, SEZ6-NTF and CHL1-NTF were normalized to GAPDH (MAB374), SEZ6-FL and CHL1-FL were normalized to Calnexin (610523) (VEH n = 5; TAM n = 5). (g) A beta x-40 was quantified from hippocampus homogenates by MS
Detection of Mouse CHL-1/L1CAM-2 by Western Blot
BACE1-mediated processing of APP and CHL1 is reduced in cortex of young BACE1 cKO mice following tamoxifen treatment. Cortex homogenates from TAM- or VEH-treated mice were resolved by SDS-PAGE for Western blot analysis of APP and CHL1 processing. Homogenates from aged-matched BACE+/− and BACE1−/− were also loaded as control samples. Representative blots of (a) APP-full length (APP-FL) (C1/6.1), (b) APP-Carboxy Terminal Fragments (CTFs) (C1/6.1) and (c) CHL1. (d) Densitometry analysis of protein expression. Protein amount was normalized to protein levels in control mice (set at 1). APP-FL, pC99 and pC89 were normalized to GAPDH (MAB374) while CHL1-FL and CHL1-NTF were normalized to beta -tubulin (JDR.3B8). APP processing was reduced in TAM-treated mice as demonstrated by the accumulation of APP-FL (C1/6.1), and reduced levels of the beta CTFs pC99 and pC89. beta CTFs were clearly identified because missing in the BACE1−/− sample. CHL1-FL (AF2147) levels were increased while CHL1-N Terminal Fragment (CHL1-NTF) levels were not affected in cortex of TAM-treated mice. However, the CHL1-NTF/CHL1-FL ratio was significantly decreased in TAM-treated mice demonstrating reduced BACE1 processing (VEH n = 8; TAM n = 8). (e) A beta x-40 was quantified from brain homogenates by ELISA (VEH n = 8; TAM n = 8). Levels of A beta x-40 expressed as pMol/g of cortex were significantly reduced in TAM-treated mice (~50% decrease). Results were plotted as Mean ± SEM, ***p < 0.001; ****p < 0.0001; n.s. = not significant, Student’s t test. Image collected and cropped by CiteAb from the following publication (https://pubmed.ncbi.nlm.nih.gov/31882662), licensed under a CC-BY license. Not internally tested by R&D Systems.
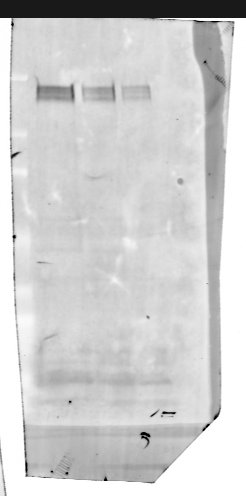
Detection of Mouse Mouse CHL-1/L1CAM-2 Antibody by Western Blot
Quantitative proteomics in Rab35 cKO P0 hippocampus.a Volcano plot of the TMT-based quantitative proteomes identifying the dysregulated proteins in Rab35 cKO hippocampus in comparison with the control hippocampus (n = 5 mice per genotype). b Number of proteins identified as significantly dysregulated and as either membrane traffic-related or neuronal migration-related. c, d Western blot analysis of control and Rab35 cKO P0 hippocampi using anti-contactin-2, anti-CHL1, and anti-actin antibodies. e, f Quantification of contactin-2 (c) and CHL1 (d) protein levels in control and Rab35 cKO P0 hippocampi. Band intensities of the indicated proteins were normalized to those of actin (n = 9 mice per genotype). Unpaired Student’s t-test; e, p = 0.0153; f, p = 0.0095. g, h Levels of contactin-2 (g) and CHL1 (h) were quantified by targeted MS using the PRM method (n = 5 mice per genotype). Unpaired Student’s t-test; gp = 0.0053; hp = 0.0229. i Western blot analysis of control and Rab35 cKO P0 hippocampus using anti-N-cadherin and anti-actin antibodies. j Quantification of N-cadherin protein levels in the control and Rab35 cKO P0 hippocampus (n = 9 mice per genotypes). Unpaired Student’s t-test, p = 0.9020. k Representative images of DIV 2 hippocampal primary neurons stained for contactin-2 (green), rhodamine-phalloidin (magenta) and DAPI (blue). Scale bar, 20 μm. l Quantification of contactin-2 intensity at the somatic plasma membrane in control (n = 4) and Rab35-deficient (n = 4) cells. Thirty neurons from four different cultures per genotype were analyzed. Mann–Whitney U-test, p = 0.0286. Data represent the mean ± SEM; n.s. not significant (p > 0.05); *p < 0.05; **p < 0.01. Image collected and cropped by CiteAb from the following publication (https://pubmed.ncbi.nlm.nih.gov/37085665), licensed under a CC-BY license. Not internally tested by R&D Systems.Applications for Mouse CHL-1/L1CAM-2 Antibody
Application
Recommended Usage
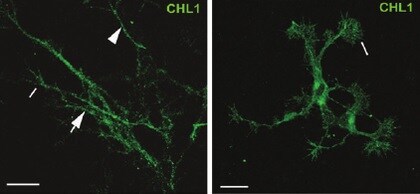
Immunohistochemistry
5-15 µg/mL
Sample: Perfusion fixed frozen sections of mouse brain (cortex)
Sample: Perfusion fixed frozen sections of mouse brain (cortex)
Simple Western
2.5 µg/mL
Sample: Mouse brain (cortex) tissue and mouse brain stem tissue
Sample: Mouse brain (cortex) tissue and mouse brain stem tissue
Western Blot
0.25 µg/mL
Sample: Mouse brain stem tissue
Sample: Mouse brain stem tissue
Reviewed Applications
Read 4 reviews rated 4.8 using AF2147 in the following applications:
Formulation, Preparation, and Storage
Purification
Antigen Affinity-purified
Reconstitution
Reconstitute at 0.2 mg/mL in sterile PBS. For liquid material, refer to CoA for concentration.
Loading...
Formulation
Lyophilized from a 0.2 μm filtered solution in PBS with Trehalose. *Small pack size (SP) is supplied either lyophilized or as a 0.2 µm filtered solution in PBS.
Shipping
Lyophilized product is shipped at ambient temperature. Liquid small pack size (-SP) is shipped with polar packs. Upon receipt, store immediately at the temperature recommended below.
Stability & Storage
Use a manual defrost freezer and avoid repeated freeze-thaw cycles.
- 12 months from date of receipt, -20 to -70 °C as supplied.
- 1 month, 2 to 8 °C under sterile conditions after reconstitution.
- 6 months, -20 to -70 °C under sterile conditions after reconstitution.
Calculators
Background: CHL-1/L1CAM-2
References
- Moos, M. et al. (1988) Nature 334:701.
- Holm, J. et al. (1996) Eur. J. Neusci. 8:1613.
- Wei, M. et al. (1998) Hum. Genet. 103:355.
- Hillenbrand, R. et al. (1999) Eur. J. Neurosci. 11:813.
- Liu, Q. et al. (2000) J. Neurosci. 20:7682.
- Naus, S. et al. (2004) J. Biol. Chem. 279:16083.
- Angeloni, D. et al. (1999) Am. J. Med. Genet. 86:482.
- Sakurai, K. et al. (2002) Mol. Psychiatry 7:412.
- Montag-Sallaz, M. et al. (2002) Mol. Cell. Biol. 22:7967.
- Buhusi, M. et al. (2003) J. Biol. Chem. 278(27):25024.
Long Name
Cell Adhesion Molecule with Homology to L1CAM
Alternate Names
CALL, CHL1, L1CAM-2
Gene Symbol
CHL1
UniProt
Additional CHL-1/L1CAM-2 Products
Product Documents for Mouse CHL-1/L1CAM-2 Antibody
Certificate of Analysis
To download a Certificate of Analysis, please enter a lot or batch number in the search box below.
Note: Certificate of Analysis not available for kit components.
Product Specific Notices for Mouse CHL-1/L1CAM-2 Antibody
For research use only
Related Research Areas
Citations for Mouse CHL-1/L1CAM-2 Antibody
 Powered by Bioz
Customer Reviews for Mouse CHL-1/L1CAM-2 Antibody (4)
4.8 out of 5
4 Customer Ratings
Have you used Mouse CHL-1/L1CAM-2 Antibody?
Submit a review and receive an Amazon gift card!
$25/€18/£15/$25CAN/¥2500 Yen for a review with an image
$10/€7/£6/$10CAN/¥1110 Yen for a review without an image
Submit a review
Customer Images
Showing
1
-
4 of
4 reviews
Showing All
Filter By:
-
Application: Immunocytochemistry/ImmunofluorescenceSample Tested: Cortical and thalamic neuronsSpecies: MouseVerified Customer | Posted 07/16/2021

-
Application: Western BlotSample Tested: Brainstem tissueSpecies: MouseVerified Customer | Posted 07/09/2021
-
Application: Western BlotSample Tested: Brain tissueSpecies: MouseVerified Customer | Posted 04/26/201680, 40 and 20ug of total mouse brain homogenate was separated by SDS-PAGE and transfered to PVDF membrane Block: 1% BSA, 1% FSG PBS-T 1h RT Primary: 1:1000, 1% BSA, 1% FSG PBS-T O/N 4oC Secondary: 1:5000,1% BSA, 1% FSG PBS-T 2h RT (Secondary - DaG 800, Licor)
-
Application: Western BlotSample Tested: See PMID 22579729Species: MouseVerified Customer | Posted 01/06/2015
There are no reviews that match your criteria.
Protocols
Find general support by application which include: protocols, troubleshooting, illustrated assays, videos and webinars.
- Antigen Retrieval Protocol (PIER)
- Antigen Retrieval for Frozen Sections Protocol
- Appropriate Fixation of IHC/ICC Samples
- Cellular Response to Hypoxia Protocols
- Chromogenic IHC Staining of Formalin-Fixed Paraffin-Embedded (FFPE) Tissue Protocol
- Chromogenic Immunohistochemistry Staining of Frozen Tissue
- ClariTSA™ Fluorophore Kits
- Detection & Visualization of Antibody Binding
- Fluorescent IHC Staining of Frozen Tissue Protocol
- Graphic Protocol for Heat-induced Epitope Retrieval
- Graphic Protocol for the Preparation and Fluorescent IHC Staining of Frozen Tissue Sections
- Graphic Protocol for the Preparation and Fluorescent IHC Staining of Paraffin-embedded Tissue Sections
- Graphic Protocol for the Preparation of Gelatin-coated Slides for Histological Tissue Sections
- IHC Sample Preparation (Frozen sections vs Paraffin)
- Immunofluorescent IHC Staining of Formalin-Fixed Paraffin-Embedded (FFPE) Tissue Protocol
- Immunohistochemistry (IHC) and Immunocytochemistry (ICC) Protocols
- Immunohistochemistry Frozen Troubleshooting
- Immunohistochemistry Paraffin Troubleshooting
- Preparing Samples for IHC/ICC Experiments
- Preventing Non-Specific Staining (Non-Specific Binding)
- Primary Antibody Selection & Optimization
- Protocol for Heat-Induced Epitope Retrieval (HIER)
- Protocol for Making a 4% Formaldehyde Solution in PBS
- Protocol for VisUCyte™ HRP Polymer Detection Reagent
- Protocol for the Preparation & Fixation of Cells on Coverslips
- Protocol for the Preparation and Chromogenic IHC Staining of Frozen Tissue Sections
- Protocol for the Preparation and Chromogenic IHC Staining of Frozen Tissue Sections - Graphic
- Protocol for the Preparation and Chromogenic IHC Staining of Paraffin-embedded Tissue Sections
- Protocol for the Preparation and Chromogenic IHC Staining of Paraffin-embedded Tissue Sections - Graphic
- Protocol for the Preparation and Fluorescent IHC Staining of Frozen Tissue Sections
- Protocol for the Preparation and Fluorescent IHC Staining of Paraffin-embedded Tissue Sections
- Protocol for the Preparation of Gelatin-coated Slides for Histological Tissue Sections
- R&D Systems Quality Control Western Blot Protocol
- TUNEL and Active Caspase-3 Detection by IHC/ICC Protocol
- The Importance of IHC/ICC Controls
- Troubleshooting Guide: Immunohistochemistry
- Troubleshooting Guide: Western Blot Figures
- Western Blot Conditions
- Western Blot Protocol
- Western Blot Protocol for Cell Lysates
- Western Blot Troubleshooting
- Western Blot Troubleshooting Guide
- View all Protocols, Troubleshooting, Illustrated assays and Webinars
Loading...