Endomucin (endothelial sialomucin; also Endomucin-1/2 and Mucin-14) is an 80‑120 kDa glycoprotein member of the Endomucin family of proteins. It is expressed on endothelial cells and depending upon its glycosylation pattern, can serve as either a pro- or anti-adhesive molecule. Mouse Endomucin precursor is 261 amino acids in length. It is type I transmembrane protein that contains a 170 aa extracellular domain (ECD) (aa 21‑190) and a 50 aa cytoplasmic region. Three splice variants exist in the ECD. One shows a deletion of aa 91‑141, a second shows a one aa substitution for aa 91‑129, and a third shows a one aa substitution for aa 129‑142. Over
aa 21‑90, mouse Endomucin shares 60% and 30% aa identity with rat and human Endomucin, respectively.

Key Product Details
Validated by
Biological Validation
Species Reactivity
Validated:
Mouse
Cited:
Human, Mouse, Transgenic Mouse
Applications
Validated:
Western Blot, Flow Cytometry, Immunocytochemistry, CyTOF-ready
Cited:
Immunohistochemistry, Immunohistochemistry-Paraffin, Immunohistochemistry-Frozen, Western Blot, Flow Cytometry
Label
Unconjugated
Antibody Source
Polyclonal Goat IgG
Loading...
Product Specifications
Immunogen
E. coli-derived recombinant mouse Endomucin
Glu21-Glu90
Accession # Q9R0H2
Glu21-Glu90
Accession # Q9R0H2
Specificity
Detects mouse Endomucin in direct ELISAs and Western blots. In direct ELISAs, less than 5% cross-reactivity with recombinant human Endomucin-2 is observed.
Clonality
Polyclonal
Host
Goat
Isotype
IgG
Scientific Data Images for Mouse Endomucin Antibody
Detection of Mouse Endomucin by Western Blot.
Western blot shows lysates of mouse kidney tissue, mouse lung tissue, and mouse ovary tissue. PVDF membrane was probed with 1 µg/mL of Goat Anti-Mouse Endomucin Antigen Affinity-purified Polyclonal Antibody (Catalog # AF4666) followed by HRP-conjugated Anti-Goat IgG Secondary Antibody (Catalog # HAF017). A specific band was detected for Endomucin at approximately 75-85 kDa (as indicated). This experiment was conducted under reducing conditions and using Immunoblot Buffer Group 1.
Endomucin in bEnd.3 Mouse Cell Line.
Endomucin was detected in immersion fixed bEnd.3 mouse endothelioma cell line using Goat Anti-Mouse Endomucin Antigen Affinity-purified Polyclonal Antibody (Catalog # AF4666) at 10 µg/mL for 3 hours at room temperature. Cells were stained using the NorthernLights™ 493-conjugated Anti-Goat IgG Secondary Antibody (green; Catalog # NL003) and counterstained with DAPI (blue). Specific staining was localized to cytoplasm. View our protocol for Fluorescent ICC Staining of Cells on Coverslips.
Detection of Endomucin in bEnd.3 Mouse Cell Line by Flow Cytometry.
bEnd.3 mouse endothelioma cell line was stained with Goat Anti-Mouse Endomucin Antigen Affinity-purified Polyclonal Antibody (Catalog # AF4666, filled histogram) or isotype control antibody (Catalog # AB-108-C, open histogram), followed by Allophycocyanin-conjugated Anti-Goat IgG Secondary Antibody (Catalog # F0108).
Detection of Mouse Endomucin/Mucin -14 by Immunocytochemistry/Immunofluorescence
MLK2/3-deficient mice exhibit defects in native collateral artery formation.(A) Representative confocal images (n = 5 mice) of control and MLK2/3-deficient whole mount P6 adductor muscle vasculature stained with antibodies to endomucin (capillary and venous vasculature, red) and SMA (arterial and venous smooth muscle, green). Gracilis collateral arteries in WT mice, but not MLK2/3-deficient mice, interconnect the PCFA to the SA. (B) Representative stereomicroscope images of P6 whole mount abdominal muscle stained with an antibody to SMA (green). Arteriole-to-arteriole arcades are indicated (red arrows). The abdominal muscle vasculature of Map3k10-/-Map3k11-/- mice shows very few arteriole-to-arteriole interconnections. Quantitation reveals significantly reduced arteriolar arcade numbers in Map3k10-/-Map3k11-/- mice compared to WT mice (mean ± SEM; n = 5 mice). Source data are included as Figure 3—source data 1.DOI:https://dx.doi.org/10.7554/eLife.18414.02310.7554/eLife.18414.024Figure 3—source data 1.Source data for Figure 3.This file contains raw source data used to make the graphs presented in Figure 3.DOI:https://dx.doi.org/10.7554/eLife.18414.024Source data for Figure 3.This file contains raw source data used to make the graphs presented in Figure 3.DOI:https://dx.doi.org/10.7554/eLife.18414.024 Image collected and cropped by CiteAb from the following publication (https://pubmed.ncbi.nlm.nih.gov/27504807), licensed under a CC-BY license. Not internally tested by R&D Systems.
Detection of Mouse Endomucin/Mucin -14 by Immunocytochemistry/Immunofluorescence
NOX2 contributes to the oxidative stress of bone ECs and the damage of angiogenesis-osteogenesis coupling. (A) qPCR analysis of the relative mRNA levels of three critical NOXs, involved in endothelial oxidative injuries, in the ECs in tibia metaphysis. T1DM mice were intraperitoneally injected with GKT137831 (NOX1/4 inhibitor) or one of the two NOX2 inhibitors, NOX2ds-tat (NOX2ds) and GSK2795039 (GSK), or VAS2870 (VAS, a pan-NOX inhibitor) once every two days from week 4 through 8. The levels of blood glucose (B), insulin (C) and body weight (D) during treatments were tested. (E) Confocal images of immunostained tibia sections show the CD31+Emcn+ type H vessels in the metaphysis at week 8. Scale bar: 50 μm on the above and 20 μm on the below. (F and G) Histomorphometric quantitation of the vessels in proximal tibia metaphysis. Flow cytometry quantification of type H ECs and total ECs in 8-week-old tibia (H). (I) Flow cytometry analysis of intracellular DCF fluorescence shows the ROS levels in the ECs in 8-week-old tibia. (B)-(D), n = 15-16 per group; other panels, n = 7-8 per group. ###p < 0.001 vs. Control group; *p < 0.05, **p < 0.01 and ***p < 0.001 vs. DM+veh group. One-way or two-way ANOVA followed by Tukey posttest analysis. Image collected and cropped by CiteAb from the following publication (https://pubmed.ncbi.nlm.nih.gov/33664862), licensed under a CC-BY license. Not internally tested by R&D Systems.
Detection of Mouse Endomucin/Mucin -14 by Immunocytochemistry/Immunofluorescence
The effects of anti-oxidant treatments on the bone blood vessels of T1DM mice. T1D mice received intraperitoneal injection of an anti-oxidant, N-acetyl cysteine (NAC) or tempol (TPO), once every other day from week 4 through 8. (A) Flow cytometry analysis of the general ROS levels in the bone ECs from 8-week-old tibia by detecting intracellular DCF fluorescence. The levels of blood glucose (B), insulin (C) and body weight (D). (E) Tibia length at week 8. (F) Confocal images of CD31 (green) and Emcn (red) immunostained tibia sections show type H vessels in the tibia metaphysis at week 8. Scale bar: 50 μm on the above and 20 μm on the below. Histomorphometric quantitation of the area fraction of vessel columns (G) and the number of vascular buds per growth plate length (H). Flow cytometry quantification of type H ECs (I) and total ECs (J) in 8-week-old tibia. (K) qPCR analysis of the representative cytokines mediating the coupling of angiogenesis and osteogenesis in 8-week-old tibia. (B)-(D), n = 15-16 per group; other panels, n = 7-8 per group. *p < 0.05, **p < 0.01 and ***p < 0.001. One-way or two-way ANOVA followed by Tukey posttest analysis. Image collected and cropped by CiteAb from the following publication (https://pubmed.ncbi.nlm.nih.gov/33664862), licensed under a CC-BY license. Not internally tested by R&D Systems.
Detection of Mouse Endomucin/Mucin -14 by Immunocytochemistry/Immunofluorescence
Endothelial JNK-deficient mice display abnormal native collateral arteries.(A,B) Representative confocal images (n = 7 mice) of whole mount adductor muscle vasculature reveals SMA-covered gracilis collateral arteries in P6 control mice, but not JNK-deficient mice (A). Confocal imaging of Dil perfused P6 adductor muscle vasculature (n = 5 mice) demonstrates distinct gracilis collaterals interconnecting the PCFA to the SA in control mice. Vessels emerging from the PCFA and the SA in E3KO mice do not fully interconnect, but branch into smaller vessels. At P0, gracilis collaterals were not SMA-covered, but were perfused with Dil in control mice (B). The analogous vessels in E3KO mice did not interconnect, but branched extensively into smaller vessels (B) (n = 5 mice). (C) Representative stereomicroscope images of Dil-perfused abdominal muscle arterial vasculature of control and JNK-deficient P0 mice. Arteriole-to-arteriole arcades (indicated by red arrows) were quantitated (mean ± SEM; n = 3 mice). (D) Representative confocal images (n = 3~4 mice) of whole mount adductor muscles of control and JNK-deficient E16.5 embryos showing GFP-labeled vascular endothelial cells. (E) Representative confocal images (n = 3~5 mice) of control and JNK-deficient E16.5 embryo adductor muscle vasculature immunostained for Endomucin (Emcn, red) and isolectinB4 (iB4, green). Prominent vessels emerging from the PCFA and SA are indicated with white arrowheads. Source data are included as Figure 5—source data 1.DOI:https://dx.doi.org/10.7554/eLife.18414.02710.7554/eLife.18414.028Figure 5—source data 1.Source data for Figure 5.This file contains raw source data used to make the graphs presented in Figure 5.DOI:https://dx.doi.org/10.7554/eLife.18414.028Source data for Figure 5.This file contains raw source data used to make the graphs presented in Figure 5.DOI:https://dx.doi.org/10.7554/eLife.18414.028Intimate association of gracilis collaterals and peripheral nerves in adductor muscles.Confocal
Detection of Mouse Endomucin/Mucin -14 by Immunocytochemistry/Immunofluorescence
The effects of insulin therapy on the bone blood vessels of T1DM mice. Drug therapy with high dose (hi, 0.5 U/mouse) or low dose (lo, 0.05 U/mouse) of insulin (ins) or the combination of insulin and a relatively low dose of GSK2795039 (GSK, a NOX2 inhibitor, 2 mM) was conducted in two time courses: started immediately after the confirmation of DM and once per day in week 4 to 8 (4-8w); started at week 6 and performed once per day in week 6 to 8 (6-8w). The levels of blood glucose (A) and body weight (B) were examined at week 4, 6 and 8, with HbA1c (C) tested at week 8. (D) Confocal images of immunostained tibia sections show CD31+ (green) and Emcn+ (red) type H vessels in the metaphysis. Scale bar: 50 μm on the above and 20 μm on the below. Histomorphometric quantitation as the area fraction of vessel columns (E) and the number of vascular buds per growth plate length (F). (G) Flow cytometry quantification of type H ECs and total ECs in 8-week-old tibia. For drug treatments, T1DM model was induced by STZ injection at 80 mg/kg (namely DM-G2). (A)-(C), n = 15-16 per group; (E)-(G), n = 6-8 per group. *p < 0.05, **p < 0.01 and ***p < 0.001 vs. DM+veh group; #p < 0.05, ##p < 0.01 and ###p < 0.001 vs. DM+ins hi 6-8w group; &p < 0.05, &&p < 0.01 and &&&p < 0.001 vs. DM+ins lo 4-8w group. One-way or two-way ANOVA followed by Tukey posttest analysis. Image collected and cropped by CiteAb from the following publication (https://pubmed.ncbi.nlm.nih.gov/33664862), licensed under a CC-BY license. Not internally tested by R&D Systems.
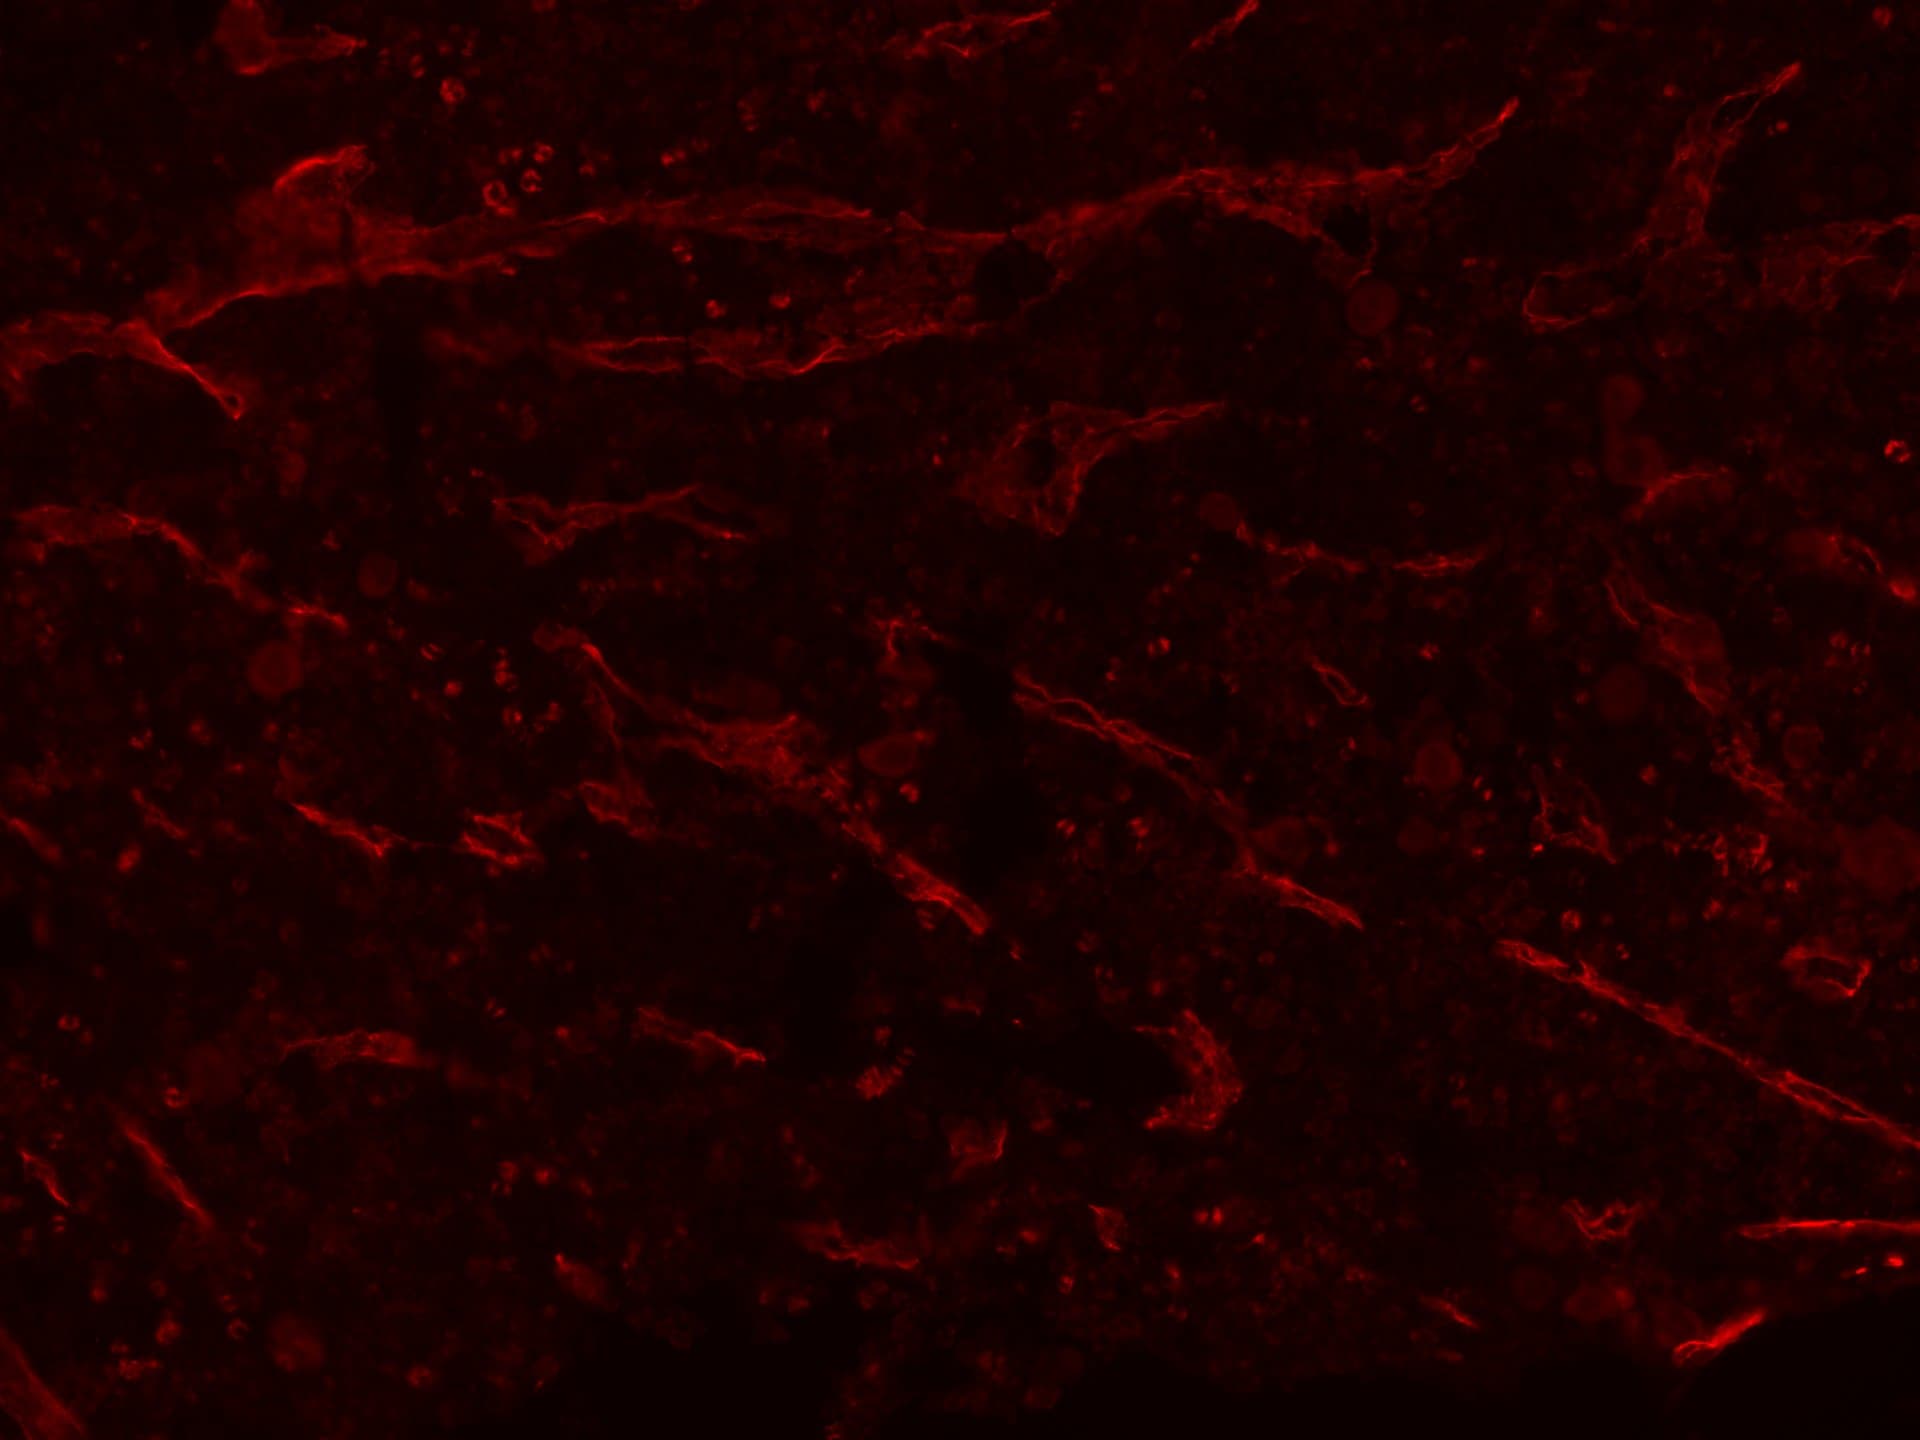
Detection of Mouse Endomucin/Mucin -14 by Immunohistochemistry
VE-cadherin expression is retained in the vasculature of affected organs in CYP19A1(Tg)Cre; Cdh5fl/fl embryos.(A) Immunofluorescence staining of E12.5 Control and CYP19A1(Tg)Cre; Cdh5fl/fl brains for VE-cadherin (green) and Endomucin (red) at sites of hemorrhage. Images in gray scale are VE-cadherin alone. Red arrowheads point to extravascular autofluorescent erythrocytes. Yellow arrowheads point to VE-cadherin+ vessels. Scale bars = 50 μm. (B) Immunofluorescence staining of E12.5 Control and CYP19A1(Tg)Cre; Cdh5fl/fl hearts for VE-cadherin (green) and Endomucin (red). Images in gray scale are VE-cadherin alone. Red arrowheads point to VE-cadherin+ developing coronary vessels. Yellow arrowheads point to VE-cadherin+ endocardium. Scale bars = 50 μm. (C) Immunofluorescence staining of E12.5 Control and CYP19A1(Tg)Cre; Cdh5fl/fl hearts for VE-cadherin (green), Endomucin (red), and LYVE1 (gray). Images in gray scale represent VE-cadherin pixels colocalized with either LYVE1 (liver) or Endomucin (lungs and thorax). Red arrowheads point to LYVE1+VE-cadherin+ liver sinusoidal vessels. Yellow arrowheads point to Endomucin+VE-cadherin+ lung and thoracic blood vessels. Scale bars = 200 μm. (D) Quantification of fold change in VE-cadherin mean fluorescence intensity in the brain, heart, liver, lungs, and thorax.Figure 1—figure supplement 3—source data 1.Excel file containing quantification for VE-cadherin expression in various organs in Figure 1—figure supplement 3.Excel file containing quantification for VE-cadherin expression in various organs in Figure 1—figure supplement 3. Image collected and cropped by CiteAb from the following open publication (https://pubmed.ncbi.nlm.nih.gov/35486098), licensed under a CC-BY license. Not internally tested by R&D Systems.
Detection of Mouse Endomucin/Mucin -14 by Immunohistochemistry
VE-cadherin is required in trophoblasts to remodel spiral arteries (SAs)&to displace SA endothelium.(A) Immunofluorescence staining of E12.5 Control&CYP19A1(Tg)Cre; Cdh5fl/fl placentas for Endomucin (green)&alpha-smooth muscle actin ( alpha SMA) (red). White arrowheads indicate alpha SMA+ cells. Scale bars = 25 μm. Image collected & cropped by CiteAb from the following open publication (https://pubmed.ncbi.nlm.nih.gov/35486098), licensed under a CC-BY license. Not internally tested by R&D Systems.
Detection of Mouse Endomucin/Mucin -14 by Immunohistochemistry
Loss of trophoblast VE-cadherin causes defects in brain, liver, and heart development.(A) Sagittal hematoxylin and eosin (H&E) sections from E12.5 Control and CYP19A1(Tg)Cre; Cdh5fl/fl embryos. Boxes show magnified regions of the brain, heart, and liver. Note the thinness of the myocardium in CYP19A1(Tg)Cre; Cdh5fl/fl embryos. Dotted red line outlines the liver contour. Green arrowhead points to tissue degradation in the brains of CYP19A1(Tg)Cre; Cdh5fl/fl embryos. (B) Quantification of the liver area as a percent of total embryo area. Control n = 4, CYP19A1(Tg)Cre; Cdh5fl/fl n = 3. (C, D) Immunofluorescence staining of E12.5 Control and CYP19A1(Tg)Cre; Cdh5fl/fl embryonic hearts for Endomucin (green) and alpha-smooth muscle actin ( alpha SMA) (red). Insets demonstrate myocardial thinning and quantified in (D). Control n = 11, CYP19A1(Tg)Cre; Cdh5fl/fl n = 5. Scale bars = 200 μm. Statistical analysis was performed using two-tailed, unpaired Welch’s t-test. Data are shown as means ± SD.Figure 1—figure supplement 2—source data 1.Excel file containing quantification for liver area and myocardial thickness in Figure 1—figure supplement 2.Excel file containing quantification for liver area and myocardial thickness in Figure 1—figure supplement 2. Image collected and cropped by CiteAb from the following open publication (https://pubmed.ncbi.nlm.nih.gov/35486098), licensed under a CC-BY license. Not internally tested by R&D Systems.
Detection of Mouse Endomucin/Mucin -14 by Immunohistochemistry
VE-cadherin is required in trophoblasts to remodel spiral arteries (SAs)&to displace SA endothelium. (G, H) Maximum intensity projections of whole-mount immunofluorescence of the decidua (G)&labyrinth (H) from 200 μm thick placenta sections stained for Endomucin (green), TER119 (red),&CK8 (magenta). Double-headed arrows indicate differences in lumen size. White arrowheads indicate Endomucin+ SA ECs. Red arrowheads indicate maternal red blood cells within the trophoblast-lined vessels. Yellow arrowheads indicate fetal red blood cells within fetal capillaries. Dotted white line demarcates the decidua from the junctional zone. Scale bars = 50 μm. Statistical analysis was performed using two-tailed, unpaired Welch’s t-test. Data are shown as means ± SD.Figure 2—source data 1.Excel file containing quantification for smooth muscle cells per spiral artery, spiral artery diameter,&trophoblast-endothelial cell displacement in Figure 2.Excel file containing quantification for smooth muscle cells per spiral artery, spiral artery diameter,&trophoblast-endothelial cell displacement in Figure 2. Image collected & cropped by CiteAb from the following open publication (https://pubmed.ncbi.nlm.nih.gov/35486098), licensed under a CC-BY license. Not internally tested by R&D Systems.
Detection of Mouse Endomucin/Mucin -14 by Immunohistochemistry
Deletion of VE-cadherin in trophoblasts disrupts cell migration resulting in placental&fetal growth restriction. (I–L) Hematoxylin&eosin (H&E) staining&immunofluorescence staining for Endomucin (green), CK8 (red),&TER119 (gray) of E12.5 Control (I, J)&CYP19A1(Tg)Cre; Cdh5fl/fl (K, L) serial placenta sections. Dotted lines demarcate the different placental regions. Red arrowheads indicate trophoblasts. Green arrowheads indicate spiral arteries (SA). White arrowheads indicate maternal red blood cells (RBCs). Note fewer non-nucleated, maternal TER119+ cells in the labyrinth region of CYP19A1(Tg)Cre; Cdh5fl/fl placentas. Boxes on the left correlate with magnified images on the right,&boxes in H&E&immunofluorescence images are of the same region. Scale bars = 500 μm. Dec (decidua), JZ (junctional zone), Lab (labyrinth). Image collected & cropped by CiteAb from the following open publication (https://pubmed.ncbi.nlm.nih.gov/35486098), licensed under a CC-BY license. Not internally tested by R&D Systems.
Detection of Mouse Endomucin/Mucin -14 by Immunohistochemistry
VE-cadherin is required in trophoblasts to remodel spiral arteries (SAs)&to displace SA endothelium.(D) Immunofluorescence staining of E12.5 Control&CYP19A1(Tg)Cre; Cdh5fl/fl placentas for Endomucin (green)&CK8 (red). White arrowheads indicate Endomucin+ SA endothelial cells (ECs). Positive signal in small, rounded cells in the lumen is the result of erythrocyte autofluorescence. Image collected & cropped by CiteAb from the following open publication (https://pubmed.ncbi.nlm.nih.gov/35486098), licensed under a CC-BY license. Not internally tested by R&D Systems.
Detection of Mouse Endomucin/Mucin -14 by Immunohistochemistry
Disrupting trophoblast migration results in decidual extracellular matrix defects.(A) Mmp15 mRNA gene expression in control and CYP19A1(Tg)Cre; Cdh5fl/fl placentas from RNA-sequencing (RNA-seq). (B) Immunofluorescence staining for Endomucin (green), CK8 (red), and MMP15 (gray) in E12.5 Control and CYP19A1(Tg)Cre; Cdh5fl/fl placentas. White arrowheads point to MMP15+CK8+ trophoblasts which are more abundant in control placentas relative compared to CYP19A1(Tg)Cre; Cdh5fl/fl placentas, particularly around spiral arteries (SA), but there is no difference in MMP15 intensity in trophoblasts. Dotted line demarcates the border of the junctional zone and decidua. Positive yellow signal in small, rounded cells in the SA lumen is the result of erythrocyte autofluorescence. Scale bars = 100 μm. (C) Immunofluorescence staining for laminin (red) and CK8 (green) and quantification of fold change in laminin mean fluorescence intensity in the stroma. In control placentas, laminin is expressed in trophoblasts surrounding SAs but absent in stromal cells compared to CYP19A1(Tg)Cre; Cdh5fl/fl placentas. Scale bars = 50 μm. (D) Immunofluorescence staining for CK8 (green), vinculin (red), and TER119 (gray) and quantification of fold change in vinculin mean fluorescence intensity in trophoblasts. Scale bars = 25 μm. Statistical analysis was performed using two-tailed, unpaired Welch’s t-test. Data are shown as means ± SD.Figure 4—figure supplement 1—source data 1.Excel file containing quantification for Mmp15 gene expression, laminin expression in the decidua, and vinculin expression in trophoblasts in Figure 4—figure supplement 1.Excel file containing quantification for Mmp15 gene expression, laminin expression in the decidua, and vinculin expression in trophoblasts in Figure 4—figure supplement 1. Image collected and cropped by CiteAb from the following open publication (https://pubmed.ncbi.nlm.nih.gov/35486098), licensed under a CC-BY license. Not internally tested by R&D Systems.Applications for Mouse Endomucin Antibody
Application
Recommended Usage
CyTOF-ready
Ready to be labeled using established conjugation methods. No BSA or other carrier proteins that could interfere with conjugation.
Flow Cytometry
0.25 µg/106 cells
Sample: bEnd.3 mouse endothelioma cell line
Sample: bEnd.3 mouse endothelioma cell line
Immunocytochemistry
5-15 µg/mL
Sample: Immersion fixed bEnd.3 mouse endothelioma cell line
Sample: Immersion fixed bEnd.3 mouse endothelioma cell line
Western Blot
1 µg/mL
Sample: Mouse kidney tissue, mouse lung tissue, and mouse ovary tissue
Sample: Mouse kidney tissue, mouse lung tissue, and mouse ovary tissue
Reviewed Applications
Read 1 review rated 4 using AF4666 in the following applications:
Flow Cytometry Panel Builder
Bio-Techne Knows Flow Cytometry
Save time and reduce costly mistakes by quickly finding compatible reagents using the Panel Builder Tool.
Advanced Features
- Spectra Viewer - Custom analysis of spectra from multiple fluorochromes
- Spillover Popups - Visualize the spectra of individual fluorochromes
- Antigen Density Selector - Match fluorochrome brightness with antigen density

Formulation, Preparation, and Storage
Purification
Antigen Affinity-purified
Reconstitution
Reconstitute at 0.2 mg/mL in sterile PBS. For liquid material, refer to CoA for concentration.
Loading...
Formulation
Lyophilized from a 0.2 μm filtered solution in PBS with Trehalose. *Small pack size (SP) is supplied either lyophilized or as a 0.2 µm filtered solution in PBS.
Shipping
Lyophilized product is shipped at ambient temperature. Liquid small pack size (-SP) is shipped with polar packs. Upon receipt, store immediately at the temperature recommended below.
Stability & Storage
Use a manual defrost freezer and avoid repeated freeze-thaw cycles.
- 12 months from date of receipt, -20 to -70 °C as supplied.
- 1 month, 2 to 8 °C under sterile conditions after reconstitution.
- 6 months, -20 to -70 °C under sterile conditions after reconstitution.
Calculators
Background: Endomucin
Alternate Names
EMCN, EMCN2, MUC-14
Gene Symbol
EMCN
UniProt
Additional Endomucin Products
Product Documents for Mouse Endomucin Antibody
Certificate of Analysis
To download a Certificate of Analysis, please enter a lot or batch number in the search box below.
Note: Certificate of Analysis not available for kit components.
Product Specific Notices for Mouse Endomucin Antibody
For research use only
Related Research Areas
Citations for Mouse Endomucin Antibody
 Powered by Bioz
Customer Reviews for Mouse Endomucin Antibody (1)
4 out of 5
1 Customer Rating
Have you used Mouse Endomucin Antibody?
Submit a review and receive an Amazon gift card!
$25/€18/£15/$25CAN/¥2500 Yen for a review with an image
$10/€7/£6/$10CAN/¥1110 Yen for a review without an image
Submit a review
Customer Images
Showing
1
-
1 of
1 review
Showing All
Filter By:
-
Application: Immunocytochemistry/ImmunofluorescenceSample Tested: bone marrowSpecies: MouseVerified Customer | Posted 08/31/2018

There are no reviews that match your criteria.
Protocols
Find general support by application which include: protocols, troubleshooting, illustrated assays, videos and webinars.
- 7-Amino Actinomycin D (7-AAD) Cell Viability Flow Cytometry Protocol
- Appropriate Fixation of IHC/ICC Samples
- Cellular Response to Hypoxia Protocols
- ClariTSA™ Fluorophore Kits
- Detection & Visualization of Antibody Binding
- Extracellular Membrane Flow Cytometry Protocol
- Flow Cytometry Protocol for Cell Surface Markers
- Flow Cytometry Protocol for Staining Membrane Associated Proteins
- Flow Cytometry Staining Protocols
- Flow Cytometry Troubleshooting Guide
- ICC Cell Smear Protocol for Suspension Cells
- ICC Immunocytochemistry Protocol Videos
- ICC for Adherent Cells
- Immunocytochemistry (ICC) Protocol
- Immunocytochemistry Troubleshooting
- Immunofluorescence of Organoids Embedded in Cultrex Basement Membrane Extract
- Immunohistochemistry (IHC) and Immunocytochemistry (ICC) Protocols
- Intracellular Flow Cytometry Protocol Using Alcohol (Methanol)
- Intracellular Flow Cytometry Protocol Using Detergents
- Intracellular Nuclear Staining Flow Cytometry Protocol Using Detergents
- Intracellular Staining Flow Cytometry Protocol Using Alcohol Permeabilization
- Intracellular Staining Flow Cytometry Protocol Using Detergents to Permeabilize Cells
- Preparing Samples for IHC/ICC Experiments
- Preventing Non-Specific Staining (Non-Specific Binding)
- Primary Antibody Selection & Optimization
- Propidium Iodide Cell Viability Flow Cytometry Protocol
- Protocol for Liperfluo
- Protocol for VisUCyte™ HRP Polymer Detection Reagent
- Protocol for the Characterization of Human Th22 Cells
- Protocol for the Characterization of Human Th9 Cells
- Protocol for the Fluorescent ICC Staining of Cell Smears - Graphic
- Protocol for the Fluorescent ICC Staining of Cultured Cells on Coverslips - Graphic
- Protocol for the Preparation and Fluorescent ICC Staining of Cells on Coverslips
- Protocol for the Preparation and Fluorescent ICC Staining of Non-adherent Cells
- Protocol for the Preparation and Fluorescent ICC Staining of Stem Cells on Coverslips
- Protocol for the Preparation of a Cell Smear for Non-adherent Cell ICC - Graphic
- Protocol: Annexin V and PI Staining by Flow Cytometry
- Protocol: Annexin V and PI Staining for Apoptosis by Flow Cytometry
- R&D Systems Quality Control Western Blot Protocol
- TUNEL and Active Caspase-3 Detection by IHC/ICC Protocol
- The Importance of IHC/ICC Controls
- Troubleshooting Guide: Fluorokine Flow Cytometry Kits
- Troubleshooting Guide: Western Blot Figures
- Western Blot Conditions
- Western Blot Protocol
- Western Blot Protocol for Cell Lysates
- Western Blot Troubleshooting
- Western Blot Troubleshooting Guide
- View all Protocols, Troubleshooting, Illustrated assays and Webinars
Loading...