Mouse Lipocalin-2/NGAL Antibody
R&D Systems | Catalog # AF1857

Key Product Details
Validated by
Biological Validation
Species Reactivity
Validated:
Mouse
Cited:
Human, Mouse, Rat, Transgenic Mouse
Applications
Validated:
Immunohistochemistry, Western Blot, Simple Western, Immunoprecipitation
Cited:
Immunohistochemistry, Immunohistochemistry-Paraffin, Immunohistochemistry-Frozen, Western Blot, Neutralization, Immunocytochemistry, Immunoprecipitation, Bioassay, ELISA Development, Westen Blot
Label
Unconjugated
Antibody Source
Polyclonal Goat IgG
Loading...
Product Specifications
Immunogen
Mouse myeloma cell line NS0-derived recombinant mouse Lipocalin-2/NGAL
Gln21-Asn200
Accession # P11672
Gln21-Asn200
Accession # P11672
Specificity
Detects mouse Lipocalin-2/NGAL in direct ELISAs and Western blots.
Clonality
Polyclonal
Host
Goat
Isotype
IgG
Scientific Data Images for Mouse Lipocalin-2/NGAL Antibody
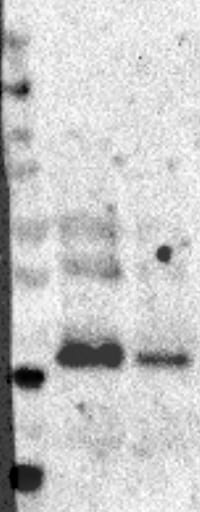
Detection of Mouse Lipocalin‑2/NGAL by Western Blot.
Western blot shows lysates of mouse uterus tissue. PVDF membrane was probed with 0.25 µg/mL of Goat Anti-Mouse Lipocalin-2/NGAL Antigen Affinity-purified Polyclonal Antibody (Catalog # AF1857) followed by HRP-conjugated Anti-Goat IgG Secondary Antibody (HAF017). A specific band was detected for Lipocalin-2/NGAL at approximately 24 kDa (as indicated). This experiment was conducted under reducing conditions and using Immunoblot Buffer Group 1.
Lipocalin‑2/NGAL in Mouse Mammary Gland.
Lipocalin-2/NGAL was detected in perfusion fixed frozen sections of mouse mammary gland using Goat Anti-Mouse Lipocalin-2/NGAL Antigen Affinity-purified Polyclonal Antibody (Catalog # AF1857) at 3 µg/mL for 1 hour at room temperature followed by incubation with the Anti-Goat IgG VisUCyte™ HRP Polymer Antibody (VC004). Tissue was stained using DAB (brown) and counterstained with hematoxylin (blue). Specific staining was localized to extracellular areas in ducts. View our protocol for IHC Staining with VisUCyte HRP Polymer Detection Reagents.
Detection of Mouse Lipocalin‑2/NGAL by Simple WesternTM.
Simple Western lane view shows lysates of mouse lung tissue, loaded at 0.2 mg/mL. A specific band was detected for Lipocalin-2/NGAL at approximately 37 kDa (as indicated) using 5 µg/mL of Goat Anti-Mouse Lipocalin-2/NGAL Antigen Affinity-purified Polyclonal Antibody (Catalog # AF1857) followed by 1:50 dilution of HRP-conjugated Anti-Goat IgG Secondary Antibody (Catalog # HAF109). This experiment was conducted under reducing conditions and using the 12-230 kDa separation system.
Detection of Mouse Lipocalin-2/NGAL by Western Blot
Human and murine C/EBP-epsilon induces expression of HNP-1 in primary bone marrow (BM) cells from transgenic HNP-1 mice.Murine BM cells from seven transgenic HNP-1 mice were isolated and early granulocyte precursors isolated by density centrifugation on a discontinuous Percoll 1.072 gradient. Cells were retrovirally transduced with an empty expression vector (pMIG) or with a vector expressing either human or murine C/EBP-epsilon (pMIG-CEBPE or pMIG-Cebpe respectively). Cells were incubated for 48 hours. (A) Green fluorescent protein (GFP) was used as reporter gene in the vectors and transduction efficiency evaluated by flow cytometry. (B–G) Comparative quantification of mRNA for CCAAT/enhancer binding protein-epsilon (human CEBPE or murine Cebpe), human neutrophil peptide-1 (DEFA1), cathelicidin antimicrobial peptide (Camp), and lipocalin-2 (Lcn2) was done by real-time PCR using Gapdh as normalizer. Error bars depict standard deviation. (B, E–G) Levels are shown as fold induction by either murine Cebpe (mCebpe) or human CEBPE (hCEBPE) compared to levels from negative control transduction (pMIG). (C) Relative quantification of human CEBPE in murine bone marrow cells from four transgenic HNP-1 mice transduced with control vector (pMIG) or human CEBPE. (D) Expression of murine Cebpe in Cebpe transduced cells were compared to human CEBPE in CEBPE transduced cells by comparing Delta Ct between the transduced gene and Gapdh. The transduced mouse with the lowest expression of C/EBP-epsilon was used as calibrator. (H) Western blotting of C/EBP-epsilon, 24p3, and beta-actin in transduced cells from two mice. (I–J) Cells were fixed in formaldehyde. Cell and nuclear membranes were lysed before fragmentation of DNA by sonication. Chromatin was immunoprecipitated using protein A/G magnetic beads and an antibody against C/EBP-epsilon, C/EBP-alpha, or negative control rabbit IgG. After washing procedures, immune complexes were eluted and reversed and DNA recovered. DNA was used as a template for quantitative PCR. Primer
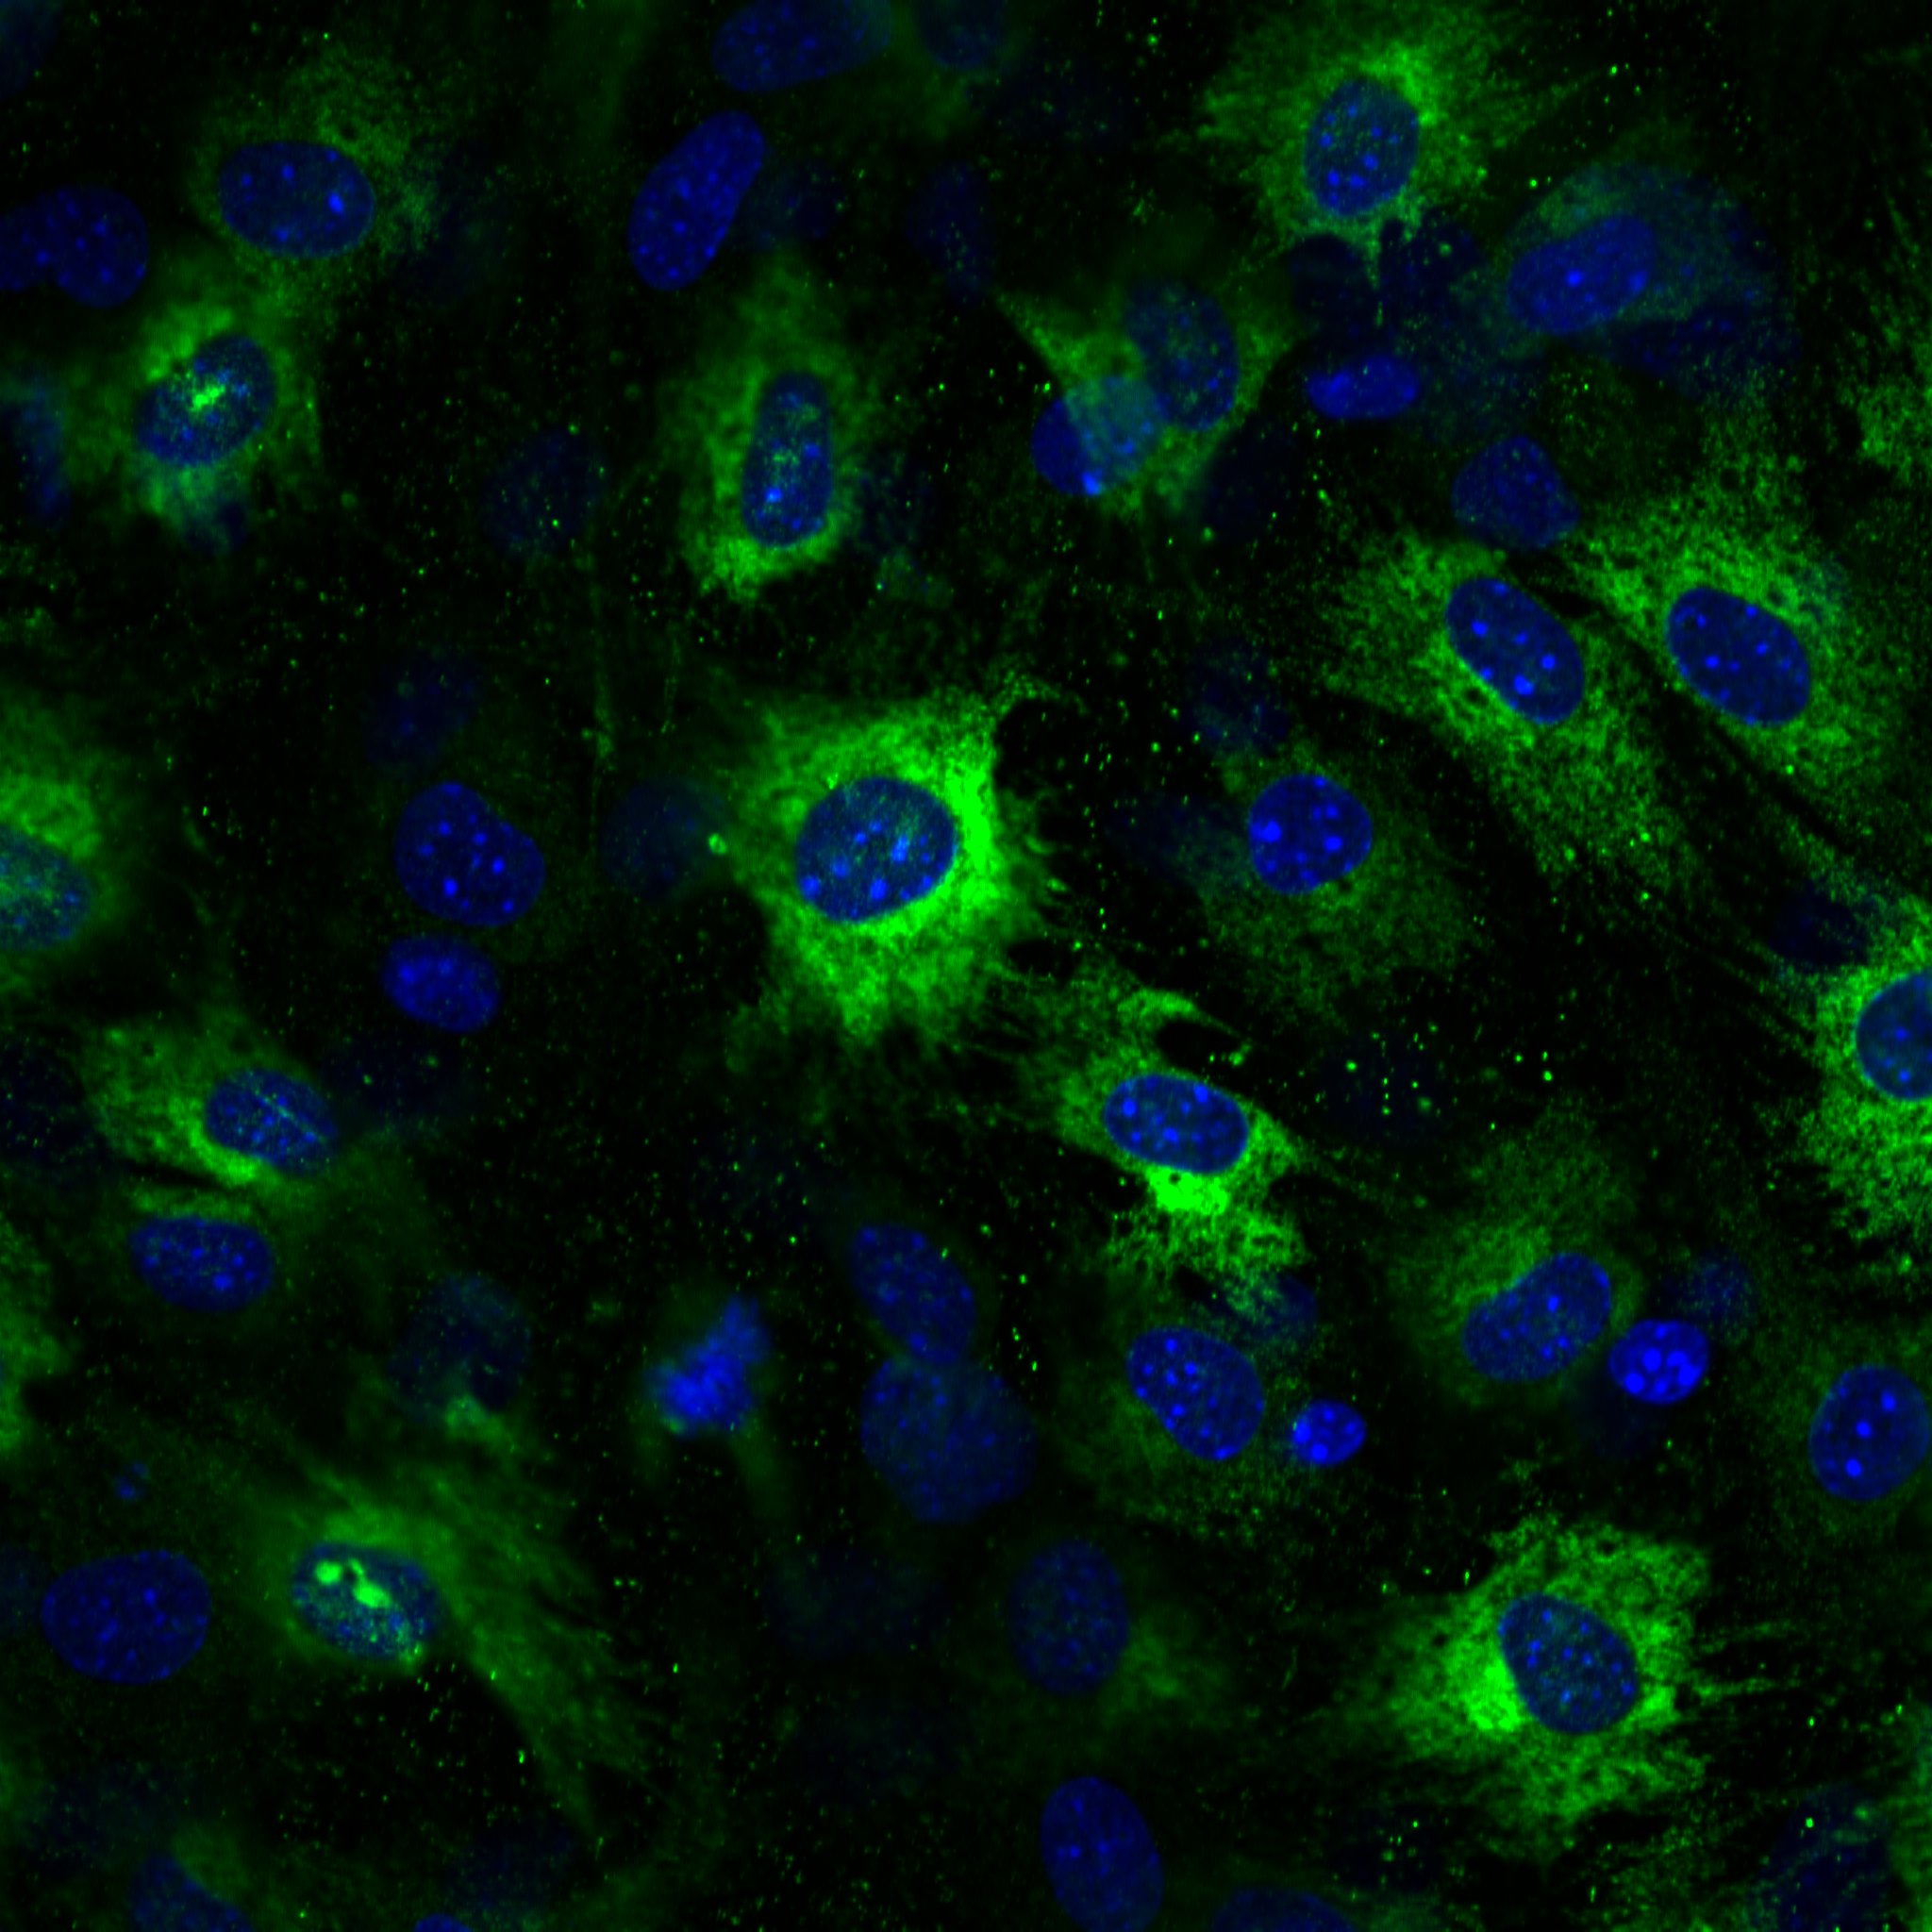
Detection of Mouse Lipocalin-2/NGAL by Immunocytochemistry/Immunofluorescence
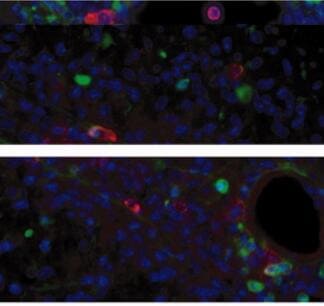
Immunolocalization of LCN2 in astrocytes and neutrophils in the ipsilateral cortex after tMCAo. Mouse brain slices isolated at 23 h after tMCAo were labeled with LCN2 antibody (green, A), Tomato Lectin (red, blood vessel, B), and GFAP antibody (blue, astrocyte, C). (D) Merged image showing the expression of LCN2 in an astrocyte whose end-feet encircle blood vessels (arrowheads). Brain slices isolated at 23 h after tMCAo were stained with antibodies recognizing LCN2 (green, E) and a specific marker for neutrophils (anti-Ly-6B.2 clone 7/4) (red, F). Nuclei were labeled with DAPI (blue, G). (H) Merged image showing the colocalization of LCN2 with 7/4 in yellow. The shaded area in the inset indicates the infarcted region. (I) The percentage of LCN2-positive cell types (n = 5). Scale bars, 10 μm (A–D), 50 μm (E–H). Image collected and cropped by CiteAb from the following publication (https://pubmed.ncbi.nlm.nih.gov/32872405), licensed under a CC-BY license. Not internally tested by R&D Systems.
Detection of Mouse Lipocalin-2/NGAL by Western Blot
Keap1 hypomorphs demonstrated unequivocal protection 10 days after ischemia-reperfusion injury (IRI).Keap1 hypomorphs (KEAP1) and wild type (WT) mice were subjected to unilateral renal IRI, with a contralateral nephrectomy performed 24 hours prior to sacrifice at 10 days. (a) Kidney sections were subjected to Masson’s Trichrome staining to evaluate for fibrosis development (collagen appears blue). WT mice also had more inflammatory cells. Low powered views are shown along with an enlarged inset of the boxed area. Bar equals 100 μm. Picrosirius red was also performed – under light microscopy collagen and other cellular components stain red. With polarized light of the same sections shown on light microscopy, birefringence is highly specific for collagen. (b) Keap1 hypomorphs had significantly decreased fibrosis, which was confirmed with fibrosis scoring (n = 5–6 for each group). (c,d) Serum creatinine and BUN were significantly reduced in the hypomorphs. Each dot represents an individual mouse with the mean ± SEM superimposed. (e,f) qRT-PCR for KIM-1 and NGAL shows significant reduction in these tubular injury markers in IRI KEAP1 kidneys compared to IRI WT kidneys. Brackets show significant differences, P < 0.05. (g) NGAL was significantly suppressed in the IRI KEAP1 kidneys compared to IRI WT kidneys, confirming the qRT-PCR result in (f). (P < 0.05, compared to similarly treated WT group). Image collected and cropped by CiteAb from the following publication (https://www.nature.com/articles/srep36185), licensed under a CC-BY license. Not internally tested by R&D Systems.
Detection of Mouse Lipocalin-2/NGAL by Western Blot
LCN2 monoclonal antibody (mAb) specifically immunoprecipitated recombinant and endogenous LCN2 proteins. (A) Representative Western blots showing that LCN2 mAb reduced the level of LCN2 protein by immunoprecipitation. Increasing concentrations of LCN2 mAb (0, 0.1, 0.5, and 2.5 μg) bound to the Dynabeads were incubated with a fixed amount of mouse recombinant LCN2 protein (0.1 μg). LCN2 mAb bound to the Dynabeads, immunoprecipitated LCN2 protein, and unbound LCN2 protein in the supernatant after the immunoprecipitation are shown in the top, middle, and bottom panels, respectively; (B,C) LCN2 mAb specifically immunoprecipitated the LCN2 protein that was induced after tMCAo. Ipsilateral hemisphere lysates (B) and blood sera (C) collected from naive LCN2+/+ and LCN2−/− mice (+/+ con and −/− con) and at 23 h after tMCAo (+/+ tMCAo and −/− tMCAo) were immunoprecipitated with LCN2 mAb and analyzed by Western blotting using a polyclonal antibody that recognized LCN2 protein; (D) Total RNA isolated from ipsilateral hemispheres of naive LCN2+/+ and LCN2−/− mice (+/+ con and −/− con), at 23 h after tMCAo (+/+ tMCAo and −/− tMCAo), and LCN2+/+ mice treated with LCN2 mAb at 4 h after tMCAo (+/+ tMCAo LCN2 mAb) was analyzed by real-time RT-PCR (n = 6 per group). Relative mRNA expression of LCN2 in the brain homogenates was compared between the mice groups using a one-way ANOVA and Newman–Keuls post hoc tests. LCN2 mRNA levels were significantly induced after tMCAo (*** p < 0.001) as compared with those in naive LCN2+/+ mice. LCN2 mRNA levels in mice that were treated with LCN2 mAb were significantly reduced (* p < 0.05) as compared those in LCN2+/+ mice after tMCAo; (E,F) Mice were treated with an isotype control IgG (con) or LCN2 mAb at 4 h after tMCAo. We analyzed the concentration of LCN2 in the ipsilateral hemispheres (n = 5 per group, E) and blood sera (n = 9–10 per group, F) at 23 h after reperfusion using ELISA. The concentration of LCN2 in the brains of mice treated with
Detection of Mouse Lipocalin-2/NGAL by Western Blot
Keap1 hypomorphs have improved renal function 3 days after ischemia-reperfusion injury (IRI).Wild type (WT) and hypomorph mice (KEAP1) were subjected to unilateral renal IRI, with a contralateral nephrectomy performed 24 hours prior to sacrifice at 3 days. (a,b) Histologic assessment of kidneys showed significant tubular injury with no perceptible difference between groups. Bar equals 100 μm. (c,d) Serum creatinine and BUN were significantly improved in the hypomorphs in spite of the lack of histologic differences. Each dot represents an individual animal with mean ± SEM shown. (e,f) qRT-PCR showed no significant reductions in proinflammatory mediators (n = 4–5 in each group). (g,h) qRT-PCR analysis of tubular injury markers KIM-1 and NGAL showed a significant increase (KIM-1) or trend to increase (NGAL) in injured kidneys vs CTL uninjured kidneys, but no significant difference between injured WT and KEAP1 kidneys. (j) Western blot and densitometry for NGAL confirms no decrease in NGAL in injured KEAP1 kidneys compared to injured WT kidneys. (*P < 0.05 compared to the wild type group. **P < 0.05 compared to either CTL group). Image collected and cropped by CiteAb from the following publication (https://www.nature.com/articles/srep36185), licensed under a CC-BY license. Not internally tested by R&D Systems.
Detection of Mouse Lipocalin-2/NGAL by Immunocytochemistry/Immunofluorescence
Histological characterization of mammary tumors.A, C, E, immunohistochemical staining for lipocalin-2 in mammary tumor in (A) PyMT, Lcn2+/+ mouse, (C) PyMT, Lcn2−/−, and (E) PyMT, Lcn2+/+ mouse as negative control, where no primary antibody was added. B, D, F, immunohistochemical staining for MMP-9 in mammary tumor in (B) PyMT, Lcn2+/+ mouse, (D) PyMT, Lcn2−/−, and (F) PyMT, Lcn2+/+ mouse as negative control, where no primary antibody was added. Original magnification x600. G, H+E staining of tumor from a PyMT, Lcn2+/+ mouse representing largest metastasis volume. F, H+E staining of tumor from PyMT, Lcn2−/− mouse representing largest metastasis volume. In both G and F strongly atypical tumor cells with numerous mitoses are seen, and surrounded by slender strands of collagen tissue. Original magnification x630. Abbreviations: PyMT: MMTV-PyMT. Image collected and cropped by CiteAb from the following publication (https://dx.plos.org/10.1371/journal.pone.0039646), licensed under a CC-BY license. Not internally tested by R&D Systems.
Detection of Mouse Lipocalin-2/NGAL by Immunocytochemistry/Immunofluorescence
Immunolocalization of LCN2 in astrocytes and neutrophils in the ipsilateral cortex after tMCAo. Mouse brain slices isolated at 23 h after tMCAo were labeled with LCN2 antibody (green, A), Tomato Lectin (red, blood vessel, B), and GFAP antibody (blue, astrocyte, C). (D) Merged image showing the expression of LCN2 in an astrocyte whose end-feet encircle blood vessels (arrowheads). Brain slices isolated at 23 h after tMCAo were stained with antibodies recognizing LCN2 (green, E) and a specific marker for neutrophils (anti-Ly-6B.2 clone 7/4) (red, F). Nuclei were labeled with DAPI (blue, G). (H) Merged image showing the colocalization of LCN2 with 7/4 in yellow. The shaded area in the inset indicates the infarcted region. (I) The percentage of LCN2-positive cell types (n = 5). Scale bars, 10 μm (A–D), 50 μm (E–H). Image collected and cropped by CiteAb from the following publication (https://pubmed.ncbi.nlm.nih.gov/32872405), licensed under a CC-BY license. Not internally tested by R&D Systems.
Detection of Mouse Lipocalin-2/NGAL by Western Blot
LCN2 monoclonal antibody (mAb) specifically immunoprecipitated recombinant and endogenous LCN2 proteins. (A) Representative Western blots showing that LCN2 mAb reduced the level of LCN2 protein by immunoprecipitation. Increasing concentrations of LCN2 mAb (0, 0.1, 0.5, and 2.5 μg) bound to the Dynabeads were incubated with a fixed amount of mouse recombinant LCN2 protein (0.1 μg). LCN2 mAb bound to the Dynabeads, immunoprecipitated LCN2 protein, and unbound LCN2 protein in the supernatant after the immunoprecipitation are shown in the top, middle, and bottom panels, respectively; (B,C) LCN2 mAb specifically immunoprecipitated the LCN2 protein that was induced after tMCAo. Ipsilateral hemisphere lysates (B) and blood sera (C) collected from naive LCN2+/+ and LCN2−/− mice (+/+ con and −/− con) and at 23 h after tMCAo (+/+ tMCAo and −/− tMCAo) were immunoprecipitated with LCN2 mAb and analyzed by Western blotting using a polyclonal antibody that recognized LCN2 protein; (D) Total RNA isolated from ipsilateral hemispheres of naive LCN2+/+ and LCN2−/− mice (+/+ con and −/− con), at 23 h after tMCAo (+/+ tMCAo and −/− tMCAo), and LCN2+/+ mice treated with LCN2 mAb at 4 h after tMCAo (+/+ tMCAo LCN2 mAb) was analyzed by real-time RT-PCR (n = 6 per group). Relative mRNA expression of LCN2 in the brain homogenates was compared between the mice groups using a one-way ANOVA and Newman–Keuls post hoc tests. LCN2 mRNA levels were significantly induced after tMCAo (*** p < 0.001) as compared with those in naive LCN2+/+ mice. LCN2 mRNA levels in mice that were treated with LCN2 mAb were significantly reduced (* p < 0.05) as compared those in LCN2+/+ mice after tMCAo; (E,F) Mice were treated with an isotype control IgG (con) or LCN2 mAb at 4 h after tMCAo. We analyzed the concentration of LCN2 in the ipsilateral hemispheres (n = 5 per group, E) and blood sera (n = 9–10 per group, F) at 23 h after reperfusion using ELISA. The concentration of LCN2 in the brains of mice treated with
Detection of Mouse Lipocalin-2/NGAL by Immunocytochemistry/Immunofluorescence
Immunolocalization of LCN2 in vascular endothelial cells in the ipsilateral cortex after transient middle cerebral artery occlusion (tMCAo). Brain slices isolated from naive mice (A–C) and at 23 h after tMCAo (D–L) were labeled with LCN2 antibody (green), tomato lectin (red, blood vessel), and GFAP antibody (blue, astrocyte). (D) Neutrophils detected within the blood vessel (arrowheads) and in ischemic brain parenchyma (arrows) labeled with LCN2 antibody (green). (G–L) Merged and amplified images showing the induction of LCN2 (green) on the inner surface of vascular endothelial cells (red) surrounded by astrocytic end-feet (blue). The shaded area in the inset indicates the infarcted region. Scale bars, 50 μm for the main images (A–I), and 10 μm for the amplified images (J–L). Image collected and cropped by CiteAb from the following publication (https://pubmed.ncbi.nlm.nih.gov/32872405), licensed under a CC-BY license. Not internally tested by R&D Systems.
Detection of Mouse Lipocalin-2/NGAL by Immunocytochemistry/Immunofluorescence
LCN2 mAb attenuated neurological deficits and cerebral infarction after tMCAo. Neurological deficit scoring (A) and corner test (B) were performed at 20 h after one hour of tMCAo in mice treated with isotype control IgG (con) and LCN2 mAb (n = 7 per group). (C) Representative images of TTC-stained brain slices from mice treated with control IgG and LCN2 mAb after 23 h of reperfusion. Viable tissue is stained in red color, whereas the infarcted area remains unstained (white). Total infarct volume (D) and brain swelling percentage (E) in mice treated with LCN2 mAb were significantly decreased 23 h after reperfusion as compared with those in mice treated with the control IgG (n = 5 per group). ** p < 0.01, *** p < 0.001 compared with treatments with control IgG (two-tailed, unpaired t-test). Image collected and cropped by CiteAb from the following publication (https://pubmed.ncbi.nlm.nih.gov/32872405), licensed under a CC-BY license. Not internally tested by R&D Systems.
Detection of Mouse Lipocalin-2/NGAL by Immunocytochemistry/Immunofluorescence
Histological characterization of mammary tumors.A, C, E, immunohistochemical staining for lipocalin-2 in mammary tumor in (A) PyMT, Lcn2+/+ mouse, (C) PyMT, Lcn2−/−, and (E) PyMT, Lcn2+/+ mouse as negative control, where no primary antibody was added. B, D, F, immunohistochemical staining for MMP-9 in mammary tumor in (B) PyMT, Lcn2+/+ mouse, (D) PyMT, Lcn2−/−, and (F) PyMT, Lcn2+/+ mouse as negative control, where no primary antibody was added. Original magnification x600. G, H+E staining of tumor from a PyMT, Lcn2+/+ mouse representing largest metastasis volume. F, H+E staining of tumor from PyMT, Lcn2−/− mouse representing largest metastasis volume. In both G and F strongly atypical tumor cells with numerous mitoses are seen, and surrounded by slender strands of collagen tissue. Original magnification x630. Abbreviations: PyMT: MMTV-PyMT. Image collected and cropped by CiteAb from the following publication (https://dx.plos.org/10.1371/journal.pone.0039646), licensed under a CC-BY license. Not internally tested by R&D Systems.
Detection of Mouse Mouse Lipocalin-2/NGAL Antibody by Western Blot
Keap1 hypomorphs demonstrated unequivocal protection 10 days after ischemia-reperfusion injury (IRI).Keap1 hypomorphs (KEAP1) and wild type (WT) mice were subjected to unilateral renal IRI, with a contralateral nephrectomy performed 24 hours prior to sacrifice at 10 days. (a) Kidney sections were subjected to Masson’s Trichrome staining to evaluate for fibrosis development (collagen appears blue). WT mice also had more inflammatory cells. Low powered views are shown along with an enlarged inset of the boxed area. Bar equals 100 μm. Picrosirius red was also performed – under light microscopy collagen and other cellular components stain red. With polarized light of the same sections shown on light microscopy, birefringence is highly specific for collagen. (b) Keap1 hypomorphs had significantly decreased fibrosis, which was confirmed with fibrosis scoring (n = 5–6 for each group). (c,d) Serum creatinine and BUN were significantly reduced in the hypomorphs. Each dot represents an individual mouse with the mean ± SEM superimposed. (e,f) qRT-PCR for KIM-1 and NGAL shows significant reduction in these tubular injury markers in IRI KEAP1 kidneys compared to IRI WT kidneys. Brackets show significant differences, P < 0.05. (g) NGAL was significantly suppressed in the IRI KEAP1 kidneys compared to IRI WT kidneys, confirming the qRT-PCR result in (f). (P < 0.05, compared to similarly treated WT group). Image collected and cropped by CiteAb from the following publication (https://pubmed.ncbi.nlm.nih.gov/27804998), licensed under a CC-BY license. Not internally tested by R&D Systems.
Detection of Lipocalin-2/NGAL by Western Blot
Effects of LCN2 deletion on microglial activation and hippocampal TREM2 expression in HFD/STZ-induced diabetic mice: (A,B) Western blot analysis and quantification of LCN2, TREM2, and NF-kappa Bp65 in the hippocampus; beta -actin and p84 were used as loading controls for total protein and nuclear protein, respectively; (C) representative immunofluorescence images of TREM2 (red) and Iba-1 (green) in hippocampal sections; DAPI (blue) was used to stain nuclei; scale bar = 10 µm; (D) quantification of co-localized TREM2 and Iba-1-immunostained cells in the images. CTL: control; DM: diabetic mice. Data are presented as the mean ± SEM. The indicated p-values represent a two-way ANOVA, followed by Tukey’s post hoc test. * p < 0.05 vs. WT CTL. † p < 0.05 vs. WT DM. Image collected and cropped by CiteAb from the following open publication (https://pubmed.ncbi.nlm.nih.gov/35884685), licensed under a CC-BY license. Not internally tested by R&D Systems.
Detection of Lipocalin-2/NGAL by Western Blot
Elucidation of kidney injury markers and MAPK signaling following rhabdomyolysis. Mice were administered 7.5 ml/kg body weight of 50% glycerol in water and harvested after 1 or 3 days. Kidneys were analyzed for the expression of (A) kidney injury molecule-1 (KIM-1), (B) neutrophil gelatinase associated lipocalin (NGAL), and (C) ferritin heavy chain (FtH) by real-time PCR analysis. Each experiment was performed at least three independent times. Results were normalized to GAPDH and presented as mean ± SEM. *p < 0.05 vs. baseline control; #p < 0.05 vs. FtHfl/fl. (D) Kidneys were analyzed for the expression of 4-hydroxynonenal, NGAL, KIM-1, FtH, p-ERK, total ERK, p-JNK, and total JNK by Western blot analysis. Membranes were stripped and re-probed for GAPDH to demonstrate equal loading. (E) Expression of the indicated proteins in the kidneys was analyzed by densitometry, normalized to GAPDH (or total JNK or total ERK) and expressed as mean ± SEM. *p < 0.05 vs. baseline control; #p < 0.05 vs. FtHfl/fl. Image collected and cropped by CiteAb from the following open publication (https://pubmed.ncbi.nlm.nih.gov/36160140), licensed under a CC-BY license. Not internally tested by R&D Systems.
Detection of Lipocalin-2/NGAL by Western Blot
Effects of LCN2 deletion on hepatic TREM2 expression in HFD/STZ-induced diabetic mice: (A,B) Western blot analysis and quantitation of LCN2, TNF- alpha, and TREM2 proteins in liver lysates. beta -actin was used as loading control; (C) representative immunofluorescence images of TREM2 (red) and F4/80 (green) in liver sections; CV: central vein; (D) quantification of co-localized TREM2 and F4/80-immunostained cells in the images; (E) representative immunofluorescence images of TREM2 (red) and Ly6G (green) in liver section; quantification of co-localized TREM2 and Ly6G-immunostained cells in the images; scale bar = 10 µm. DAPI (blue) was used to stain nuclei. CTL: control; DM: diabetic mice. Data are presented as the mean ± SEM. The indicated p-values represent a two-way ANOVA, followed by Tukey’s post hoc test. * p < 0.05 vs. WT CTL. † p < 0.05 vs. WT DM. Image collected and cropped by CiteAb from the following open publication (https://pubmed.ncbi.nlm.nih.gov/35884685), licensed under a CC-BY license. Not internally tested by R&D Systems.
Detection of Lipocalin-2/NGAL by Western Blot
Effects of LCN2 deletion on microglial activation and hippocampal TREM2 expression in HFD/STZ-induced diabetic mice: (A,B) Western blot analysis and quantification of LCN2, TREM2, and NF-kappa Bp65 in the hippocampus; beta -actin and p84 were used as loading controls for total protein and nuclear protein, respectively; (C) representative immunofluorescence images of TREM2 (red) and Iba-1 (green) in hippocampal sections; DAPI (blue) was used to stain nuclei; scale bar = 10 µm; (D) quantification of co-localized TREM2 and Iba-1-immunostained cells in the images. CTL: control; DM: diabetic mice. Data are presented as the mean ± SEM. The indicated p-values represent a two-way ANOVA, followed by Tukey’s post hoc test. * p < 0.05 vs. WT CTL. † p < 0.05 vs. WT DM. Image collected and cropped by CiteAb from the following open publication (https://pubmed.ncbi.nlm.nih.gov/35884685), licensed under a CC-BY license. Not internally tested by R&D Systems.
Detection of Lipocalin-2/NGAL by Western Blot
Elucidation of kidney injury markers and MAPK signaling following rhabdomyolysis. Mice were administered 7.5 ml/kg body weight of 50% glycerol in water and harvested after 1 or 3 days. Kidneys were analyzed for the expression of (A) kidney injury molecule-1 (KIM-1), (B) neutrophil gelatinase associated lipocalin (NGAL), and (C) ferritin heavy chain (FtH) by real-time PCR analysis. Each experiment was performed at least three independent times. Results were normalized to GAPDH and presented as mean ± SEM. *p < 0.05 vs. baseline control; #p < 0.05 vs. FtHfl/fl. (D) Kidneys were analyzed for the expression of 4-hydroxynonenal, NGAL, KIM-1, FtH, p-ERK, total ERK, p-JNK, and total JNK by Western blot analysis. Membranes were stripped and re-probed for GAPDH to demonstrate equal loading. (E) Expression of the indicated proteins in the kidneys was analyzed by densitometry, normalized to GAPDH (or total JNK or total ERK) and expressed as mean ± SEM. *p < 0.05 vs. baseline control; #p < 0.05 vs. FtHfl/fl. Image collected and cropped by CiteAb from the following open publication (https://pubmed.ncbi.nlm.nih.gov/36160140), licensed under a CC-BY license. Not internally tested by R&D Systems.
Detection of Lipocalin-2/NGAL by Western Blot
Identification of LCN2 MAM localization and PA binding capability.LCN2 is recruited to the MAM in inguinal adipocytes (a) in response to 6 h LPS (1 μg/mL) treatment and in BAT (b) in response to 6 h LPS stimulation along with known MAM proteins including FACL4, MFN2 and DRP1. The experiments in a and b were repeated 3 times independently. LCN2 protein levels in cytosolic, crude mitochondria, pure mitochondria, and MAM fractions in BAT of mice with saline, 6 h LPS (0.3 mg/kg body weight), or 6 h CL316, 243 (0.5 mg/kg body weight) treatment (c). The experiment in c was repeated twice independently. Co-localization of LCN2 with ER marker Calnexin (d) and mitochondrial maker TOM 20 (e) in 3T3-L1 preadipocytes and adipocytes. The correlation analysis was performed using Pearson’s coefficient. For the co-localization of LCN2 with ER, n = 16 for preadipocytes and n = 13 for adipocytes (d). For the co-localization of LCN2 with mitochondria, n = 13 for preadipoctes and n = 11 for adipocytes (d). Results are presented as mean ± SEM. Binding assay of membrane lipids with mouse LCN2 recombinant protein (f). Concentration-dependent binding of LCN2 to phospholipids (g). Various concentrations of PA and PC were spotted on the membrane and subjected to LCN2 binding assay. Cell lysates from 3T3-L1 adipocytes with or without IL-1 beta (1 ng/mL) treatment were spotted as a positive control. Concentration-dependent LCN2-PA binding with PA-coated beads (h). Beads without PA-coated served as a control. The experiment in h was repeated twice independently. Source data are provided as a Source data file. Mito: mitochondria; CL: CL316, 243. Image collected and cropped by CiteAb from the following open publication (https://pubmed.ncbi.nlm.nih.gov/37872178), licensed under a CC-BY license. Not internally tested by R&D Systems.Applications for Mouse Lipocalin-2/NGAL Antibody
Application
Recommended Usage
Immunohistochemistry
3-15 µg/mL
Sample: Perfusion fixed frozen sections of mouse mammary gland
Sample: Perfusion fixed frozen sections of mouse mammary gland
Immunoprecipitation
25 µg/mL
Sample: Conditioned cell culture medium spiked with Recombinant Mouse Lipocalin‑2/NGAL (Catalog # 1857-LC), see our available Western blot detection antibodies
Sample: Conditioned cell culture medium spiked with Recombinant Mouse Lipocalin‑2/NGAL (Catalog # 1857-LC), see our available Western blot detection antibodies
Simple Western
5 µg/mL
Sample: Mouse lung tissue
Sample: Mouse lung tissue
Western Blot
0.25 µg/mL
Sample: Mouse uterus tissue
Sample: Mouse uterus tissue
Reviewed Applications
Read 6 reviews rated 5 using AF1857 in the following applications:
Formulation, Preparation, and Storage
Purification
Antigen Affinity-purified
Reconstitution
Reconstitute at 0.2 mg/mL in sterile PBS. For liquid material, refer to CoA for concentration.
Loading...
Formulation
Lyophilized from a 0.2 μm filtered solution in PBS with Trehalose. *Small pack size (SP) is supplied either lyophilized or as a 0.2 µm filtered solution in PBS.
Shipping
Lyophilized product is shipped at ambient temperature. Liquid small pack size (-SP) is shipped with polar packs. Upon receipt, store immediately at the temperature recommended below.
Stability & Storage
Use a manual defrost freezer and avoid repeated freeze-thaw cycles.
- 12 months from date of receipt, -20 to -70 °C as supplied.
- 1 month, 2 to 8 °C under sterile conditions after reconstitution.
- 6 months, -20 to -70 °C under sterile conditions after reconstitution.
Calculators
Background: Lipocalin-2/NGAL
References
- Hraba-Renevey, S. et al. (1989) Oncogene. 4:601.
- Liu, Q. et al. (1993) Mol Reprod Dev. 46:507.
- Kjeldsen L, et al. (2000) Biochim Biophys Acta. 1482:272.
- Devireddy, L.R. et al. (2001) Science 293:829.
- Yang, M.B. et al. (2002) Mol. Cell. 10:1045.
- Goetz, D.H. et al. (2002) Mol. Cell 10:1033.
- Flo, T.H. et al. (2004) Nature 432:917.
- Hanai, J. et al. (2005) J. Biol. Chem. 280:13641.
Long Name
Neutrophil Gelatinase-associated Lipocalin
Alternate Names
24p3, LCN2, Lipocalin2, MSFI, NGAL, Oncogene 24p3, p25, Siderocalin, Uterocalin
Gene Symbol
LCN2
UniProt
Additional Lipocalin-2/NGAL Products
Product Documents for Mouse Lipocalin-2/NGAL Antibody
Certificate of Analysis
To download a Certificate of Analysis, please enter a lot or batch number in the search box below.
Note: Certificate of Analysis not available for kit components.
Product Specific Notices for Mouse Lipocalin-2/NGAL Antibody
For research use only
Related Research Areas
Citations for Mouse Lipocalin-2/NGAL Antibody
 Powered by Bioz
Customer Reviews for Mouse Lipocalin-2/NGAL Antibody (6)
5 out of 5
6 Customer Ratings
Have you used Mouse Lipocalin-2/NGAL Antibody?
Submit a review and receive an Amazon gift card!
$25/€18/£15/$25CAN/¥2500 Yen for a review with an image
$10/€7/£6/$10CAN/¥1110 Yen for a review without an image
Submit a review
Customer Images
Showing
1
-
5 of
6 reviews
Showing All
Filter By:
-
Application: Western BlotSample Tested: Colon tissueSpecies: MouseVerified Customer | Posted 10/01/2024

-
Application: Immunocytochemistry/ImmunofluorescenceSample Tested: Brain tissueSpecies: MouseVerified Customer | Posted 11/06/2020
-
Application: Immunocytochemistry/ImmunofluorescenceSample Tested: Differentiated osteoblastsSpecies: MouseVerified Customer | Posted 02/16/2018incubated O/N with AF-1857 (1:500) at 4oC.
-
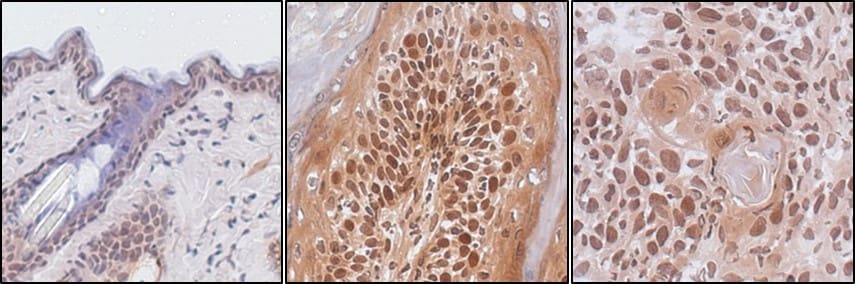
Application: ImmunohistochemistrySample Tested: skin tumorSpecies: MouseVerified Customer | Posted 05/03/2017Lcn2 immunohistochemistry was performed on DMBA/TPA-induced mouse skin tumor frozen sections. Left, normal skin; middle, papilloma; right, SCC.
-
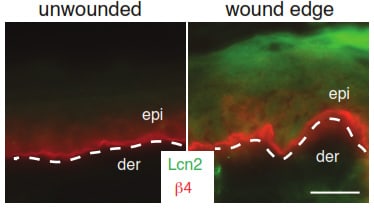
Application: ImmunocytochemistrySample Tested: mouse skin and Mouse KeratinocytesSpecies: MouseVerified Customer | Posted 05/03/2017Five days post wounding, Lcn2 is induced at wound edges of mouse skin.
-
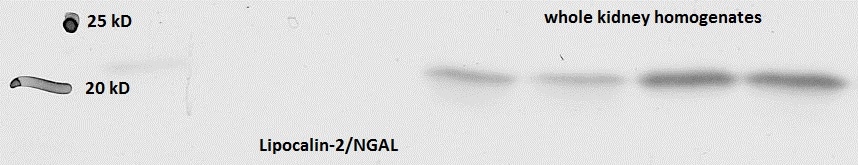
Application: Western BlotSample Tested: Kidney tissueSpecies: MouseVerified Customer | Posted 01/06/2017
There are no reviews that match your criteria.
Protocols
Find general support by application which include: protocols, troubleshooting, illustrated assays, videos and webinars.
- Antigen Retrieval Protocol (PIER)
- Antigen Retrieval for Frozen Sections Protocol
- Appropriate Fixation of IHC/ICC Samples
- Cellular Response to Hypoxia Protocols
- Chromogenic IHC Staining of Formalin-Fixed Paraffin-Embedded (FFPE) Tissue Protocol
- Chromogenic Immunohistochemistry Staining of Frozen Tissue
- ClariTSA™ Fluorophore Kits
- Detection & Visualization of Antibody Binding
- Fluorescent IHC Staining of Frozen Tissue Protocol
- Graphic Protocol for Heat-induced Epitope Retrieval
- Graphic Protocol for the Preparation and Fluorescent IHC Staining of Frozen Tissue Sections
- Graphic Protocol for the Preparation and Fluorescent IHC Staining of Paraffin-embedded Tissue Sections
- Graphic Protocol for the Preparation of Gelatin-coated Slides for Histological Tissue Sections
- IHC Sample Preparation (Frozen sections vs Paraffin)
- Immunofluorescent IHC Staining of Formalin-Fixed Paraffin-Embedded (FFPE) Tissue Protocol
- Immunohistochemistry (IHC) and Immunocytochemistry (ICC) Protocols
- Immunohistochemistry Frozen Troubleshooting
- Immunohistochemistry Paraffin Troubleshooting
- Immunoprecipitation Protocol
- Preparing Samples for IHC/ICC Experiments
- Preventing Non-Specific Staining (Non-Specific Binding)
- Primary Antibody Selection & Optimization
- Protocol for Heat-Induced Epitope Retrieval (HIER)
- Protocol for Making a 4% Formaldehyde Solution in PBS
- Protocol for VisUCyte™ HRP Polymer Detection Reagent
- Protocol for the Preparation & Fixation of Cells on Coverslips
- Protocol for the Preparation and Chromogenic IHC Staining of Frozen Tissue Sections
- Protocol for the Preparation and Chromogenic IHC Staining of Frozen Tissue Sections - Graphic
- Protocol for the Preparation and Chromogenic IHC Staining of Paraffin-embedded Tissue Sections
- Protocol for the Preparation and Chromogenic IHC Staining of Paraffin-embedded Tissue Sections - Graphic
- Protocol for the Preparation and Fluorescent IHC Staining of Frozen Tissue Sections
- Protocol for the Preparation and Fluorescent IHC Staining of Paraffin-embedded Tissue Sections
- Protocol for the Preparation of Gelatin-coated Slides for Histological Tissue Sections
- R&D Systems Quality Control Western Blot Protocol
- TUNEL and Active Caspase-3 Detection by IHC/ICC Protocol
- The Importance of IHC/ICC Controls
- Troubleshooting Guide: Immunohistochemistry
- Troubleshooting Guide: Western Blot Figures
- Western Blot Conditions
- Western Blot Protocol
- Western Blot Protocol for Cell Lysates
- Western Blot Troubleshooting
- Western Blot Troubleshooting Guide
- View all Protocols, Troubleshooting, Illustrated assays and Webinars
Loading...