Key Product Details

Validated by

Knockout/Knockdown

Species Reactivity

Validated:

Human, Mouse, Rat, Hamster

Cited:

Human, Mouse, Rat, Bat, Canine, Civet, Ferret, Golden Syrian Hamster, Hamster, Hamster - Mesocricetus auratus (Golden Hamster), Mink, Non Human Primates, Primate, Primate - Cercopithecus aethiops (African Green Monkey), Primate - Chlorocebus aethiops (African Green Monkey), Primate - Chlorocebus pygerythrus (Vervet Monkey), Primate - Macaca mulatta (Rhesus Macaque), Syrian Hamster, Transgenic Mouse, Xenograft, Zebrafish

Applications

Validated:

Immunohistochemistry, Western Blot, Blockade of Receptor-ligand Interaction, Flow Cytometry, Simple Western, Immunoprecipitation

Cited:

Immunohistochemistry, Immunohistochemistry-Paraffin, Immunohistochemistry-Frozen, Western Blot, Neutralization, Flow Cytometry, Immunocytochemistry, Simple Western, Bioassay, Co-Immunoprecipitation, Control, ELISA Capture, ELISA Detection, FACS, IF/IHC

Label

Unconjugated

Antibody Source

Polyclonal Goat IgG
Loading...

Product Specifications

Immunogen

Mouse myeloma cell line NS0-derived recombinant human ACE-2
Gln18-Ser740
Accession # Q9BYF1

Specificity

Detects human ACE-2 in direct ELISAs. Detects human, mouse, and rat ACE-2 in Western blots. Detects Hamster ACE-2 in immunohistochemistry.

Clonality

Polyclonal

Host

Goat

Isotype

IgG

Scientific Data Images for Human/Mouse/Rat/Hamster ACE‑2 Antibody

Detection of Human, Mouse, and Rat ACE‑2 antibody by Western Blot.

Detection of Human, Mouse, and Rat ACE‑2 by Western Blot.

Western blot shows lysates of human kidney tissue, mouse kidney tissue, and rat kidney tissue. PVDF membrane was probed with 1 µg/mL of Goat Anti-Human/Mouse/Rat/Hamster ACE-2 Antigen Affinity-purified Polyclonal Antibody (Catalog # AF933) followed by HRP-conjugated Anti-Goat IgG Secondary Antibody (Catalog # HAF017). A specific band was detected for ACE-2 at approximately 100 and 110 kDa (as indicated). This experiment was conducted under reducing conditions and using Western Blot Buffer Group 1.

Detection of ACE-2 antibody in HEK293 Human Cell Line Transfected with Human ACE-2 and eGFP antibody by Flow Cytometry.

Detection of ACE-2 in HEK293 Human Cell Line Transfected with Human ACE-2 and eGFP by Flow Cytometry.

HEK293 human embryonic kidney cell line transfected with (A) human ACE-2 or (B) irrelevant protein, and eGFP was stained with Goat Anti-Human/Mouse/Rat/Hamster ACE-2 Affinity Purified Polyclonal Antibody (Catalog # AF933) followed by Allophycocyanin-conjugated Anti-Goat IgG Secondary Antibody (F0108). Quadrant markers were set based on Goat IgG control antibody (AB-108-C, data not shown). Staining was performed using our Staining Membrane-associated Proteins protocol.

ACE-2 antibody in Human Kidney by Immunohistochemistry (IHC-P).

ACE‑2 in Human Kidney.

ACE-2 was detected in immersion fixed paraffin-embedded sections of human kidney using Goat Anti-Human/Mouse/Rat/Hamster ACE-2 Antigen Affinity-purified Polyclonal Antibody (Catalog # AF933) at 15 µg/mL overnight at 4 °C. Tissue was stained using the Anti-Goat HRP-DAB Cell & Tissue Staining Kit (brown; Catalog # CTS008) and counterstained with hematoxylin (blue). View our protocol for Chromogenic IHC Staining of Paraffin-embedded Tissue Sections.

ACE-2 antibody in Human Kidney by Immunohistochemistry (IHC-P).

ACE‑2 in Human Kidney.

ACE-2 was detected in immersion fixed paraffin-embedded sections of human kidney using Goat Anti-Human/Mouse/Rat/Hamster ACE-2 Antigen Affinity-purified Polyclonal Antibody (Catalog # AF933) at 15 µg/mL overnight at 4 °C. Tissue was stained using the Anti-Goat HRP-DAB Cell & Tissue Staining Kit (brown; Catalog # CTS008) and counterstained with hematoxylin (blue). Lower panel shows a lack of labeling if primary antibodies are omitted and tissue is stained only with secondary antibody followed by incubation with detection reagents. View our protocol for Chromogenic IHC Staining of Paraffin-embedded Tissue Sections.

ACE‑2 antibody in Hamster Lung by Immunohistochemistry (IHC-P).

ACE‑2 in Hamster Lung.

ACE‑2 was detected in immersion fixed paraffin-embedded sections of hamster lung using Goat Anti-Human/Mouse/Rat/Hamster ACE‑2 Antigen Affinity-purified Polyclonal Antibody (Catalog # AF933) at 3 µg/mL for 1 hour at room temperature followed by incubation with the Anti-Goat IgG VisUCyte™ HRP Polymer Antibody (VC004). Before incubation with the primary antibody, tissue was subjected to heat-induced epitope retrieval using Antigen Retrieval Reagent-Basic (CTS013). Tissue was stained using DAB (brown) and counterstained with hematoxylin (blue). Specific staining was localized to respiratory bronchioles. Staining was performed using our protocol for IHC Staining with VisUCyte HRP Polymer Detection Reagents.

ACE‑2 in Rat Lung.

ACE‑2 was detected in immersion fixed frozen sections of rat lung using Goat Anti-Human/Mouse/Rat/Hamster ACE‑2 Antigen Affinity-purified Polyclonal Antibody (Catalog # AF933) at 10 µg/mL for 1 hour at room temperature followed by incubation with the Anti-Goat IgG VisUCyte™ HRP Polymer Antibody (VC004). Before incubation with the primary antibody, tissue was subjected to heat-induced epitope retrieval using Antigen Retrieval Reagent-Basic (CTS013). Tissue was stained using DAB (brown) and counterstained with hematoxylin (blue). Specific staining was localized to cell surface in eputhelial cells in bronchioles. Staining was performed using our protocol for IHC Staining with VisUCyte HRP Polymer Detection Reagents.

ACE‑2 in Rat Lung.

ACE‑2 was detected in immersion fixed paraffin-embedded sections of rat lung using Goat Anti-Human/Mouse/Rat/Hamster ACE‑2 Antigen Affinity-purified Polyclonal Antibody (Catalog # AF933) at 10 µg/mL for 1 hour at room temperature followed by incubation with the Anti-Goat IgG VisUCyte™ HRP Polymer Antibody (VC004). Before incubation with the primary antibody, tissue was subjected to heat-induced epitope retrieval using Antigen Retrieval Reagent-Basic (CTS013). Tissue was stained using DAB (brown) and counterstained with hematoxylin (blue). Staining was performed using our protocol for IHC Staining with VisUCyte HRP Polymer Detection Reagents.

ACE‑2 in Rat Kidney.

ACE‑2 was detected in immersion fixed paraffin-embedded sections of rat kidney using Goat Anti-Human/Mouse/Rat/Hamster ACE‑2 Antigen Affinity-purified Polyclonal Antibody (Catalog # AF933) at 10 µg/mL for 1 hour at room temperature followed by incubation with the Anti-Goat IgG VisUCyte™ HRP Polymer Antibody (VC004). Before incubation with the primary antibody, tissue was subjected to heat-induced epitope retrieval using Antigen Retrieval Reagent-Basic (CTS013). Tissue was stained using DAB (brown) and counterstained with hematoxylin (blue). Specific staining was localized to cell surface in convoluted tubules. Staining was performed using our protocol for IHC Staining with VisUCyte HRP Polymer Detection Reagents.

Detection of Human ACE-2 antibody by Simple WesternTM.

Detection of Human ACE‑2 by Simple WesternTM.

Simple Western lane view shows lysates of human kidney tissue, loaded at 0.2 mg/mL. A specific band was detected for ACE-2 at approximately 155 kDa (as indicated) using 10 µg/mL of Goat Anti-Human/Mouse/Rat/Hamster ACE-2 Antigen Affinity-purified Polyclonal Antibody (Catalog # AF933) followed by 1:50 dilution of HRP-conjugated Anti-Goat IgG Secondary Antibody (Catalog # HAF109). This experiment was conducted under reducing conditions and using the 12-230 kDa separation system.

Detection of Human ACE-2 by Western Blot

Detection of Human ACE-2 by Western Blot

(A) Transduction of pLV pseudotyped with VSV-G (A,C) or CoV-2 Spike glycoprotein (B,D) in HEK293T (A,B) or Vero E6 (C,D) cells. The lentiviral backbone incorporates enhanced green fluorescent protein (eGFP) that is expressed upon integration into target cells. The fluorescence was recorded at 48 h post transduction. Magnification 4X. (E) Transduction efficiency of pLV pseudotyped with CoV-2 Spike glycoprotein in Vero E6, hACE2-HEK293T and 293T cells. The fluorescence was recorded at 48 h post transduction. The experiments were done in triplicates and standard error of mean was plotted as error bars. (F) Whole cell lysates from Vero E6, hACE2-293T and 293T cells were run on SDS-PAGE and probed with anti ACE2 antibody. Beta-actin was used as a loading control. Image collected and cropped by CiteAb from the following publication (https://pubmed.ncbi.nlm.nih.gov/33154514), licensed under a CC-BY license. Not internally tested by R&D Systems.
Detection of Mouse ACE-2 by Western Blot

Detection of Mouse ACE-2 by Western Blot

Immunoblot analysis of ACE2 protein in the media from high glucose- or Ang II-stimulated mouse PT cells.(A) Mouse PT cells were incubated for 72 hrs in normal media (C, 7.8 mM D-glucose), with or without Ang II (10−7 M), high D-glucose (D-G, 25 mM), or high L-glucose (25 mM). Above graph is representative immunoblot for ACE2 in the media, showing bands at ∼90 kDa and ∼70 kDa. (B) Graphical representation of densitometry analysis of two ACE2 bands on immunoblots. For the ∼90 kDa band, *p<0.05 vs C, **p<0.001 vs C, **p<0.003 vs L-G; n = 5. For the ∼70 kDa band, *p<0.04 vs C; **p<0.001 vs C or L-G, **p<0.03 vs Ang II; n = 5. Image collected and cropped by CiteAb from the following publication (https://dx.plos.org/10.1371/journal.pone.0085958), licensed under a CC-BY license. Not internally tested by R&D Systems.
Detection of Mouse ACE-2 by Western Blot

Detection of Mouse ACE-2 by Western Blot

Deglycosylation of ACE2 protein in media and cell lysates from mouse PT cells.Representative immunoblot for ACE2 treated without (−) or with (+) deglycosylation with PNGase F in the media (Lanes 1–2) and cell lysates (Lanes 3–4). Lanes 1 and 3: wildtype PT cells, Lanes 2 and 4: ACE2 knockout (KO) PT cells transfected with a human ACE2 vector, Lane 5: mouse kidney cortex. Lanes 1+ and 2+ show a reduction in the sizes of ACE2 fragments in media fractions to ∼75 kDa and ∼60 kDa for mouse ACE2, and to ∼80 kDa and ∼65 kDa for human ACE2, respectively. Lanes 3+ and 4+ show a reduction in the sizes of ACE2 in cell lysates to ∼85 kDa for both mouse and human ACE2 treated with the PNGase F, respectively. Lane 5+ shows a reduction in size of ACE2 in mouse cortex from ∼100 kDa to ∼85 kDa after treatment with PNGase F. Image collected and cropped by CiteAb from the following publication (https://dx.plos.org/10.1371/journal.pone.0085958), licensed under a CC-BY license. Not internally tested by R&D Systems.
Detection of Mouse ACE-2 by Western Blot

Detection of Mouse ACE-2 by Western Blot

Immunoblot analysis of ACE2 protein in media and cell lysates from mouse PT cells.(A) Representative immunoblot for ACE2 protein in concentrated media (Lanes 1–3) and cell lysates (Lanes 4–6) from mouse PT cells. Lanes 1 and 4: wildtype cells, Lanes 2 and 5: ACE2 knockout (KO) cells, Lanes 3 and 6: ACE2 KO cells transfected with a human ACE2 expression vector, Lane 7: mouse kidney cortex showing a band at ∼100 kDa, used as a positive control. Lane 1 shows two bands in the media at ∼90 kDa and ∼70 kDa for mouse ACE2. Lane 3 shows two bands in the media for human ACE2 in transfected cells, at ∼110 kDa and ∼95 kDa. Lanes 4 and 6 show a single band in cell lysates at ∼100 kDa for mouse ACE2, and ∼120 kDa for human ACE2, respectively. Lanes 2 and 5 show no ACE2 bands detected on immunoblots of both media and cell lysates from untransfected ACE2 KO cells. (B) Increased ACE2 activity in the media from ACE2 KO cells transfected with a human ACE2 expression vector (HA-hACE2, 3.75 µg on 35 mm culture dishes). Untransfected cells and cells transfected with an empty pcDNA3 vector had no detectable ACE2 activity in the media. Numbers in parentheses represent mean values for ACE2 activity. *P<0.001 vs untransfected control or empty pcDNA3 vector, n = 4. Image collected and cropped by CiteAb from the following publication (https://dx.plos.org/10.1371/journal.pone.0085958), licensed under a CC-BY license. Not internally tested by R&D Systems.
Human/Mouse/Rat/Hamster ACE‑2 Antibody

Simple Western: ACE-2 Antibody [Unconjugated] [AF933] -

Simple Western: ACE-2 Antibody [Unconjugated] [AF933] - Design for a membrane-localized ACE2 expression system. (A) Our ACE2 construct is driven by a CMV promoter followed by the first 25 residues of ACE2 containing the leader sequence that direct ACE2 to the plasma membrane. This is followed by a 3xHA tag linked to the remainder of ACE2 (20-805) and a C-terminal sfGFP. Both 3xHA and sfGFP fusions are separated from ACE2 by flexible 3xGGGGS linkers. (B) The ACE2 fusion protein is designed to be embedded in the plasma membrane where it can perform extracellular carboxypeptidase-mediated metabolism and its levels can be detected by cell staining with antibodies to HA. (C) Lysates from untransfected or 3xHA-ACE2-sfGFP-transfected HEK293 cells were analyzed by automated Jess capillary immunoassay using antibodies to HA, GFP, and two ACE2 antibodies. (D) Confocal fluorescence microscopy of HEK cells transfected with 3xHA-ACE2-sfGFP and stained with HA and the nuclear stain DAPI. Image collected and cropped by CiteAb from the following publication (https://pubmed.ncbi.nlm.nih.gov/37644110), licensed under a CC-BY license. Not internally tested by R&D Systems.
Detection of Mouse ACE-2 by Immunohistochemistry

Detection of Mouse ACE-2 by Immunohistochemistry

Distribution of ACE2 along the olfactory retrograde route. A Schematic elucidation of a gross view of mouse olfactory retrograde route comprised by OB surface, SEZ/RC, SEZ in the rostral migratory stream (SEZ/RMS) and SVZ of the LV (top panel) and a microscopic view of SEZ/RC and SEZ/RMS (bottom panel). B–E Co-staining of ACE2 (green) with astrocyte marker GFAP (red) in SEZ/RC and SEZ/RMS. B-C show the low magnitude images. D–E show the enlarged images of the indicated regions in B and C, respectively. DAPI (blue) was used for nuclear staining. Arrow: indicates astrocyte. Dash arrow: indicates neuroblast. Arrowhead: indicates microvessel. The dash lines in all images outline the border of SEZ/RC and SEZ/RMS, respectively. Image magnitude B-C: 20X, D-E: 100X Image collected and cropped by CiteAb from the following open publication (https://pubmed.ncbi.nlm.nih.gov/35672716), licensed under a CC-BY license. Not internally tested by R&D Systems.
Detection of Mouse ACE-2 by Immunohistochemistry

Detection of Mouse ACE-2 by Immunohistochemistry

Ubiquitous expression of ACE2 in cerebral microvascular pericytes. A Schematic elucidation of sectioning plates and main brain regions of a mouse brain. OB: olfactory bulb, SEZ/RC: subependymal zone (SEZ) in the rhinocele, CTX: cerebral cortex, CC: corpus callosum, STR: striatum, LV: lateral ventricle, HP: hippocampus, TH: thalamus, 3 V: third ventricle, HY: hypothalamus, AQ: cerebral aqueduct, MB: midbrain, CB: cerebellum, 4 V: fourth ventricle, MY: medulla oblongata. B Scanning images show ACE2 (green) distribution in the hemisphere sections. C–F ACE2 (red) ubiquitously distributes in the cerebral microvessels labeled by endothelial cell marker CD31 (green) and pericyte marker PDGFR beta (green), respectively. ACE2 overlapped with pericyte marker PDGFR beta (F) but not endothelial cell marker CD31 (D). C and E showed the low magnitude images. D and F showed the enlarged images of the indicated regions in C and E, respectively. G ACE2 (red) does not distribute in large blood vessels marked by CD31 (green) but is detectable in the meninges wrapping HY. DAPI (blue) was used for nuclear staining. *: indicates large blood vessels. #: indicates meninges. Arrowhead: indicates microvessel. Image magnitude B: 10X; C, E and G: 20X; D and F: 100X Image collected and cropped by CiteAb from the following open publication (https://pubmed.ncbi.nlm.nih.gov/35672716), licensed under a CC-BY license. Not internally tested by R&D Systems.
Detection of Mouse ACE-2 by Immunohistochemistry

Detection of Mouse ACE-2 by Immunohistochemistry

Differential distribution of ACE2 in brain parenchyma. A Uneven distribution of ACE2 (green) in indicated brain regions. Each insert shows a comparable high magnitude image of the corresponding region. B Enlarged images of the indicated region in the MY panel in A with co-staining of ACE2 (green) and astrocyte marker GFAP (red). C Co-staining of ACE2 (red) and neuron marker NeuN (green) in the MY. Cii-Civ show the high magnitude image of the comparable regions of Ci. D Quantitation of the relative expression of ACE2 in astrocytes and neurons. Values are presented as mean ± SEM. n = 60. ***: p < 0.001. DAPI (blue) was used for nuclear staining. Arrowhead: indicates microvessel. Arrow: indicates astrocyte. Dash arrow: indicates neuron. #indicates meninges wrapping MY. Image magnitude A and Ci: 20X, B and Cii-iv: 100X Image collected and cropped by CiteAb from the following open publication (https://pubmed.ncbi.nlm.nih.gov/35672716), licensed under a CC-BY license. Not internally tested by R&D Systems.
Detection of Mouse ACE-2 by Immunohistochemistry

Detection of Mouse ACE-2 by Immunohistochemistry

Ubiquitous expression of ACE2 in cerebral microvascular pericytes. A Schematic elucidation of sectioning plates and main brain regions of a mouse brain. OB: olfactory bulb, SEZ/RC: subependymal zone (SEZ) in the rhinocele, CTX: cerebral cortex, CC: corpus callosum, STR: striatum, LV: lateral ventricle, HP: hippocampus, TH: thalamus, 3 V: third ventricle, HY: hypothalamus, AQ: cerebral aqueduct, MB: midbrain, CB: cerebellum, 4 V: fourth ventricle, MY: medulla oblongata. B Scanning images show ACE2 (green) distribution in the hemisphere sections. C–F ACE2 (red) ubiquitously distributes in the cerebral microvessels labeled by endothelial cell marker CD31 (green) and pericyte marker PDGFR beta (green), respectively. ACE2 overlapped with pericyte marker PDGFR beta (F) but not endothelial cell marker CD31 (D). C and E showed the low magnitude images. D and F showed the enlarged images of the indicated regions in C and E, respectively. G ACE2 (red) does not distribute in large blood vessels marked by CD31 (green) but is detectable in the meninges wrapping HY. DAPI (blue) was used for nuclear staining. *: indicates large blood vessels. #: indicates meninges. Arrowhead: indicates microvessel. Image magnitude B: 10X; C, E and G: 20X; D and F: 100X Image collected and cropped by CiteAb from the following open publication (https://pubmed.ncbi.nlm.nih.gov/35672716), licensed under a CC-BY license. Not internally tested by R&D Systems.
Detection of Mouse ACE-2 by Immunohistochemistry

Detection of Mouse ACE-2 by Immunohistochemistry

Distribution of ACE2 along the olfactory retrograde route. A Schematic elucidation of a gross view of mouse olfactory retrograde route comprised by OB surface, SEZ/RC, SEZ in the rostral migratory stream (SEZ/RMS) and SVZ of the LV (top panel) and a microscopic view of SEZ/RC and SEZ/RMS (bottom panel). B–E Co-staining of ACE2 (green) with astrocyte marker GFAP (red) in SEZ/RC and SEZ/RMS. B-C show the low magnitude images. D–E show the enlarged images of the indicated regions in B and C, respectively. DAPI (blue) was used for nuclear staining. Arrow: indicates astrocyte. Dash arrow: indicates neuroblast. Arrowhead: indicates microvessel. The dash lines in all images outline the border of SEZ/RC and SEZ/RMS, respectively. Image magnitude B-C: 20X, D-E: 100X Image collected and cropped by CiteAb from the following open publication (https://pubmed.ncbi.nlm.nih.gov/35672716), licensed under a CC-BY license. Not internally tested by R&D Systems.
Detection of Mouse ACE-2 by Immunohistochemistry

Detection of Mouse ACE-2 by Immunohistochemistry

Ubiquitous expression of ACE2 in cerebral microvascular pericytes. A Schematic elucidation of sectioning plates and main brain regions of a mouse brain. OB: olfactory bulb, SEZ/RC: subependymal zone (SEZ) in the rhinocele, CTX: cerebral cortex, CC: corpus callosum, STR: striatum, LV: lateral ventricle, HP: hippocampus, TH: thalamus, 3 V: third ventricle, HY: hypothalamus, AQ: cerebral aqueduct, MB: midbrain, CB: cerebellum, 4 V: fourth ventricle, MY: medulla oblongata. B Scanning images show ACE2 (green) distribution in the hemisphere sections. C–F ACE2 (red) ubiquitously distributes in the cerebral microvessels labeled by endothelial cell marker CD31 (green) and pericyte marker PDGFR beta (green), respectively. ACE2 overlapped with pericyte marker PDGFR beta (F) but not endothelial cell marker CD31 (D). C and E showed the low magnitude images. D and F showed the enlarged images of the indicated regions in C and E, respectively. G ACE2 (red) does not distribute in large blood vessels marked by CD31 (green) but is detectable in the meninges wrapping HY. DAPI (blue) was used for nuclear staining. *: indicates large blood vessels. #: indicates meninges. Arrowhead: indicates microvessel. Image magnitude B: 10X; C, E and G: 20X; D and F: 100X Image collected and cropped by CiteAb from the following open publication (https://pubmed.ncbi.nlm.nih.gov/35672716), licensed under a CC-BY license. Not internally tested by R&D Systems.
Detection of ACE-2 by Western Blot

Detection of ACE-2 by Western Blot

ADAM17 deletion reduces ACE2 shedding in post-MI mice. Knockout of ADAM17 in the myocardium of MI mice using TAPI-1, the same as before. A Western blot analysis of the expression of ADAM17, p-ADAM17, pP38MAPK, total P38MAPK, ACE2 protein in different position myocardium of 30 days post-MI mice. B Quantification of pP38MAPK levels in different position of myocardium. C Quantification of ACE2 levels in cardiomyocytes. D Detection of ACE2 activity in cardiomyocyte lysates by ACE2 activity fluorometric assay. E Detection of pADAM17 Thr735 expression in peripheral blood of patients with or without HF after MI. F Detection of ACE2 expression in peripheral blood of patients with or without HF after MI. N = 6 biological replicates. Data shown as mean ± SEM. Derived by two-sample t-test, *P < 0.05; **P < 0.01, ***P < 0.001 Image collected and cropped by CiteAb from the following open publication (https://pubmed.ncbi.nlm.nih.gov/37046278), licensed under a CC-BY license. Not internally tested by R&D Systems.
Detection of ACE-2 by Western Blot

Detection of ACE-2 by Western Blot

Activated P38MAPK induced phosphorylation of ADAM17 in injured cardiomyocyte. A–C Representative western blot (A) and quantitative results depicting the phosphorylation vs. total protein levels of P38 (B) and ERK1/2 (C) in H9C2 cardiomyocytes treated with 600 μM hydrogen peroxide for 12 h (n = 3). D Phosphorylated ADAM17 (p-ADAM17) was assessed by western blot with anti-phospho-ADAM17 (pThr735) antibody after transfection with ADAM17 siRNA or P38MAPK inhibitor SB203580 as indicated (n = 3). E Flow cytometric analysis of annexin V/PI double stained cardiomyocyte after treatment as indicated (right). Histogram indicating the percentage of later apoptosis cells in 4 groups (left) (n = 3). F The cell viability was detected by CCK8 assay (n = 4). G The live (green) and dead (red) cells were observed by calcein-AM/PI double staining kit after treatment as indicated (right). Histogram showing percentage of viable cells(left) (n = 3). H Protein levels of ACE2 (110 kDa), collagen I, collagen III TGF-beta 1 in cardiomyocytes and released ACE2 protein (90 kDa) in the supernatant were detected by western blotting(n = 3). I, J ACE2 activity in cardiomyocyte lysates (I) and cardiomyocyte supernatant (J) was detected by the ACE2 Activity Fluorometric Assay(n = 4). Data shown as mean ± SEM. Derived by two-sample t-test, *P < 0.05; **P < 0.01, ***P < 0.001 Image collected and cropped by CiteAb from the following open publication (https://pubmed.ncbi.nlm.nih.gov/37046278), licensed under a CC-BY license. Not internally tested by R&D Systems.
Detection of ACE-2 by Western Blot

Detection of ACE-2 by Western Blot

Increased expression of TMPRSS2 and ACE2 by Vero E6-TMPRSS2-T2A-ACE2 cells. (A) Analysis of TMPRSS2 mRNA levels by qRT-PCR. mRNA levels (-fold) in Vero E6, VeroE6/TMPRSS2, and Vero E6-TMPRSS2-T2A-ACE2 cells were compared with those in HeLa229 cells (set to 1.0). *: p < 0.005, **: p < 0.0001. (B) Western blot analysis with an anti-human ACE2 antibody was performed to detect ACE2 protein in HeLa229, Vero E6, VeroE6/TMPRSS2, and Vero E6-TMPRSS2-T2A-ACE2 cells. beta -actin was used as a loading control. The amount of ACE2 protein detected in each cells was normalized with the that of beta -actin and expressed as a fold change (the amount in HeLa cells was set to 1.0). The transferred membrane was cut prior to hybridization with anti-ACE2 or anti-beta -actin. The original of blots with membrane edges visible was shown in the Supplementary figure S4. Image collected and cropped by CiteAb from the following open publication (https://pubmed.ncbi.nlm.nih.gov/39438626), licensed under a CC-BY license. Not internally tested by R&D Systems.

Applications for Human/Mouse/Rat/Hamster ACE‑2 Antibody

Application
Recommended Usage

Blockade of Receptor-ligand Interaction

Hoffman, M. et al. (2020) Cell. DOI: 10.1016/j.cell.2020.02.052. This application was not tested by R&D Systems.

Flow Cytometry

0.25 µg/106 cells
Sample: HEK293 Human Cell Line Transfected with Human ACE-2 and eGFP

Immunohistochemistry

3-15 µg/mL
Sample: Immersion fixed frozen sections of rat lung, immersion fixed paraffin-embedded sections of human kidney, hamster lung, rat lung, and rat kidney

Immunoprecipitation

25 µg/mL
Sample: Conditioned cell culture medium spiked with Recombinant Human ACE‑2 (Catalog # 933-ZN), see our available Western blot detection antibodies

Simple Western

10 µg/mL
Sample: Human kidney tissue

Western Blot

1 µg/mL
Sample: Human kidney tissue, Mouse kidney tissue, and Rat kidney tissue

Reviewed Applications

Read 4 reviews rated 5 using AF933 in the following applications:

Flow Cytometry Panel Builder

Bio-Techne Knows Flow Cytometry

Save time and reduce costly mistakes by quickly finding compatible reagents using the Panel Builder Tool.

Advanced Features

  • Spectra Viewer - Custom analysis of spectra from multiple fluorochromes
  • Spillover Popups - Visualize the spectra of individual fluorochromes
  • Antigen Density Selector - Match fluorochrome brightness with antigen density
Build Your Panel Now

Formulation, Preparation, and Storage

Purification

Antigen Affinity-purified

Reconstitution

Reconstitute at 0.2 mg/mL in sterile PBS. For liquid material, refer to CoA for concentration.


Loading...

Formulation

Lyophilized from a 0.2 μm filtered solution in PBS with Trehalose. *Small pack size (SP) is supplied either lyophilized or as a 0.2 µm filtered solution in PBS.

Shipping

Lyophilized product is shipped at ambient temperature. Liquid small pack size (-SP) is shipped with polar packs. Upon receipt, store immediately at the temperature recommended below.

Stability & Storage

Use a manual defrost freezer and avoid repeated freeze-thaw cycles.
  • 12 months from date of receipt, -20 to -70 °C as supplied.
  • 1 month, 2 to 8 °C under sterile conditions after reconstitution.
  • 6 months, -20 to -70 °C under sterile conditions after reconstitution.

Calculators

The reconstitution calculator allows you to quickly calculate the volume of a reagent to reconstitute your vial. Simply enter the mass of reagent and the target concentration and the calculator will determine the rest.

=
÷

Background: ACE-2

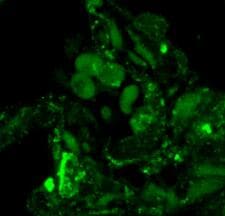
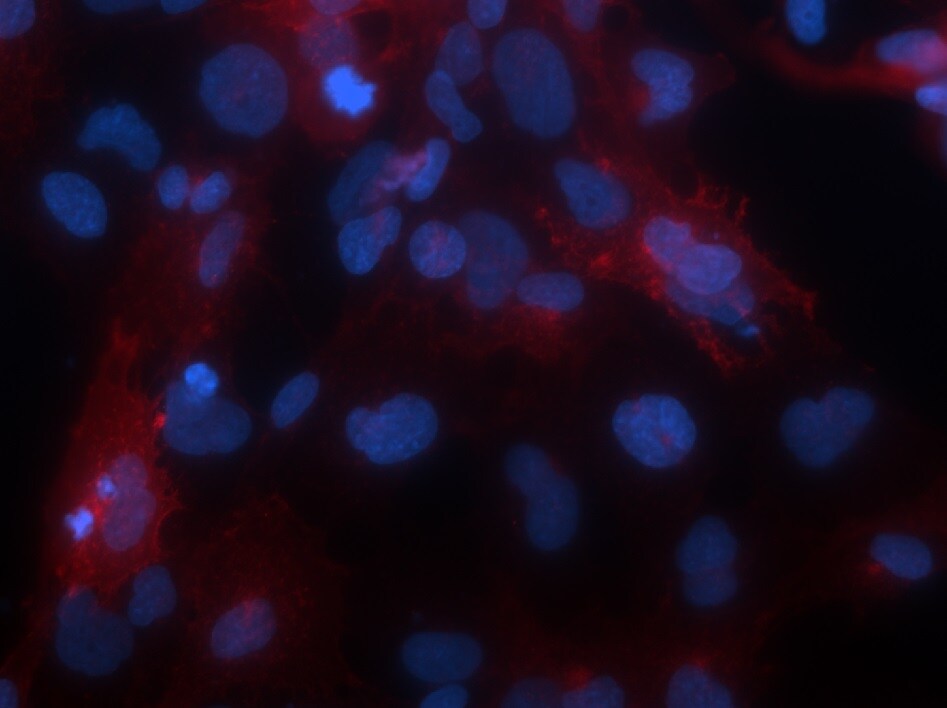
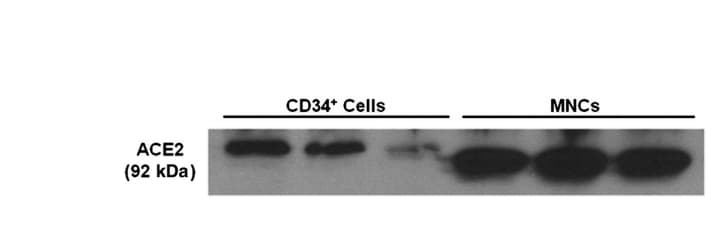
ACE-2, also called ACEH (ACE homolog), is an integral membrane protein and a zinc metalloprotease of the ACE family that also includes somatic and germinal ACE (1). Human ACE-2 has about 40% amino acid identity to the N- and C-terminal domains of human somatic ACE. The predicted human ACE-2 protein sequence consists of 805 amino acids, including a N-terminal signal peptide, a single catalytic domain, a C-terminal membrane anchor, and a short cytoplasmic tail. ACE-2 cleaves angiotensins I and II as a carboxypeptidase. ACE-2 mRNA is found at high levels in testis, kidney, and heart and at moderate levels in colon, small intestine, and ovary. Classical ACE inhibitors such as captopril and lisinopril do not inhibit ACE-2 activity. Novel peptide inhibitors of ACE-2 do not inhibit ACE activity (2). Genetic data from Drosophila, mice and rats show that ACE-2 is an essential regulator of heart function in vivo (3).

ACE2 has been shown to be a functional receptor of the human coronaviruses SARS-CoV and SARS-CoV-2 (4, 5). This Human anti-ACE2 antibody (catalog # AF933) was used to block the variant SARS-CoV-2 and ACE2 interaction to elucidate viral transmission and potential therapeutic strategies. (5)

References

  1. Tipnis, S.R. et al. (2000) J. Biol. Chem. 275:33238.
  2. Crackower,  M.A. et al. (2002) Nature 417:822.
  3. Huang, L. et al. (2003) J. Biol. Chem. 278:15532.
  4. Li, W. et al. (2003) Nature 426:450.
  5. Hoffmann, M. et al. (2020) Cell. DOI: 10.1016/j.cell.2020.02.052.

Long Name

Angiotensin I Converting Enzyme 2

Alternate Names

ACE2, ACEH

Entrez Gene IDs

59272 (Human); 70008 (Mouse); 302668 (Rat); 100144303 (Porcine); 480847 (Canine); 418623 (Chicken); 102130864 (Cynomolgus Monkey); 554349 (Feline); 101673097 (Ferret); 101823817 (Hamster); 108390919 (Malayan Pangolin)

Gene Symbol

ACE2

UniProt

Additional ACE-2 Products

Product Documents for Human/Mouse/Rat/Hamster ACE‑2 Antibody

Certificate of Analysis

To download a Certificate of Analysis, please enter a lot or batch number in the search box below.

Note: Certificate of Analysis not available for kit components.

Product Specific Notices for Human/Mouse/Rat/Hamster ACE‑2 Antibody

For research use only

Citations for Human/Mouse/Rat/Hamster ACE‑2 Antibody

Customer Reviews for Human/Mouse/Rat/Hamster ACE‑2 Antibody (4)

5 out of 5
4 Customer Ratings
5 Stars
100%
4 Stars
0%
3 Stars
0%
2 Stars
0%
1 Stars
0%

Have you used Human/Mouse/Rat/Hamster ACE‑2 Antibody?

Submit a review and receive an Amazon gift card!

$25/€18/£15/$25CAN/¥2500 Yen for a review with an image

$10/€7/£6/$10CAN/¥1110 Yen for a review without an image

Submit a review
Amazon Gift Card

Customer Images


Showing  1 - 4 of 4 reviews Showing All
Filter By:
  • Human/Mouse/Rat/Hamster ACE-2 Antibody
    Name: Anonymous
    Application: Block/Neutralize
    Sample Tested: Embryonic lung
    Species: Human
    Verified Customer | Posted 10/04/2022
    Human/Mouse/Rat/Hamster ACE‑2 Antibody AF933
  • Human/Mouse/Rat/Hamster ACE-2 Antibody
    Name: Yuchen Liu
    Application: Immunocytochemistry/Immunofluorescence
    Sample Tested: Stimulated Human Bronchial Epithelial Cell Line (BEAS-2B)
    Species: Human
    Verified Customer | Posted 03/09/2021
    Human/Mouse/Rat/Hamster ACE‑2 Antibody AF933
  • Human ACE-2 Antibody
    Name: Anonymous
    Application: Western Blot
    Sample Tested: Blood mononuclear cells (PBMCs) and Human CD34+ Cells
    Species: Human
    Verified Customer | Posted 08/12/2016
    Human/Mouse/Rat/Hamster ACE‑2 Antibody AF933
  • Name: Anonymous
    Application: Immunofluorescence
    Sample Tested: See PMID 23232719
    Species: Human
    Verified Customer | Posted 01/12/2015

There are no reviews that match your criteria.

Showing  1 - 4 of 4 reviews Showing All

Protocols

Find general support by application which include: protocols, troubleshooting, illustrated assays, videos and webinars.

FAQs

No product specific FAQs exist for this product.

View all FAQs for Antibodies