SOX2 Antibody (245610)
R&D Systems | Catalog # MAB2018

Key Product Details
Validated by
Species Reactivity
Validated:
Cited:
Applications
Validated:
Cited:
Label
Antibody Source
Product Specifications
Immunogen
Gly135-Met317
Accession # P48431
Specificity
Clonality
Host
Isotype
Scientific Data Images for SOX2 Antibody (245610)
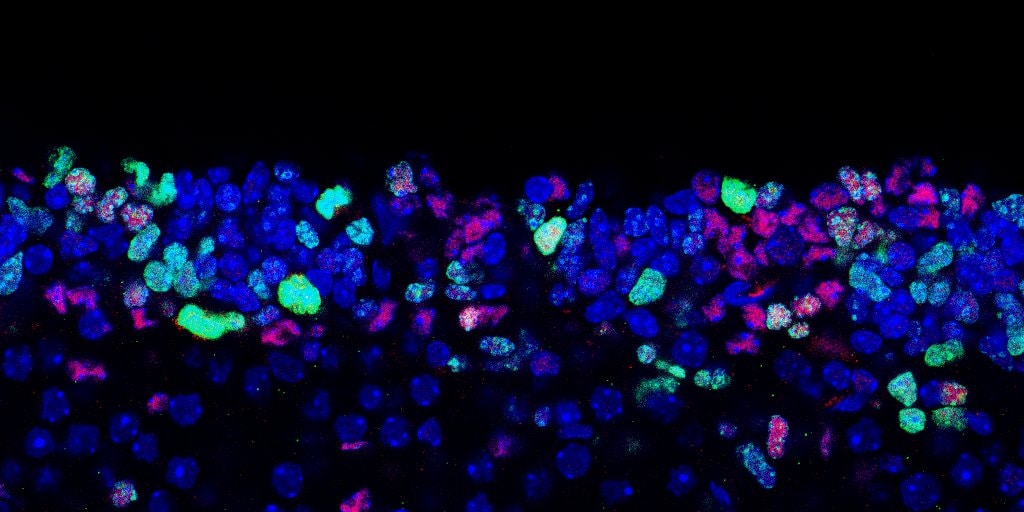
Detection of SOX2 in Human Glioblastoma via seqIF™ staining on COMET™
SOX2 Antibody was detected in immersion fixed paraffin-embedded sections of human Glioblastoma using Mouse Anti-Human SOX2, Monoclonal Antibody (Catalog # MAB2018) at 5ug/mL at 37 ° Celsius for 4 minutes. Before incubation with the primary antibody, tissue underwent an all-in-one dewaxing and antigen retrieval preprocessing using PreTreatment Module (PT Module) and Dewax and HIER Buffer H (pH 9; Epredia Catalog # TA-999-DHBH). Tissue was stained using the Alexa Fluor™ 647 Goat anti-Mouse IgG Secondary Antibody at 1:200 at 37 ° Celsius for 2 minutes. (Yellow; Lunaphore Catalog # DR647MS) and counterstained with DAPI (blue; Lunaphore Catalog # DR100). Specific staining was localized to the nucleus. Protocol available in COMET™ Panel Builder.
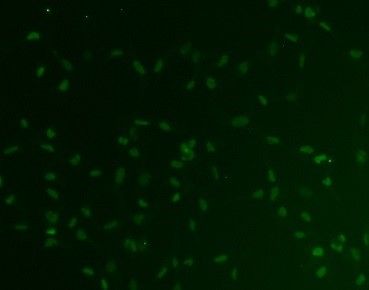
E‑Cadherin and SOX2 in BG01V Human Stem Cells.
E-Cadherin and SOX2 were detected in BG01V human embryonic stem cells using 10 µg/mL Goat Anti-Human E-Cadherin Antigen Affinity-purified Polyclonal Antibody (AF648) and 10 µg/mL Mouse Anti-Human/Mouse/Rat SOX2 Monoclonal Antibody (Catalog # MAB2018). Cells were incubated with primary antibodies for 3 hours at room temperature. Cells were stained for E-Cadherin using the NorthernLights™ 557-conjugated Anti-Goat IgG Secondary Antibody (red; NL001) and for SOX2 using the NorthernLights 493-conjugated Anti-Mouse Secondary Antibody (green; NL009). Cells were counterstained with DAPI (blue). View our protocol for Fluorescent ICC Staining of Cells on Coverslips.
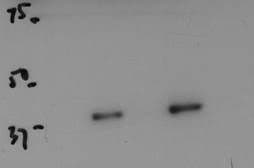
Detection of Human, Mouse, and Rat SOX2 by Western Blot.
Western blot shows lysates of NTera-2 human testicular embryonic carcinoma cell line, F9 mouse teratocarcinoma stem cells, D3 mouse embryonic stem cell line, and rat cortical stem cells. PVDF membrane was probed with 1 µg/mL of Mouse Anti-Human/Mouse/Rat SOX2 Monoclonal Antibody (Catalog # MAB2018) followed by HRP-conjugated Anti-Mouse IgG Secondary Antibody (HAF018). A specific band was detected for SOX2 at approximately 36 kDa (as indicated). This experiment was conducted under reducing conditions and using Immunoblot Buffer Group 1.
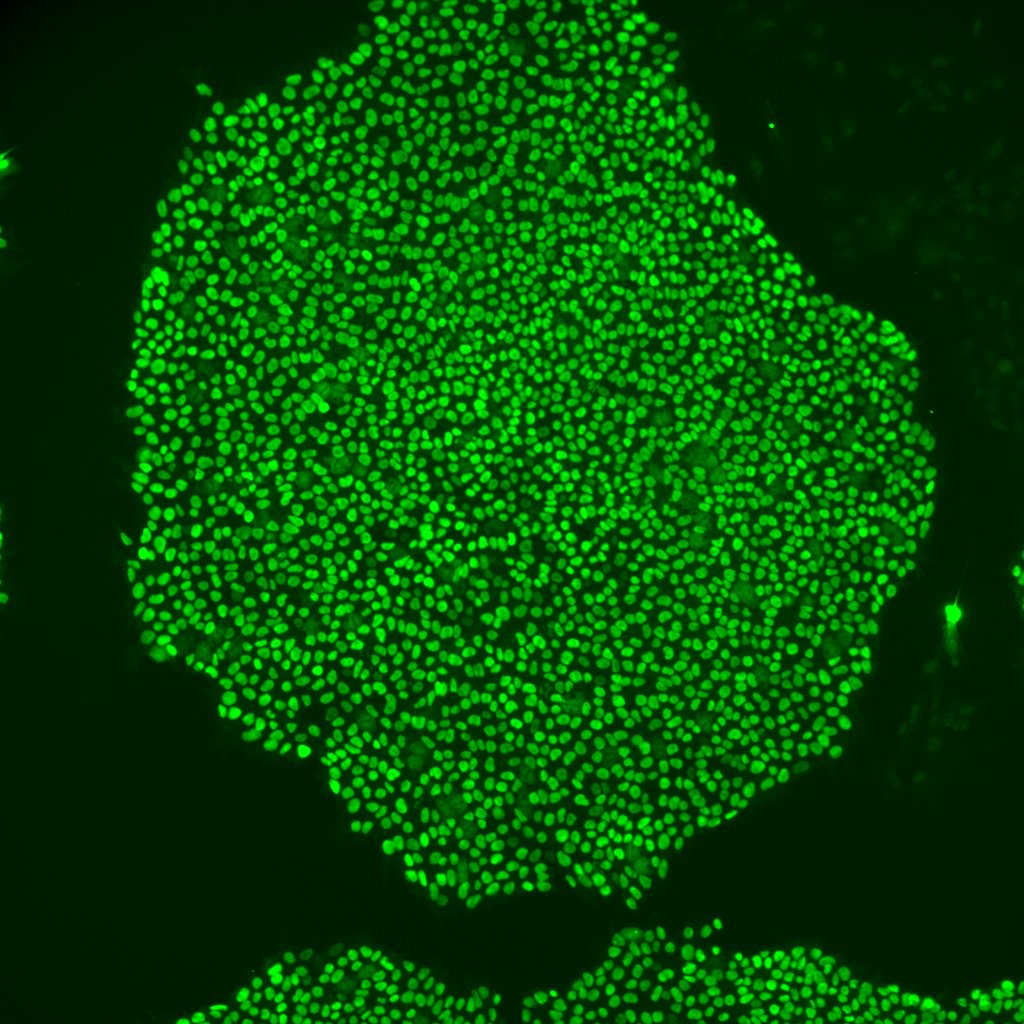
SOX2 in BG01V Human Embryonic Stem Cells.
SOX2 was detected in immersion fixed BG01V human embryonic stem cells using Mouse Anti-Human/ Mouse/Rat SOX2 Monoclonal Antibody (Catalog # MAB2018) at 10 µg/mL for 3 hours at room temperature. Cells were stained using the NorthernLights™ 557-conjugated Anti-Mouse IgG Secondary Antibody (yellow; NL007) and counterstained with DAPI (blue). View our protocol for Fluorescent ICC Staining of Cells on Coverslips.
Detection of SOX2 in NTera‑2 Human Cell Line by Flow Cytometry.
NTera-2 human testicular embryonic carcinoma cell line was stained with Mouse Anti-Human/ Mouse/Rat SOX2 Monoclonal Antibody (Catalog # MAB2018, filled histogram) or isotype control antibody (MAB003, open histogram), followed by Phycoerythrin-conjugated Anti-Mouse IgG Secondary Antibody (F0102B). To facilitate intracellular staining, cells were fixed with Flow Cytometry Fixation Buffer (FC004) and permeabilized with Flow Cytometry Permeabilization/Wash Buffer I (FC005). View our protocol for Staining Intracellular Molecules.
Detection of Human SOX2 by Simple WesternTM.
Simple Western lane view shows lysates of BG01V human embryonic stem cells, loaded at 0.2 mg/mL. A specific band was detected for SOX2 at approximately 50 kDa (as indicated) using 4 µg/mL of Mouse Anti-Human/Mouse/Rat SOX2 Monoclonal Antibody (Catalog # MAB2018). This experiment was conducted under reducing conditions and using the 12-230 kDa separation system.
Detection of SOX2 in glioblastoma.
SOX2 was detected in immersion fixed paraffin-embedded sections of glioblastoma using Mouse Anti-Human/Mouse/Rat SOX2 Monoclonal Antibody (Catalog # MAB2018) at 3 µg/mL for 1 hour at room temperature followed by incubation with the Anti-Mouse IgG VisUCyte™ HRP Polymer Antibody (Catalog # VC001). Before incubation with the primary antibody, tissue was subjected to heat-induced epitope retrieval using VisUCyte Antigen Retrieval Reagent-Basic (Catalog # VCTS021). Tissue was stained using DAB (brown) and counterstained with hematoxylin (blue). Specific staining was localized to nuclei in cancer cells. View our protocol for IHC Staining with VisUCyte HRP Polymer Detection Reagents.
Detection of Human SOX2 by Western Blot
Western blotting analysis of the different antigens studied in cell lines (NS and AC) and in primary tumors. (a) Stemness antigens and differentiation antigens prevail in NS and AC, respectively. (b) Densitometric quantification of bands in NS and in the corresponding primary tumors. (c) Densitometric quantification of bands in AC and in the corresponding primary tumors. Image collected and cropped by CiteAb from the following publication (https://pubmed.ncbi.nlm.nih.gov/21869887), licensed under a CC-BY license. Not internally tested by R&D Systems.
Detection of Human SOX2 by Immunocytochemistry/Immunofluorescence
Double immunofluorescence staining of core and periphery in orthotopic model with five different patient derived GBM spheroid cultures.Tissues were stained with Dapi (blue), Vimentin (green) and Sox-2 (red), Bmi-1 (red) and Glut-3 (red). The software-based classifier is shown in the right column. The classifier illustrates tumor cells co-expressing markers of interest in yellow and tumor cells not co-expressing markers of interest in green. The fluorescence stainings were quantified in both central part and periphery for Sox-2 (G), Bmi-1 (H) and Glut-3 (I). Statistical comparison was performed using student’s t-test. Scalebar: 200μm. Image collected and cropped by CiteAb from the following publication (https://dx.plos.org/10.1371/journal.pone.0155106), licensed under a CC-BY license. Not internally tested by R&D Systems.
Detection of Rat SOX2 by Immunocytochemistry/Immunofluorescence
Soluble factors increase the numbers of Hes3+ cells in the adult rat hippocampus.(a) Treatment with the soluble factors induced a powerful increase in the number of Sox2+ cells in the hilus [Quantifications are from images taken from the tip of the hilus to approximately 1,300 micrometers towards the CA3 region – representative images are shown. Staining for the young neuron marker doublecortin (DCX) helps to visualize the subgranular zone]. (b) The same treatment also induced an increase in the numbers of Hes3+ cells in the hilus. (c) Sox2+ cells inside the hilus co-expressed Hes3; in contrast, Sox2+ cells in the subgranular zone did not co-express Hes3. (d,e) Quantification graphs of the increases in Sox2+ and Hes3+ cell numbers in the hilus (p<0.05). For the graph, the number of cells in the sham operated control animals was set to 100%. [Width of images: a, 650 micrometers; b, 650 micrometers]. Image collected and cropped by CiteAb from the following publication (https://dx.plos.org/10.1371/journal.pone.0051630), licensed under a CC-BY license. Not internally tested by R&D Systems.
Detection of Human SOX2 by Immunocytochemistry/Immunofluorescence
Double immunofluorescence staining of core and periphery of patient glioblastomas.Histological sections were stained with Dapi (blue), IDH1 (green) and Sox-2 (red) (AA-BE), Bmi-1 (red) (CA-DE) and Glut-3 (red) (EA to FE). The software-based classifier is shown in the right column. The classifier illustrates tumor cells co-expressing markers of interest in yellow and tumor cells not co-expressing markers of interest in green. The fluorescence stainings were quantified in both core and periphery for Sox-2 (G,J), Bmi-1 (H,K) and Glut-3 (I,L). Statistical comparison was performed using student’s t-test and ANOVA, ** p< 0.01. Scalebar: 200μm. Image collected and cropped by CiteAb from the following publication (https://dx.plos.org/10.1371/journal.pone.0155106), licensed under a CC-BY license. Not internally tested by R&D Systems.
Detection of Human SOX2 by Western Blot
CEP-1347 induces the differentiation of cancer stem cells into non-cancer stem cells(A) Glioma stem cells (GS-Y01, GS-Y03, and GS-NCC01), pancreatic cancer stem cells (PANC-1 CSLC), and ovarian cancer stem cells (A2780 CSLC, and TOV21G CSLC) treated without (Control) or with CEP-1347 (300 nM for PANC-1 CSLC, 200 nM for the others) for 6 days were subjected to flow cytometric analysis of the cell-surface expression of CD133. Representative flow cytometric plots together with the percentages of CD133-positive cells are shown. (B) Cells treated as described in (A) were subjected to immunoblot analysis of the indicated proteins. (C) PANC-1 CSLC cells treated without (Control: lane 1) or with CEP-1347 (lane 2) for 6 days and those cultured in the presence of CEP-1347 for 6 days and then in its absence for the indicated days (lanes 3-5) were subjected to immunoblot analysis of the indicated proteins. Image collected and cropped by CiteAb from the following publication (https://www.oncotarget.com/lookup/doi/10.18632/oncotarget.22033), licensed under a CC-BY license. Not internally tested by R&D Systems.
Detection of Rat SOX2 by Immunocytochemistry/Immunofluorescence
Fluoxetine inhibits the differentiation of hypothalamic neuroprogenitor cells.Hypothalamic neuroprogenitor cells were differentiated for 18 days, in the presence or absence of fluoxetine (1 µM). Representative confocal photomicrographs for mature neurons marker Neu-N (green) (A). Fluoxetine decreases the percentage of Neu-N positive cells and the incubation with Trk receptors inhibitor K252a (24 h) partially reverses this effect (B). Representative confocal photomicrographs for the progenitor cells marker SOX-2 (green) (C). Fluoxetine increases the percentage of SOX-2 positive cells and the incubation with K252a (24 h) does not change this effect (D). Fluoxetine does not up regulate the levels of neurotrophic factor BDNF but incubation with K252a (24 h) results in a compensatory increase of BDNF mRNA levels (E). DAPI (blue), nuclear staining. Mean ± SEM; n = 4/5; One-Way ANOVA; ns, p>0.05; *, p<0.05; ***, p<0.001 compared to control; NS, p>0.05, #, p<0.05 compared to fluoxetine. Scale bar: 50 µm. Image collected and cropped by CiteAb from the following publication (https://pubmed.ncbi.nlm.nih.gov/24598761), licensed under a CC-BY license. Not internally tested by R&D Systems.
Detection of Human SOX2 by Immunocytochemistry/Immunofluorescence
Hes3 is a marker of normal and cancer human stem cells.(A–C) Hes3+ cell in the striatum of non-cancerous adult human brain tissue (blood vessels identified by RECA-1 expression), human hemangioblastoma (HBM) biopsy (HBM Hes3+ megakaryocytes shown), human glioblastoma multiforme (GBM) biopsy (Hes3 co-expressed with prominin). (D) Fetal cortical cells sorted for prominin express Sox2 and Hes3. (E) Enrichment for Sox2+ and Hes3+ cells by magnetic sorting using an anti-prominin antibody. (Size bar, 50 µm). Image collected and cropped by CiteAb from the following publication (https://pubmed.ncbi.nlm.nih.gov/20195471), licensed under a CC-BY license. Not internally tested by R&D Systems.
Detection of Human SOX2 by Immunocytochemistry/Immunofluorescence
Double immunofluorescence staining of core and periphery of patient glioblastomas.Histological sections were stained with Dapi (blue), IDH1 (green) and Sox-2 (red) (AA-BE), Bmi-1 (red) (CA-DE) and Glut-3 (red) (EA to FE). The software-based classifier is shown in the right column. The classifier illustrates tumor cells co-expressing markers of interest in yellow and tumor cells not co-expressing markers of interest in green. The fluorescence stainings were quantified in both core and periphery for Sox-2 (G,J), Bmi-1 (H,K) and Glut-3 (I,L). Statistical comparison was performed using student’s t-test and ANOVA, ** p< 0.01. Scalebar: 200μm. Image collected and cropped by CiteAb from the following publication (https://dx.plos.org/10.1371/journal.pone.0155106), licensed under a CC-BY license. Not internally tested by R&D Systems.
Detection of Human SOX2 by Immunocytochemistry/Immunofluorescence
Immunohistochemistry of a parallel section of Figure 1. (a) Poor GFAP expression. (b) High Nestin expression. (c) SOX2 is highly expressed in nuclei of the external slope of circumscribed necrosis. (d) REST expression, all DAB. (e) CD133-positive area, frozen section. (f) Musashi-1-positive area. Scale bar 50 μm. Image collected and cropped by CiteAb from the following publication (https://pubmed.ncbi.nlm.nih.gov/21869887), licensed under a CC-BY license. Not internally tested by R&D Systems.
Detection of Human SOX2 by Immunocytochemistry/Immunofluorescence
Neural induction of hPSCs. (a) Both hPSC culture and neural differentiation were performed on LN521 substrate. Cortical neurons were induced with dual SMAD inhibition, expanded in the presence of FGF2, and matured with support by a selection of neurotrophic factors. Neural progenitor cells (NPCs) could be cryopreserved at day 21 and plated at day 32 for final experiments, including microelectrode array (MEA) measurements. (b) Three different hPSC lines (one hESC line, 08/023 and two hiPSC lines, 10212.EURCCs and IMR90-4) were characterized for their efficiency in producing neuroectodermal cells in response to 12-day neural induction by dual SMAD inhibition. Cells were stained for pluripotency marker Oct4 at the pluripotent stage and after 12 days of neural induction. The presence of early neuroectodermal markers was evaluated with Sox2, FoxG1 and Pax6 staining. (c) After 21 days of differentiation, the culture contained vimentin- and Pax6-positive NPCs that could be cryopreserved. Additionally, the first Tbr2- and MAP2-positive neurons were detected at this time point. (d) The percentages of Pax6-positive cells were quantified at four time points of differentiation (mean ± s.e.m., n = 5–14, data derived from 1–3 independent differentiations). Statistical analysis was performed with the Mann-Whitney U test to compare differences between day 12 and day 46 within each hPSC line, and significant p-values are presented in the image. The scale bar is 50 µm in all images. Image collected and cropped by CiteAb from the following publication (https://pubmed.ncbi.nlm.nih.gov/31748598), licensed under a CC-BY license. Not internally tested by R&D Systems.
Detection of Human SOX2 by Immunocytochemistry/Immunofluorescence
Double immunofluorescence staining of core and periphery in orthotopic model with five different patient derived GBM spheroid cultures.Tissues were stained with Dapi (blue), Vimentin (green) and Sox-2 (red), Bmi-1 (red) and Glut-3 (red). The software-based classifier is shown in the right column. The classifier illustrates tumor cells co-expressing markers of interest in yellow and tumor cells not co-expressing markers of interest in green. The fluorescence stainings were quantified in both central part and periphery for Sox-2 (G), Bmi-1 (H) and Glut-3 (I). Statistical comparison was performed using student’s t-test. Scalebar: 200μm. Image collected and cropped by CiteAb from the following publication (https://dx.plos.org/10.1371/journal.pone.0155106), licensed under a CC-BY license. Not internally tested by R&D Systems.
Detection of Human Human/Mouse/Rat SOX2 Antibody by Immunocytochemistry/ Immunofluorescence
Characterization of TRNDi009-C iPSC line. A) Left: phase contrast imaging of TRNDi009-C colonies grown on Geltrex at passage 6. Right: Representative immunofluorescent images of iPSCs positive for stem cell markers: SOX2, OCT4, NANOG, and SSEA4. Nucleus is labelled with Hoechst 33342 (blue). B) Cytogenetic analysis showing a normal karyotype (46, XX). C) Detection of heterozygous mutation of a p.L302P (c.905 T > C) in exon 2 of the SMPD1 gene. D) Flow cytometry analysis of pluripotency protein markers: NANOG and TRA-1–60. E) RT-PCR verification for the clearance of the Sendai virus from reprogrammed cells. Sendai virus vector transduced fibroblasts were used as a positive control. F) Pathological analysis of teratoma from TRNDi009-C iPSC, showing a normal ectodermal, mesodermal, and endodermal differentiation. Image collected and cropped by CiteAb from the following publication (https://pubmed.ncbi.nlm.nih.gov/31132580), licensed under a CC-BY license. Not internally tested by R&D Systems.
Detection of Human Human/Mouse/Rat SOX2 Antibody by Immunocytochemistry/ Immunofluorescence
Characterization of TRNDi007-B iPSC line.A) Left: Phase contrast imaging of TRNDi007-B colonies. Right: Representative immunofluorescent images of iPSCs showing expression of stem cell markers: SOX2, OCT4, SSEA-4, and NANOG. Nucleus is stained with Hoechst dye (in blue). B) Flow cytometry analysis of pluripotency protein markers: TRA-1-60, NANOG and SSEA-4. C) Cytogenetic analysis showing a normal karyotype (46, XY). D) Detection of homozygous mutation of c.2560 C > T in exon 18 of the GAA gene. E) RT-PCR verification of the clearance of Sendai virus from the reprogrammed cells. Sendai virus vector transduced fibroblasts was used as positive control. F) Histological analysis of teratomas produced by TRNDi007-B iPSCs. Representative images showing the presence of ectodermal, endodermal and mesodermal derivatives. Image collected and cropped by CiteAb from the following publication (https://pubmed.ncbi.nlm.nih.gov/31026687), licensed under a CC-BY license. Not internally tested by R&D Systems.
Detection of Human Human/Mouse/Rat SOX2 Antibody by Western Blot
CEP-1347 induces the differentiation of cancer stem cells into non-cancer stem cells(A) Glioma stem cells (GS-Y01, GS-Y03, and GS-NCC01), pancreatic cancer stem cells (PANC-1 CSLC), and ovarian cancer stem cells (A2780 CSLC, and TOV21G CSLC) treated without (Control) or with CEP-1347 (300 nM for PANC-1 CSLC, 200 nM for the others) for 6 days were subjected to flow cytometric analysis of the cell-surface expression of CD133. Representative flow cytometric plots together with the percentages of CD133-positive cells are shown. (B) Cells treated as described in (A) were subjected to immunoblot analysis of the indicated proteins. (C) PANC-1 CSLC cells treated without (Control: lane 1) or with CEP-1347 (lane 2) for 6 days and those cultured in the presence of CEP-1347 for 6 days and then in its absence for the indicated days (lanes 3-5) were subjected to immunoblot analysis of the indicated proteins. Image collected and cropped by CiteAb from the following publication (https://pubmed.ncbi.nlm.nih.gov/29212273), licensed under a CC-BY license. Not internally tested by R&D Systems.
Detection of Human SOX2 by Immunocytochemistry/ Immunofluorescence
(A) Differentiation markers for the endoderm (FOXA2, PDX1), mesoderm ( alpha -actin, brachyury), and ectoderm ( beta 3 Tubulin, Otx2) were detected for the MUCG01, MUCG02, and MUCG03 clinical-grade hESC lines by immunocytochemistry. (B) Standard karyotypes without chromosomal aberration were detected for all hESC lines MUCG01: 46,XX; MUCG02: 46,XX; and MUCG03: 46,XY. (C) Pluripotency markers Oct3/4, Sox2, and Nanog were detected for the MUCG01, MUCG02, and MUCG03 clinical-grade hESC lines by immunocytochemistry. Image collected and cropped by CiteAb from the following open publication (https://pubmed.ncbi.nlm.nih.gov/36293356), licensed under a CC-BY license. Not internally tested by R&D Systems.
Immunofluorescent Staining of Adult stem cell-derived Lung Organoids.
Adult stem cells isolated from human lung biopsy tissue were cultured following the steps detailed in the human lung organoid culture protocol. Lung organoids were stained with a (A) Goat Anti-Human p63/TP73L Polyclonal Antibody (Catalog # AF1916; red) and a rabbit anti-human cytokeratin 5 (KRT5) monoclonal antibody (green) to visualize basal cells; a (B) Hamster Anti-Mouse Podoplanin (PDPN) Monoclonal Antibody (Novus Biologicals, Catalog # NB600-1015; green) to visualize alveolar type I cells and a Goat Anti-Human p63/TP73L Polyclonal Antibody (Catalog # AF1916; red) to visualize basal cells; and a (C, D) Mouse Anti-MUC5AC Monoclonal Antibody (Novus Biologicals, Catalog # NBP2-15196; green) to visualize goblet cells and a Mouse Anti-Human/Mouse/Rat SOX2 Monoclonal Antibody (Catalog # MAB2018; red). All samples were counterstained with DAPI (Catalog # 5748; blue).
Detection of Human SOX2 by Immunocytochemistry/ Immunofluorescence
Characterization of NS/PCs derived from hiPSCs. b, Representative images (b) of immunocytochemical analysis of hiPSC-NS/PCs (NS/PC-A & NS/PC-B) using antibodies against SOX1, SOX2, & NESTIN. Inset: Hoechst nuclear staining of the same field. Scale bar, 50 μm. Image collected & cropped by CiteAb from the following open publication (https://pubmed.ncbi.nlm.nih.gov/37286713), licensed under a CC-BY license. Not internally tested by R&D Systems.
Detection of SOX2 by Western Blot
Characterization of cell lines.(A) H&E staining of tumor 5653, the arrow indicates the location of the tumor. The right panel shows a higher magnification. (B) Genotyping PCR on genomic wildtype mouse, genomic NPcis mouse (heterozygous for Nf1 and Tp53) DNA and DNA extracted from cell lines 17, 5653 and 5746. The glioma cell lines show complete loss of the wildtype allele for Nf1 and Tp53. (C) Western blot shows the expression of markers consistent with OPC lineage origin of our cell lines. SOX2 is expressed in Neural Progenitor cells (NPC) and Oligodendrocyte precursor cells (OPC); NG2 is expressed in OPCs. Markers (CPNase and MAG) expressed in pre-oligodendrocytes (pre-OL) or mature oligodendrocytes (OL) are not present, highlighting the progenitor status of our lines [22]. (D) The ATRX mutation (E2281*) present in TM31 was confirmed using sequencing. Top shows the reference genome DNA and protein sequence, bottom shows the TM31 sequence with STOP mutation. (E) The homozygous 4bp NF1 deletion (p.LF1247fs*18) present in TM31 was confirmed using sequencing. Top shows the reference genome DNA and protein sequence, bottom shows the TM31 sequence with the homozygous 4bp deletion inducing a frameshift. (F) Western blot for TP53 and CDKN2A, showing that both genes are absent in TM31, but not in glioma line LN319. Image collected and cropped by CiteAb from the following open publication (https://pubmed.ncbi.nlm.nih.gov/36730269), licensed under a CC-BY license. Not internally tested by R&D Systems.
Detection of Human SOX2 by Immunocytochemistry/ Immunofluorescence
Characterization of NS/PCs derived from hiPSCs. b, Representative images (b) of immunocytochemical analysis of hiPSC-NS/PCs (NS/PC-A & NS/PC-B) using antibodies against SOX1, SOX2, & NESTIN. Inset: Hoechst nuclear staining of the same field. Scale bar, 50 μm. Image collected & cropped by CiteAb from the following open publication (https://pubmed.ncbi.nlm.nih.gov/37286713), licensed under a CC-BY license. Not internally tested by R&D Systems.Applications for SOX2 Antibody (245610)
COMET
CyTOF-reported
Immunocytochemistry
Sample: Immersion fixed BG01V human embryonic stem cells and immersion fixed NTera‑2 human embryonic carcinoma cells
Immunohistochemistry
Sample: Immersion fixed paraffin-embedded sections of glioblastoma
Intracellular Staining by Flow Cytometry
Sample: NTera‑2 human embryonic carcinoma cell line fixed with Flow Cytometry Fixation Buffer (Catalog # FC004) and permeabilized with Flow Cytometry Permeabilization/Wash Buffer I (Catalog # FC005)
Multiplex Immunofluorescence
Sample: Immersion fixed paraffin-embedded sections of human Glioblastoma
Simple Western
Sample: BG01V human embryonic stem cells
Western Blot
Sample: NTera‑2 human testicular embryonic carcinoma cell line, F9 mouse teratocarcinoma stem cells, D3 mouse embryonic stem cell line, and rat cortical stem cells
Reviewed Applications
Read 17 reviews rated 4.5 using MAB2018 in the following applications:
Flow Cytometry Panel Builder
Bio-Techne Knows Flow Cytometry
Save time and reduce costly mistakes by quickly finding compatible reagents using the Panel Builder Tool.
Advanced Features
- Spectra Viewer - Custom analysis of spectra from multiple fluorochromes
- Spillover Popups - Visualize the spectra of individual fluorochromes
- Antigen Density Selector - Match fluorochrome brightness with antigen density

Formulation, Preparation, and Storage
Purification
Reconstitution
Reconstitute at 0.5 mg/mL in sterile PBS. For liquid material, refer to CoA for concentration.
Formulation
*Small pack size (-SP) is supplied either lyophilized or as a 0.2 µm filtered solution in PBS.
Shipping
Stability & Storage
- 12 months from date of receipt, -20 to -70 °C as supplied.
- 1 month, 2 to 8 °C under sterile conditions after reconstitution.
- 6 months, -20 to -70 °C under sterile conditions after reconstitution.
Calculators
Background: SOX2
References
- Graham, V. et al. (2003) Neuron 39:749.
- Avilion, A.A. et al. (2003) Genes Dev. 17:126.
- Kishi, M. et al. (2000) Development 127:791.
- Yuan, H. et al. (1995) Genes Dev. 9:2635.
- Uwanogho, D. et al. (1995) Mech. Dev. 49:23.
- Stevanovic, M. (2003) Mol. Biol. Rep. 30:127.
Long Name
Alternate Names
Entrez Gene IDs
Gene Symbol
UniProt
Additional SOX2 Products
Product Documents for SOX2 Antibody (245610)
Certificate of Analysis
To download a Certificate of Analysis, please enter a lot or batch number in the search box below.
Note: Certificate of Analysis not available for kit components.
Product Specific Notices for SOX2 Antibody (245610)
For research use only
Citations for SOX2 Antibody (245610)
 Powered by Bioz
Customer Reviews for SOX2 Antibody (245610) (17)
Have you used SOX2 Antibody (245610)?
Submit a review and receive an Amazon gift card!
$25/€18/£15/$25CAN/¥2500 Yen for a review with an image
$10/€7/£6/$10CAN/¥1110 Yen for a review without an image
Submit a review
Customer Images
-
Application: Immunofluorescence stainingSample Tested: Embryonic lungSpecies: MouseVerified Customer | Posted 10/30/2025
-
Application: ImmunohistochemistrySample Tested: Brain tissueSpecies: HumanVerified Customer | Posted 11/28/2024

-
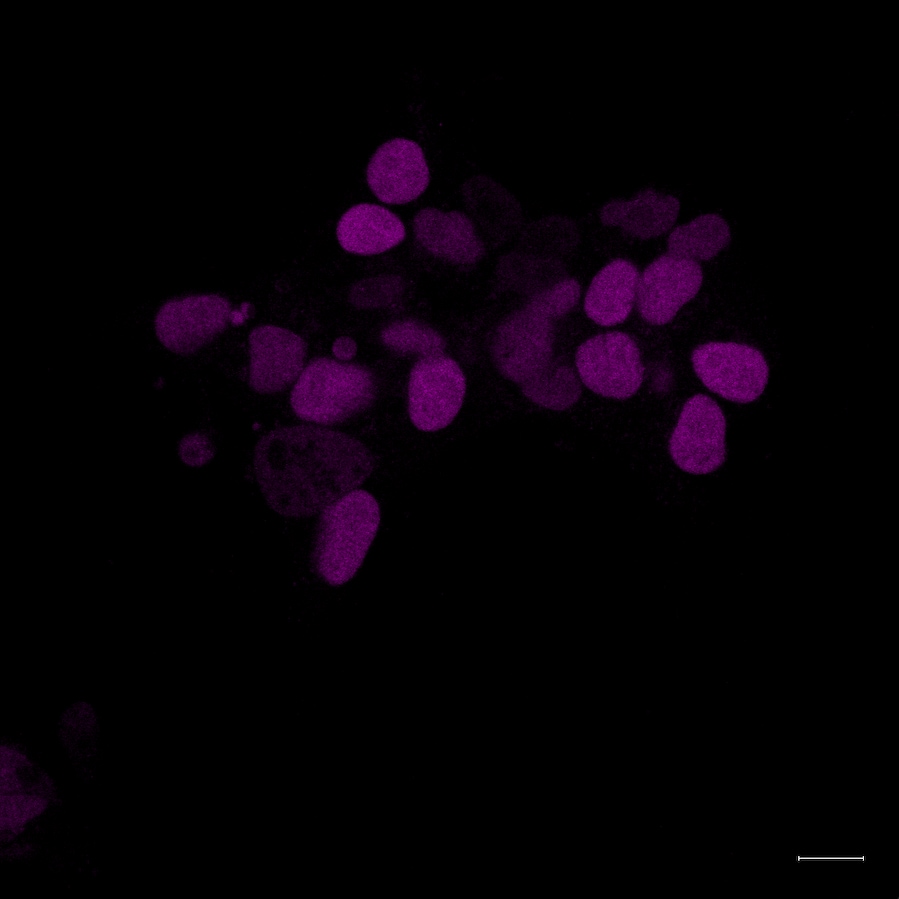
Application: Immunocytochemistry/ImmunofluorescenceSample Tested: BG01V human embryonic stem cellsSpecies: HumanVerified Customer | Posted 11/21/2024Concentration1:200 Human sample
-
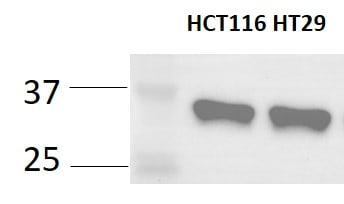
Application: Western BlotSample Tested: HT-29 human colon adenocarcinoma cell line and HCT-116 human colorectal carcinoma cell lineSpecies: HumanVerified Customer | Posted 10/24/2023SOX2 expression was examined by WB on two colorectal cancer cell lines. A clear band at 35KD was observed.
-
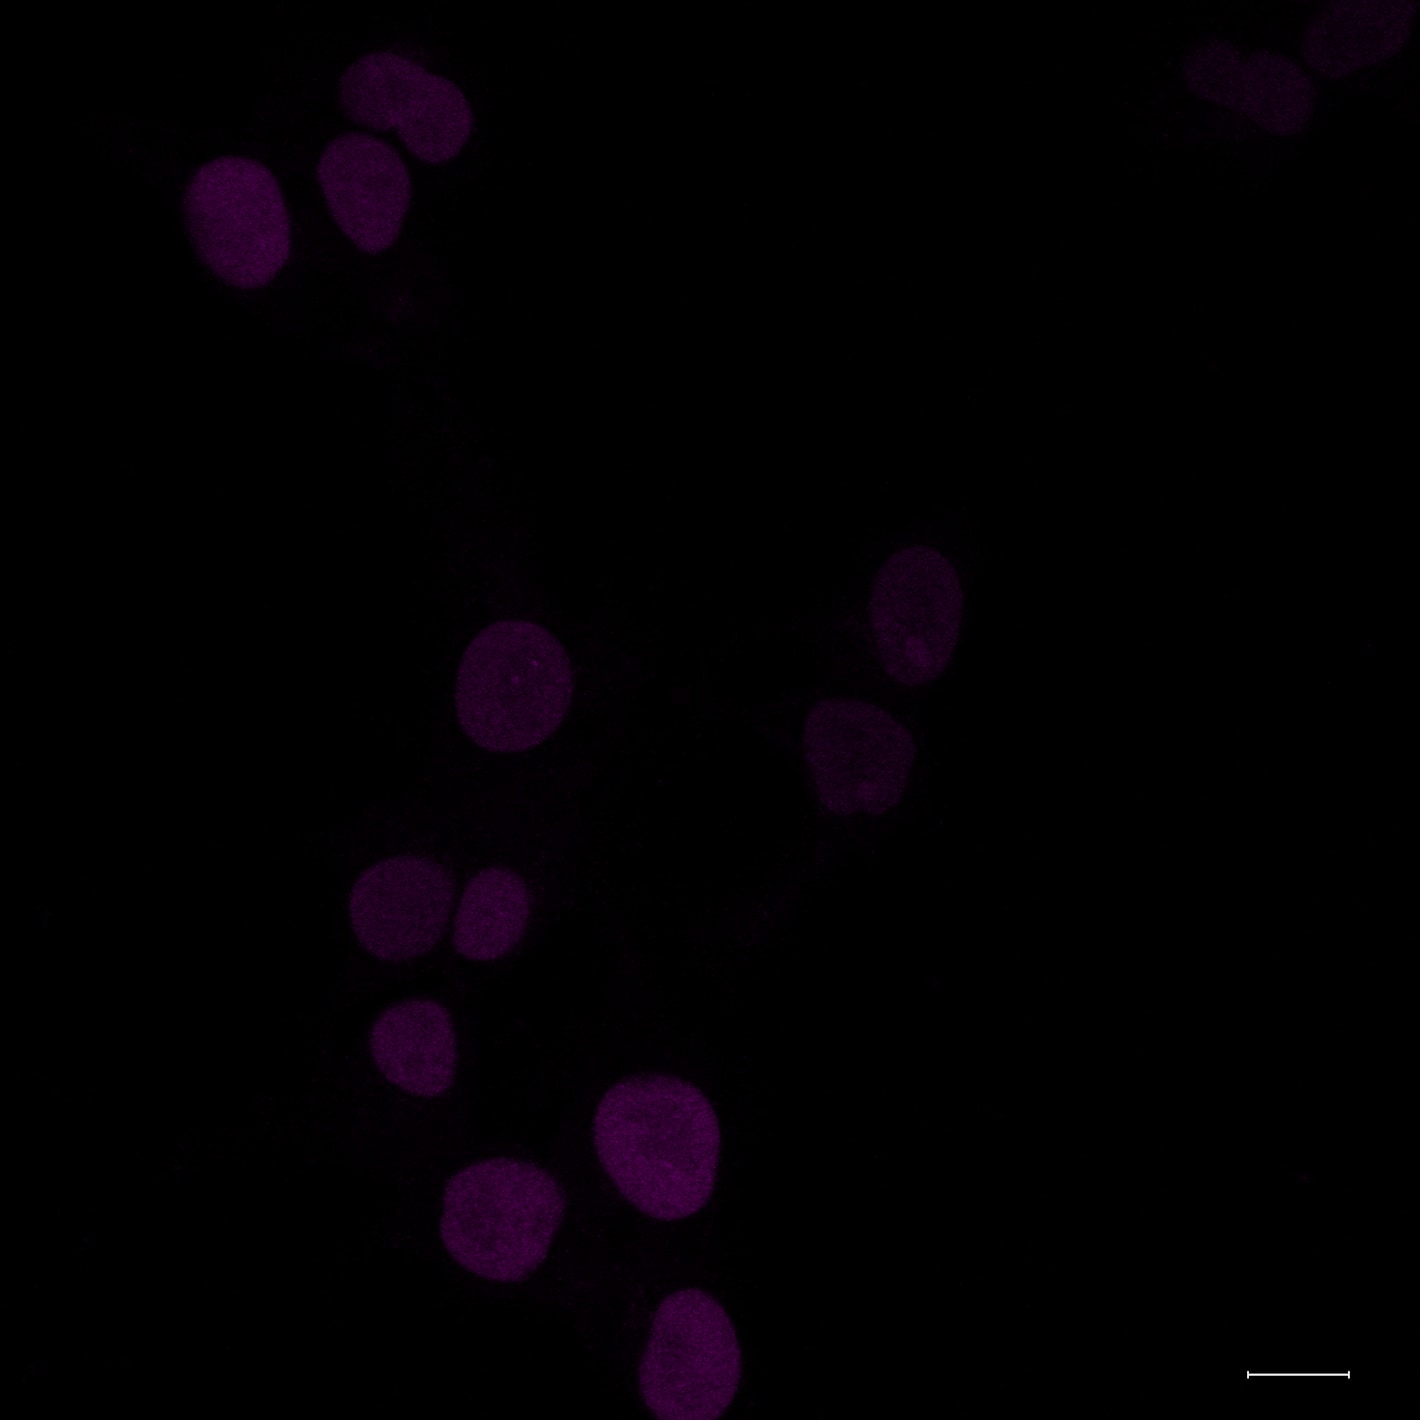
Application: Immunocytochemistry/ImmunofluorescenceSample Tested: glioblastoma cellsSpecies: HumanVerified Customer | Posted 08/06/2021On the photo SOX2 is red, nuclear DAPI is blue.
-
Application: Immunocytochemistry/ImmunofluorescenceSample Tested: iPS2 human induced pluripotent stem cellsSpecies: HumanVerified Customer | Posted 10/18/2018Cells: human induced pluripotent stem cells Primary antibody: anti-human SOX2 (1:200), O/N incubation at 4 degrees Secondary antibody: anti-mouse AF488
-
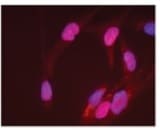
Application: ImmunohistochemistrySample Tested: Brain (forebrain)Species: MouseVerified Customer | Posted 02/16/2017Red: sox2. Green: ki67. Blue: DAPI. Postnatal day 7 sub-ventricular zone. 2% PFA fixed. Heat-mediated antigen retrieval. Blocked with 10% donkey serum, 0.5% Triton in PBS for 1h. Dilution 1:100.
-
Application: Immunocytochemistry/ImmunofluorescenceSample Tested: Neural progenitor cellsSpecies: HumanVerified Customer | Posted 02/03/2017
-
Application: Immunocytochemistry/ImmunofluorescenceSample Tested: Induced pluripotent stem cellsSpecies: HumanVerified Customer | Posted 12/15/2016I used this antibody to test Sox2 expression in iPS cells derived from fibroblasts of Sanfilippo syndrome C patients.
-
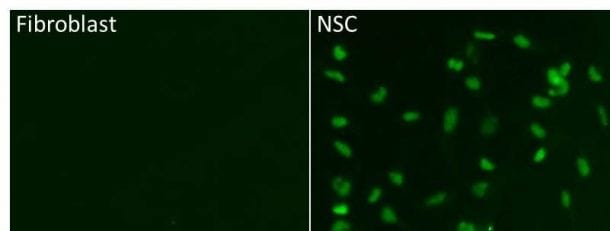
Application: Immunocytochemistry/ImmunofluorescenceSample Tested: human fibroblast and neural stem cellsSpecies: HumanVerified Customer | Posted 10/26/2015Specificity: Specific<br />Sensitivity: Reasonably sensitive<br />Buffer: 1% BSA + 0.3% Triton X-100 in PBS<br />Dilution: 1/100
-
Application: Western BlotSample Tested: Human cellsSpecies: HumanVerified Customer | Posted 10/26/2015Specificity: Specific<br />Sensitivity: Sensitive<br />Buffer: 5% BSA in TBST<br />Dilution: 1/1000
-
Application: Immunocytochemistry/ImmunofluorescenceSample Tested: human NSCSpecies: HumanVerified Customer | Posted 10/26/2015Specificity: Specific<br />Sensitivity: Reasonably sensitive<br />Buffer: 1% BSA + 0.3% Triton X-100 in PBS<br />Dilution: 1/100
-
Application: ImmunofluorescenceSample Tested: See PMID 22791629Species: RatVerified Customer | Posted 02/16/2015
-
Application: ImmunofluorescenceSample Tested: See PMID 19824823Species: HumanVerified Customer | Posted 02/16/2015
-
Application: ImmunofluorescenceSample Tested: See PMID 19825428Species: MouseVerified Customer | Posted 02/16/2015
-
Application: ImmunofluorescenceSample Tested: See PMID 23658023Species: HumanVerified Customer | Posted 02/16/2015
-
Application: ImmunofluorescenceSample Tested: See PMID 22573702Species: OtherVerified Customer | Posted 02/16/2015
There are no reviews that match your criteria.
Protocols
Find general support by application which include: protocols, troubleshooting, illustrated assays, videos and webinars.
- 7-Amino Actinomycin D (7-AAD) Cell Viability Flow Cytometry Protocol
- Antigen Retrieval Protocol (PIER)
- Antigen Retrieval for Frozen Sections Protocol
- Appropriate Fixation of IHC/ICC Samples
- Cellular Response to Hypoxia Protocols
- Chromogenic IHC Staining of Formalin-Fixed Paraffin-Embedded (FFPE) Tissue Protocol
- Chromogenic Immunohistochemistry Staining of Frozen Tissue
- ClariTSA™ Fluorophore Kits
- Detection & Visualization of Antibody Binding
- Extracellular Membrane Flow Cytometry Protocol
- Flow Cytometry Protocol for Cell Surface Markers
- Flow Cytometry Protocol for Staining Membrane Associated Proteins
- Flow Cytometry Staining Protocols
- Flow Cytometry Troubleshooting Guide
- Fluorescent IHC Staining of Frozen Tissue Protocol
- Graphic Protocol for Heat-induced Epitope Retrieval
- Graphic Protocol for the Preparation and Fluorescent IHC Staining of Frozen Tissue Sections
- Graphic Protocol for the Preparation and Fluorescent IHC Staining of Paraffin-embedded Tissue Sections
- Graphic Protocol for the Preparation of Gelatin-coated Slides for Histological Tissue Sections
- ICC Cell Smear Protocol for Suspension Cells
- ICC Immunocytochemistry Protocol Videos
- ICC for Adherent Cells
- IHC Sample Preparation (Frozen sections vs Paraffin)
- Immunocytochemistry (ICC) Protocol
- Immunocytochemistry Troubleshooting
- Immunofluorescence of Organoids Embedded in Cultrex Basement Membrane Extract
- Immunofluorescent IHC Staining of Formalin-Fixed Paraffin-Embedded (FFPE) Tissue Protocol
- Immunohistochemistry (IHC) and Immunocytochemistry (ICC) Protocols
- Immunohistochemistry Frozen Troubleshooting
- Immunohistochemistry Paraffin Troubleshooting
- Intracellular Flow Cytometry Protocol Using Alcohol (Methanol)
- Intracellular Flow Cytometry Protocol Using Detergents
- Intracellular Nuclear Staining Flow Cytometry Protocol Using Detergents
- Intracellular Staining Flow Cytometry Protocol Using Alcohol Permeabilization
- Intracellular Staining Flow Cytometry Protocol Using Detergents to Permeabilize Cells
- Preparing Samples for IHC/ICC Experiments
- Preventing Non-Specific Staining (Non-Specific Binding)
- Primary Antibody Selection & Optimization
- Propidium Iodide Cell Viability Flow Cytometry Protocol
- Protocol for Heat-Induced Epitope Retrieval (HIER)
- Protocol for Liperfluo
- Protocol for Making a 4% Formaldehyde Solution in PBS
- Protocol for VisUCyte™ HRP Polymer Detection Reagent
- Protocol for the Characterization of Human Th22 Cells
- Protocol for the Characterization of Human Th9 Cells
- Protocol for the Fluorescent ICC Staining of Cell Smears - Graphic
- Protocol for the Fluorescent ICC Staining of Cultured Cells on Coverslips - Graphic
- Protocol for the Preparation & Fixation of Cells on Coverslips
- Protocol for the Preparation and Chromogenic IHC Staining of Frozen Tissue Sections
- Protocol for the Preparation and Chromogenic IHC Staining of Frozen Tissue Sections - Graphic
- Protocol for the Preparation and Chromogenic IHC Staining of Paraffin-embedded Tissue Sections
- Protocol for the Preparation and Chromogenic IHC Staining of Paraffin-embedded Tissue Sections - Graphic
- Protocol for the Preparation and Fluorescent ICC Staining of Cells on Coverslips
- Protocol for the Preparation and Fluorescent ICC Staining of Non-adherent Cells
- Protocol for the Preparation and Fluorescent ICC Staining of Stem Cells on Coverslips
- Protocol for the Preparation and Fluorescent IHC Staining of Frozen Tissue Sections
- Protocol for the Preparation and Fluorescent IHC Staining of Paraffin-embedded Tissue Sections
- Protocol for the Preparation of Gelatin-coated Slides for Histological Tissue Sections
- Protocol for the Preparation of a Cell Smear for Non-adherent Cell ICC - Graphic
- Protocol: Annexin V and PI Staining by Flow Cytometry
- Protocol: Annexin V and PI Staining for Apoptosis by Flow Cytometry
- R&D Systems Quality Control Western Blot Protocol
- TUNEL and Active Caspase-3 Detection by IHC/ICC Protocol
- The Importance of IHC/ICC Controls
- Troubleshooting Guide: Fluorokine Flow Cytometry Kits
- Troubleshooting Guide: Immunohistochemistry
- Troubleshooting Guide: Western Blot Figures
- Western Blot Conditions
- Western Blot Protocol
- Western Blot Protocol for Cell Lysates
- Western Blot Troubleshooting
- Western Blot Troubleshooting Guide
- View all Protocols, Troubleshooting, Illustrated assays and Webinars
FAQs for SOX2 Antibody (245610)
-
Q: What is the light chain of Human/Mouse/Rat SOX2 Antibody, Catalog #s MAB2018, MAB2018R and IC2018?
A: Catalog #s MAB2018, MAB2018R and IC2018 all have a kappa light chain.

