Human IL-2 Antibody (5334)
R&D Systems | Catalog # MAB202

Key Product Details
Validated by
Species Reactivity
Validated:
Cited:
Applications
Validated:
Cited:
Label
Antibody Source
Product Specifications
Immunogen
Ala21-Thr153
Accession # NP_000577
Specificity
Clonality
Host
Isotype
Endotoxin Level
Scientific Data Images for Human IL-2 Antibody (5334)
Detection of IL‑2 in PBMC's treated with PMA and Ca2+ ionomycin vs untreated PBMC's by Flow Cytometry
PBMC's treated with PMA (50ng/mL) and Ca2+ ionomycin (200ng/mL) overnight (A) vs untreated PBMC's (B) were stained with Mouse Anti-Human IL‑2 Monoclonal Antibody (Catalog # mab202) and Mouse Anti-Human CD3 epsilon APC‑conjugated Monoclonal Antibody (Catalog # FAB100A) followed by Phycoerythrin-conjugated Anti-Mouse IgG Secondary Antibody (Catalog # F0102B). To facilitate intracellular staining, cells were fixed with Flow Cytometry Fixation Buffer (Catalog # FC004) and permeabilized with Flow Cytometry Permeabilization/Wash Buffer I (Catalog # FC005). View our protocol for Staining Intracellular Molecules.
Cell Proliferation Induced by IL‑2 and Neutralization by Human IL‑2 Antibody.
Human IL 2 Antibody (Catalog # MAB202) neutralizes IL-2-induced proliferation in the CTLL-2 mouse cytotoxic T cell line. The Neuralization Dose (ND50) is typically 5.00-60.0 ng/mL.
IL‑2 in Human PBMCs.
IL-2 was detected in immersion fixed human peripheral blood mononuclear cells (PBMCs) treated with calcium ionomycin and PMA using Mouse Anti-Human IL-2 Monoclonal Antibody (Catalog # MAB202) at 8 µg/mL for 3 hours at room temperature. Cells were stained using the NorthernLights™ 557-conjugated Anti-Mouse IgG Secondary Antibody (red; Catalog # NL007) and counterstained with DAPI (blue). Specific staining was localized to cytoplasm. View our protocol for Fluorescent ICC Staining of Non-adherent Cells.
Detection of Human IL-2 by Flow Cytometry
SLE CD4+ T cells are poised to activate IL-2 signaling during Treg differentiation. (A) Naïve CD4+ T cells were isolated from a systemic lupus erythematosus (SLE) patient & matched healthy control (HC) subject, & cultured for 3 days in the presence of anti-CD3/CD28 & TGF-beta (5 ng/ml) with IL-2 (50 IU/ml) or anti-IL-2 (100 or 1,000 ng/ml). The frequency of CD4+CD25+FOXP3+ cells was determined by flow cytometry. Numbers below the plots represent the frequency of CD4+CD25+FOXP3+ Tregs. The dot plots on the left end represent isotype control staining. (B) CD4+ T cells isolated from matched SLE & HC subjects were cultured for 3 days in the presence of anti-CD3/CD28 & TGF-beta (20 ng/ml) with or without IL-2 (100 IU/ml) or anti-IL-2 (100 ng/ml). Total STAT5 & its phosphorylation at tyrosine 694 were detected by immunoblotting. Representative immunoblot staining (left panel). The signal intensity of phospho-STAT5 & total STAT5 was normalized to that of actin. The normalized pSTAT5 signal intensity (middle panel) & the ratio of normalized pSTAT5 signal intensity over normalized STAT5 signal intensity (right panel) from 3 pairs of matched HC & SLE subjects. (C) Untouched T cells from matched SLE & HC subjects were cultured for 3 days without anti-CD3/CD28 stimulation. Expression of CD25 & FOXP3 in CD4+ cells were determined by flow cytometry. Representative flow cytometry dot plots are shown (left panel). Cumulative data of frequency of CD4+CD25+FOXP3+ & CD4+CD25+ cells, mean fluorescence intensity (MFI) of CD25 expression in CD4+ T cells, & the proportion of CD4+CD25+FOXP3+ cells among CD4+CD25+ cells from 17 pairs of matched SLE & HC subjects (right panel). Data were analyzed by a paired two-tailed t-test (*p<0.05, **p<0.01, ****p<0.0001). Image collected & cropped by CiteAb from the following open publication (https://www.frontiersin.org/articles/10.3389/fimmu.2021.635531/full), licensed under a CC-BY license. Not internally tested by R&D Systems.
Detection of Human IL-2 by Western Blot
SLE CD4+ T cells are poised to activate IL-2 signaling during Treg differentiation. (A) Naïve CD4+ T cells were isolated from a systemic lupus erythematosus (SLE) patient & matched healthy control (HC) subject, & cultured for 3 days in the presence of anti-CD3/CD28 & TGF-beta (5 ng/ml) with IL-2 (50 IU/ml) or anti-IL-2 (100 or 1,000 ng/ml). The frequency of CD4+CD25+FOXP3+ cells was determined by flow cytometry. Numbers below the plots represent the frequency of CD4+CD25+FOXP3+ Tregs. The dot plots on the left end represent isotype control staining. (B) CD4+ T cells isolated from matched SLE & HC subjects were cultured for 3 days in the presence of anti-CD3/CD28 & TGF-beta (20 ng/ml) with or without IL-2 (100 IU/ml) or anti-IL-2 (100 ng/ml). Total STAT5 & its phosphorylation at tyrosine 694 were detected by immunoblotting. Representative immunoblot staining (left panel). The signal intensity of phospho-STAT5 & total STAT5 was normalized to that of actin. The normalized pSTAT5 signal intensity (middle panel) & the ratio of normalized pSTAT5 signal intensity over normalized STAT5 signal intensity (right panel) from 3 pairs of matched HC & SLE subjects. (C) Untouched T cells from matched SLE & HC subjects were cultured for 3 days without anti-CD3/CD28 stimulation. Expression of CD25 & FOXP3 in CD4+ cells were determined by flow cytometry. Representative flow cytometry dot plots are shown (left panel). Cumulative data of frequency of CD4+CD25+FOXP3+ & CD4+CD25+ cells, mean fluorescence intensity (MFI) of CD25 expression in CD4+ T cells, & the proportion of CD4+CD25+FOXP3+ cells among CD4+CD25+ cells from 17 pairs of matched SLE & HC subjects (right panel). Data were analyzed by a paired two-tailed t-test (*p<0.05, **p<0.01, ****p<0.0001). Image collected & cropped by CiteAb from the following open publication (https://www.frontiersin.org/articles/10.3389/fimmu.2021.635531/full), licensed under a CC-BY license. Not internally tested by R&D Systems.
Detection of Human IL-2 by Flow Cytometry
IL-2 expands IL-13+IFN-gamma + CD8+ T cells in systemic lupus erythematosus (SLE). (A) CD4+ and CD8+ T cells from matched SLE and health control (HC) subjects were cultured as described in Figure 2, and IL-13 and IFN-gamma expression was determined by flow cytometry. (B) Cumulative data of mean fluorescence intensity (MFI) of IFN-gamma and the frequency of IFN-gamma + and IL-13+IFN-gamma + cells. Statistical analysis was made by two-way ANOVA followed by Bonferroni’s correction for multiple comparisons (*p<0.05, **p<0.01, ****p<0.0001). Image collected and cropped by CiteAb from the following open publication (https://www.frontiersin.org/articles/10.3389/fimmu.2021.635531/full), licensed under a CC-BY license. Not internally tested by R&D Systems.
Detection of Human IL-2 by Western Blot
IL-2 induces STAT6 phosphorylation and GATA3 expression in systemic lupus erythematosus (SLE) CD8+ T cells. (A) CD8+ T cells from matched SLE and health control (HC) subjects were cultured as described in Figure 2. Expression of GATA-3 and phosphorylation of STAT5 at tyrosine 694 and STAT6 at tyrosine 641 were detected by immunoblotting. Representative immunoblot staining was presented. Lo and Hi concentrations of anti-IL-2 denote 100 and 1,000 ng/ml, respectively. (B) The signal intensity of phospho-STAT5, phospho-STAT6, and GATA-3 were normalized to that of actin. Cumulative data from 9 pairs of matched HC and SLE subjects. Data were analyzed by a two-tailed t-test (*p<0.05, **p<0.01, ***p<0.001). (C) Pearson’s and Spearman’s correlation analyses were performed to determine the association between the expression of cytokines (IL-13, IL-5, and IFN-gamma ) and transcription factors (phospho-STAT5, phospho-STAT6, and GATA-3). The blue and red plots represent data from HC and SLE patients, respectively. Spearman correlation coefficient was presented for the association between IL-13 and phospho-STAT5, IL-5 and phospho-STAT-5, and IFN-gamma and GATA-3. Pearson correlation coefficient was presented for the remainder of associations. Image collected and cropped by CiteAb from the following open publication (https://www.frontiersin.org/articles/10.3389/fimmu.2021.635531/full), licensed under a CC-BY license. Not internally tested by R&D Systems.Applications for Human IL-2 Antibody (5334)
CyTOF-ready
Immunocytochemistry
Sample: Immersion fixed human peripheral blood mononuclear cells treated with calcium ionomycin and PMA
Intracellular Staining by Flow Cytometry
Sample: Human peripheral blood mononuclear cells treated with PMA and Ca2+ ionomycin, fixed with paraformaldehyde, and permeabilized with saponin
Neutralization
Reviewed Applications
Read 2 reviews rated 4.5 using MAB202 in the following applications:
Flow Cytometry Panel Builder
Bio-Techne Knows Flow Cytometry
Save time and reduce costly mistakes by quickly finding compatible reagents using the Panel Builder Tool.
Advanced Features
- Spectra Viewer - Custom analysis of spectra from multiple fluorochromes
- Spillover Popups - Visualize the spectra of individual fluorochromes
- Antigen Density Selector - Match fluorochrome brightness with antigen density

Formulation, Preparation, and Storage
Purification
Reconstitution
Reconstitute at 0.5 mg/mL in sterile PBS. For liquid material, refer to CoA for concentration.
Formulation
*Small pack size (-SP) is supplied either lyophilized or as a 0.2 µm filtered solution in PBS.
Shipping
Stability & Storage
- 12 months from date of receipt, -20 to -70 °C as supplied.
- 1 month, 2 to 8 °C under sterile conditions after reconstitution.
- 6 months, -20 to -70 °C under sterile conditions after reconstitution.
Calculators
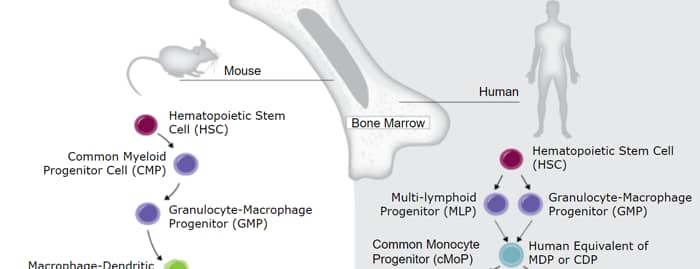
Background: IL-2
Long Name
Alternate Names
Entrez Gene IDs
Gene Symbol
UniProt
Additional IL-2 Products
Product Documents for Human IL-2 Antibody (5334)
Certificate of Analysis
To download a Certificate of Analysis, please enter a lot or batch number in the search box below.
Note: Certificate of Analysis not available for kit components.
Product Specific Notices for Human IL-2 Antibody (5334)
For research use only
Related Research Areas
Citations for Human IL-2 Antibody (5334)
 Powered by Bioz
Customer Reviews for Human IL-2 Antibody (5334) (2)
Have you used Human IL-2 Antibody (5334)?
Submit a review and receive an Amazon gift card!
$25/€18/£15/$25CAN/¥2500 Yen for a review with an image
$10/€7/£6/$10CAN/¥1110 Yen for a review without an image
Submit a review
Customer Images

-
Application: Flow CytometrySample Tested: BUD-8 human fibroblast cell lineSpecies: HumanVerified Customer | Posted 11/16/2020
-
Application: Western BlotSample Tested: SerumSpecies: HumanVerified Customer | Posted 12/12/2019

There are no reviews that match your criteria.
Protocols
Find general support by application which include: protocols, troubleshooting, illustrated assays, videos and webinars.
- 7-Amino Actinomycin D (7-AAD) Cell Viability Flow Cytometry Protocol
- Appropriate Fixation of IHC/ICC Samples
- Cellular Response to Hypoxia Protocols
- ClariTSA™ Fluorophore Kits
- Detection & Visualization of Antibody Binding
- Extracellular Membrane Flow Cytometry Protocol
- Flow Cytometry Protocol for Cell Surface Markers
- Flow Cytometry Protocol for Staining Membrane Associated Proteins
- Flow Cytometry Staining Protocols
- Flow Cytometry Troubleshooting Guide
- ICC Cell Smear Protocol for Suspension Cells
- ICC Immunocytochemistry Protocol Videos
- ICC for Adherent Cells
- Immunocytochemistry (ICC) Protocol
- Immunocytochemistry Troubleshooting
- Immunofluorescence of Organoids Embedded in Cultrex Basement Membrane Extract
- Immunohistochemistry (IHC) and Immunocytochemistry (ICC) Protocols
- Intracellular Flow Cytometry Protocol Using Alcohol (Methanol)
- Intracellular Flow Cytometry Protocol Using Detergents
- Intracellular Nuclear Staining Flow Cytometry Protocol Using Detergents
- Intracellular Staining Flow Cytometry Protocol Using Alcohol Permeabilization
- Intracellular Staining Flow Cytometry Protocol Using Detergents to Permeabilize Cells
- Preparing Samples for IHC/ICC Experiments
- Preventing Non-Specific Staining (Non-Specific Binding)
- Primary Antibody Selection & Optimization
- Propidium Iodide Cell Viability Flow Cytometry Protocol
- Protocol for Liperfluo
- Protocol for VisUCyte™ HRP Polymer Detection Reagent
- Protocol for the Characterization of Human Th22 Cells
- Protocol for the Characterization of Human Th9 Cells
- Protocol for the Fluorescent ICC Staining of Cell Smears - Graphic
- Protocol for the Fluorescent ICC Staining of Cultured Cells on Coverslips - Graphic
- Protocol for the Preparation and Fluorescent ICC Staining of Cells on Coverslips
- Protocol for the Preparation and Fluorescent ICC Staining of Non-adherent Cells
- Protocol for the Preparation and Fluorescent ICC Staining of Stem Cells on Coverslips
- Protocol for the Preparation of a Cell Smear for Non-adherent Cell ICC - Graphic
- Protocol: Annexin V and PI Staining by Flow Cytometry
- Protocol: Annexin V and PI Staining for Apoptosis by Flow Cytometry
- TUNEL and Active Caspase-3 Detection by IHC/ICC Protocol
- The Importance of IHC/ICC Controls
- Troubleshooting Guide: Fluorokine Flow Cytometry Kits
- View all Protocols, Troubleshooting, Illustrated assays and Webinars
FAQs for Human IL-2 Antibody (5334)
-
Q: Can Catalog # MAB202 (anti-Human IL-2 antibody) be used for neutralization of mouse IL-2?
A: No. MAB202 is not cross-reactive to mouse IL-2 and so cannot be used for neutralization of mouse IL-2.
Associated Pathways