Importin beta/KPNB1 Antibody (845208)
R&D Systems | Catalog # MAB8209

Key Product Details
Validated by
Biological Validation
Species Reactivity
Validated:
Human, Mouse, Rat
Cited:
Mouse
Applications
Validated:
Western Blot, Immunocytochemistry
Cited:
Western Blot, Immunocytochemistry
Label
Unconjugated
Antibody Source
Monoclonal Mouse IgG2B Clone # 845208
Loading...
Product Specifications
Immunogen
E. coli-derived recombinant human Importin beta /KPNB1
Met1-Gly155
Accession # Q14974
Met1-Gly155
Accession # Q14974
Specificity
Detects human Importin beta /KPNB1 in ELISA and Western Blot. It detects mouse and rat Importin beta /KPNB1 in Western Blots.
Clonality
Monoclonal
Host
Mouse
Isotype
IgG2B
Scientific Data Images for Importin beta/KPNB1 Antibody (845208)
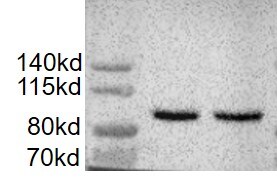
Detection of Human, Mouse, and Rat Importin beta /KPNB1 by Western Blot.
Western blot shows lysates of HeLa human cervical epithelial carcinoma cell line, NIH-3T3 mouse embryonic fibroblast cell line, and Rat-2 rat embryonic fibroblast cell line. PVDF membrane was probed with 1 µg/mL of Mouse Anti-Human Importin beta /KPNB1 Monoclonal Antibody (Catalog # MAB8209) followed by HRP-conjugated Anti-Mouse IgG Secondary Antibody (Catalog # HAF018). A specific band was detected for Importin beta /KPNB1 at approximately 97 kDa (as indicated). This experiment was conducted under reducing conditions and using Immunoblot Buffer Group 1.
Importin beta /KPNB1 in HeLa Human Cell Line.
Importin beta /KPNB1 was detected in immersion fixed HeLa human cervical epithelial carcinoma cell line using Mouse Anti-Human Importin beta /KPNB1 Monoclonal Antibody (Catalog # MAB8209) at 25 µg/mL for 3 hours at room temperature. Cells were stained using the NorthernLights™ 557-conjugated Anti-Mouse IgG Secondary Antibody (red; Catalog # NL007) and counterstained with DAPI (blue). Specific staining was localized to nuclei. View our protocol for Fluorescent ICC Staining of Cells on Coverslips.
Detection of Human Importin beta/KPNB1 by Western Blot
cNLSs are necessary for Gli2 nuclear import.(A) Sequences in Gli2_Mm predicted as cNLSs by cNLS-Mapper [40] using a cut-off of 5 with the corresponding scores (out of 10). Residues that were mutated for alanines in the mutNLS constructs are in bold. The mutated sequences are not predicted (n.p.) as cNLS. (B) Transduced NIH/3T3 cells expressing GFP-Gli2, wt or cNLS mutants (mutNLS-1, mutNLS-2 or mutNLS-1+2), were treated with SAG for 90 min or DMSO as control. Cells were stained for cilium (anti-Ac.Tub, red), GFP-Gli2 (anti-GFP, green) and nucleus (DAPI, blue). The same pictures are also shown with the channel corresponding to GFP-Gli2 in grey scale to help the visualization. Scale bar: 10 μm. (C) Quantification of nuclear Gli2 was performed as explained in Fig 1C. Black, solid line indicates comparison between control and Hh activated conditions for wtGli2, dotted line indicates comparison between wtGli2 under basal condition and mutNLS-1 or mutNLS-1+2 under basal or activated conditions and black, discontinued line indicates comparison between activated conditions for wtGl2 and mutNLS-2. *p<0.01, *** p<0.0001 (Kruskal-Wallis test). (B) and (C) are representative of four independent experiments and at least 70 cells were analysed for each condition. (D) WB detecting Imp-alpha 1 after precipitating GFP-Gli2 or GFP-Gli2-mutNLS-1+2 with GFP-Trap from NIH/3T3 Flp-In expressing at endogenous levels the constructs mentioned above. Membranes were cut at different levels so as to detect in the same samples the precipitated GFP-Gli2 (using an anti-Gli2 antibody) and GFP (left panels). Image collected and cropped by CiteAb from the following publication (https://pubmed.ncbi.nlm.nih.gov/27579771), licensed under a CC-BY license. Not internally tested by R&D Systems.
Detection of Human Importin beta/KPNB1 by Western Blot
Imp-alpha / beta 1 transports Gli2 into the nucleus.(A) Two segments of a T-Coffee [69] alignment of four Gli-like sequences: GLI2_Mm (Mus musculus), GLI2_Hs, GLI1_Hs, GLI3_Hs (Homo sapiens) and Ci_Dm (Drosophila melanogaster). Residue similarity is colour coded according to the Risler substitution matrix, using ESPript [70]. Dots mark 10-residue intervals of the top sequence. Black bars indicate the two bipartite cNLS (cNLS-1 and cNLS-2) predicted by cNLS mapper [40] for GLI2_Mm. (B) GFP-Gli2-NIH/3T3 cells were treated with Importazol (IPZ) in order to inhibit Imp-beta 1-mediated nuclear transport. DMSO was used as control. Hh signalling was activated for 90 min using SAG and non-stimulated cells were treated with DMSO. Cells were stained for cilium (anti-Ac.Tub, red), GFP-Gli2 (anti-GFP, green) and nucleus (TOPRO, blue). The same pictures are also shown with the channel corresponding to GFP-Gli2 in grey scale to help the visualization. Scale bar: 10 μm. (C) Quantification of nuclear Gli2 was performed as explained in Materials and Methods. The mean nuclear fluorescence was normalised against the mean total GFP fluorescence of the cell, so as to correct for variations in Gli2 expression among different cells. Results are representative of three experiments and at least 60 cells were analysed for each condition. ** p<0.001, *** p<0.0001 (Kruskal-Wallis test). (D) Activation of a luciferase-based Hh reporter gene in NIH/3T3 cells stimulated with SAG (or DMSO as control) in the presence of IPZ or DMSO. As explained in Materials and Methods, RLU values from SAG treated cells are normalised against RLU of DMSO treated ones and expressed as mean ± s.d. from triplicates from two independent experiments. * p< 0.01 (Mann-Whitney test). (E) Western blot (WB) showing GFP-Gli2 levels in control and IPZ-treated cells. GFP-Gli2 was detected using an anti-GFP antibody. (F-G) WB detecting Imp-beta 1 (F) and Imp-alpha 1 (G) after precipitating GFP-Gli2 with GFP-Trap (left) from HEK293FT transfected with
Detection of Mouse Importin beta/KPNB1 by Western Blot
Imp-alpha / beta 1 transports Gli2 into the nucleus.(A) Two segments of a T-Coffee [69] alignment of four Gli-like sequences: GLI2_Mm (Mus musculus), GLI2_Hs, GLI1_Hs, GLI3_Hs (Homo sapiens) and Ci_Dm (Drosophila melanogaster). Residue similarity is colour coded according to the Risler substitution matrix, using ESPript [70]. Dots mark 10-residue intervals of the top sequence. Black bars indicate the two bipartite cNLS (cNLS-1 and cNLS-2) predicted by cNLS mapper [40] for GLI2_Mm. (B) GFP-Gli2-NIH/3T3 cells were treated with Importazol (IPZ) in order to inhibit Imp-beta 1-mediated nuclear transport. DMSO was used as control. Hh signalling was activated for 90 min using SAG and non-stimulated cells were treated with DMSO. Cells were stained for cilium (anti-Ac.Tub, red), GFP-Gli2 (anti-GFP, green) and nucleus (TOPRO, blue). The same pictures are also shown with the channel corresponding to GFP-Gli2 in grey scale to help the visualization. Scale bar: 10 μm. (C) Quantification of nuclear Gli2 was performed as explained in Materials and Methods. The mean nuclear fluorescence was normalised against the mean total GFP fluorescence of the cell, so as to correct for variations in Gli2 expression among different cells. Results are representative of three experiments and at least 60 cells were analysed for each condition. ** p<0.001, *** p<0.0001 (Kruskal-Wallis test). (D) Activation of a luciferase-based Hh reporter gene in NIH/3T3 cells stimulated with SAG (or DMSO as control) in the presence of IPZ or DMSO. As explained in Materials and Methods, RLU values from SAG treated cells are normalised against RLU of DMSO treated ones and expressed as mean ± s.d. from triplicates from two independent experiments. * p< 0.01 (Mann-Whitney test). (E) Western blot (WB) showing GFP-Gli2 levels in control and IPZ-treated cells. GFP-Gli2 was detected using an anti-GFP antibody. (F-G) WB detecting Imp-beta 1 (F) and Imp-alpha 1 (G) after precipitating GFP-Gli2 with GFP-Trap (left) from HEK293FT transfected with
Detection of Human Importin beta/KPNB1 by Western Blot
Imp-beta 2 is involved in moving Gli2 into the cilium.(A) NIH/3T3 Flp-In cells expressing GFP-Gli2 were transfected with either myc-MBP-M9M or myc-MBP as control, stimulated with SAG and Gli2 ciliary localization was analysed in transfected cells. Cells were stained for cilium (anti-Ac.Tub, red), GFP-Gli2 (anti-GFP, green), myc-MBP or myc-MBP-M9M (anti-myc, magenta) and nucleus (DAPI, blue). Small pictures show amplification of the selected region. Yellow and white arrows indicate cilia with or without Gli2 at the ciliary tip respectively. Scale bar: 10 μm. (B) Quantification of Gli2 ciliary localization in transfected cells. Results are expressed as the fraction of Gli2 positive cilia in transfected cells with 95% CI. At least 50 cilia from transfected cells were analysed for each sample.* p<0.05, **p<0,001 (hypothesis test for proportions). (C) Fraction of ciliated cells among transfected cells, expressed as 95% CI. At least 120 transfected cells were analysed in each condition. n.s. (not significant) p>0.05 (hypothesis test for proportions). (D) Measurement of cilia length in transfected cells. Each point represents a measurement for a single cilium; red lines represent the median length. At least 60 cilia were measured for each condition. n.s. (not significant) p>0.05 (Mann-Whitney test). (E) WB detecting Imp-beta 2 after precipitating GFP-Gli2 with GFP-Trap from HEK293FT transfected with pEGFP-Gli2. Membranes were cut at different levels so as to detect in the same samples the precipitated GFP-Gli2 and GFP. The levels of GFP-Gli2, Imp-beta 2 and GFP in the lysates used for immunoprecipitation were assessed by WB. The band corresponding to GFP looks distorted because the protein migrates with the dye front. (F) Quantification of nuclear Gli2 in transfected cells was performed as described in Fig 1C. At least 60 cells were analysed for each condition. *** p<0.0001 (Kruskal-Wallis test). (A-E) are representative of 3 independent experiments. (G) Activation of a luciferase-basApplications for Importin beta/KPNB1 Antibody (845208)
Application
Recommended Usage
Immunocytochemistry
8-25 µg/mL
Sample: Immersion fixed HeLa human cervical epithelial carcinoma cell line
Sample: Immersion fixed HeLa human cervical epithelial carcinoma cell line
Western Blot
1 µg/mL
Sample: HeLa human cervical epithelial carcinoma cell line, NIH‑3T3 mouse embryonic fibroblast cell line, and Rat‑2 rat embryonic fibroblast cell line
Sample: HeLa human cervical epithelial carcinoma cell line, NIH‑3T3 mouse embryonic fibroblast cell line, and Rat‑2 rat embryonic fibroblast cell line
Reviewed Applications
Read 3 reviews rated 4.7 using MAB8209 in the following applications:
Formulation, Preparation, and Storage
Purification
Protein A or G purified from hybridoma culture supernatant
Reconstitution
Reconstitute at 0.5 mg/mL in sterile PBS. For liquid material, refer to CoA for concentration.
Loading...
Formulation
Lyophilized from a 0.2 μm filtered solution in PBS with Trehalose. *Small pack size (SP) is supplied either lyophilized or as a 0.2 µm filtered solution in PBS.
Shipping
Lyophilized product is shipped at ambient temperature. Liquid small pack size (-SP) is shipped with polar packs. Upon receipt, store immediately at the temperature recommended below.
Stability & Storage
Use a manual defrost freezer and avoid repeated freeze-thaw cycles.
- 12 months from date of receipt, -20 to -70 °C as supplied.
- 1 month, 2 to 8 °C under sterile conditions after reconstitution.
- 6 months, -20 to -70 °C under sterile conditions after reconstitution.
Calculators
Background: Importin beta/KPNB1
Long Name
Karyopherin beta 1
Alternate Names
IMB1, Impnb, Importin 1, IPOB, KPNB1, NTF97, PTAC97
Gene Symbol
KPNB1
UniProt
Additional Importin beta/KPNB1 Products
Product Documents for Importin beta/KPNB1 Antibody (845208)
Certificate of Analysis
To download a Certificate of Analysis, please enter a lot or batch number in the search box below.
Note: Certificate of Analysis not available for kit components.
Product Specific Notices for Importin beta/KPNB1 Antibody (845208)
For research use only
Citations for Importin beta/KPNB1 Antibody (845208)
 Powered by Bioz
Customer Reviews for Importin beta/KPNB1 Antibody (845208) (3)
4.7 out of 5
3 Customer Ratings
Have you used Importin beta/KPNB1 Antibody (845208)?
Submit a review and receive an Amazon gift card!
$25/€18/£15/$25CAN/¥2500 Yen for a review with an image
$10/€7/£6/$10CAN/¥1110 Yen for a review without an image
Submit a review
Customer Images
Showing
1
-
3 of
3 reviews
Showing All
Filter By:
-
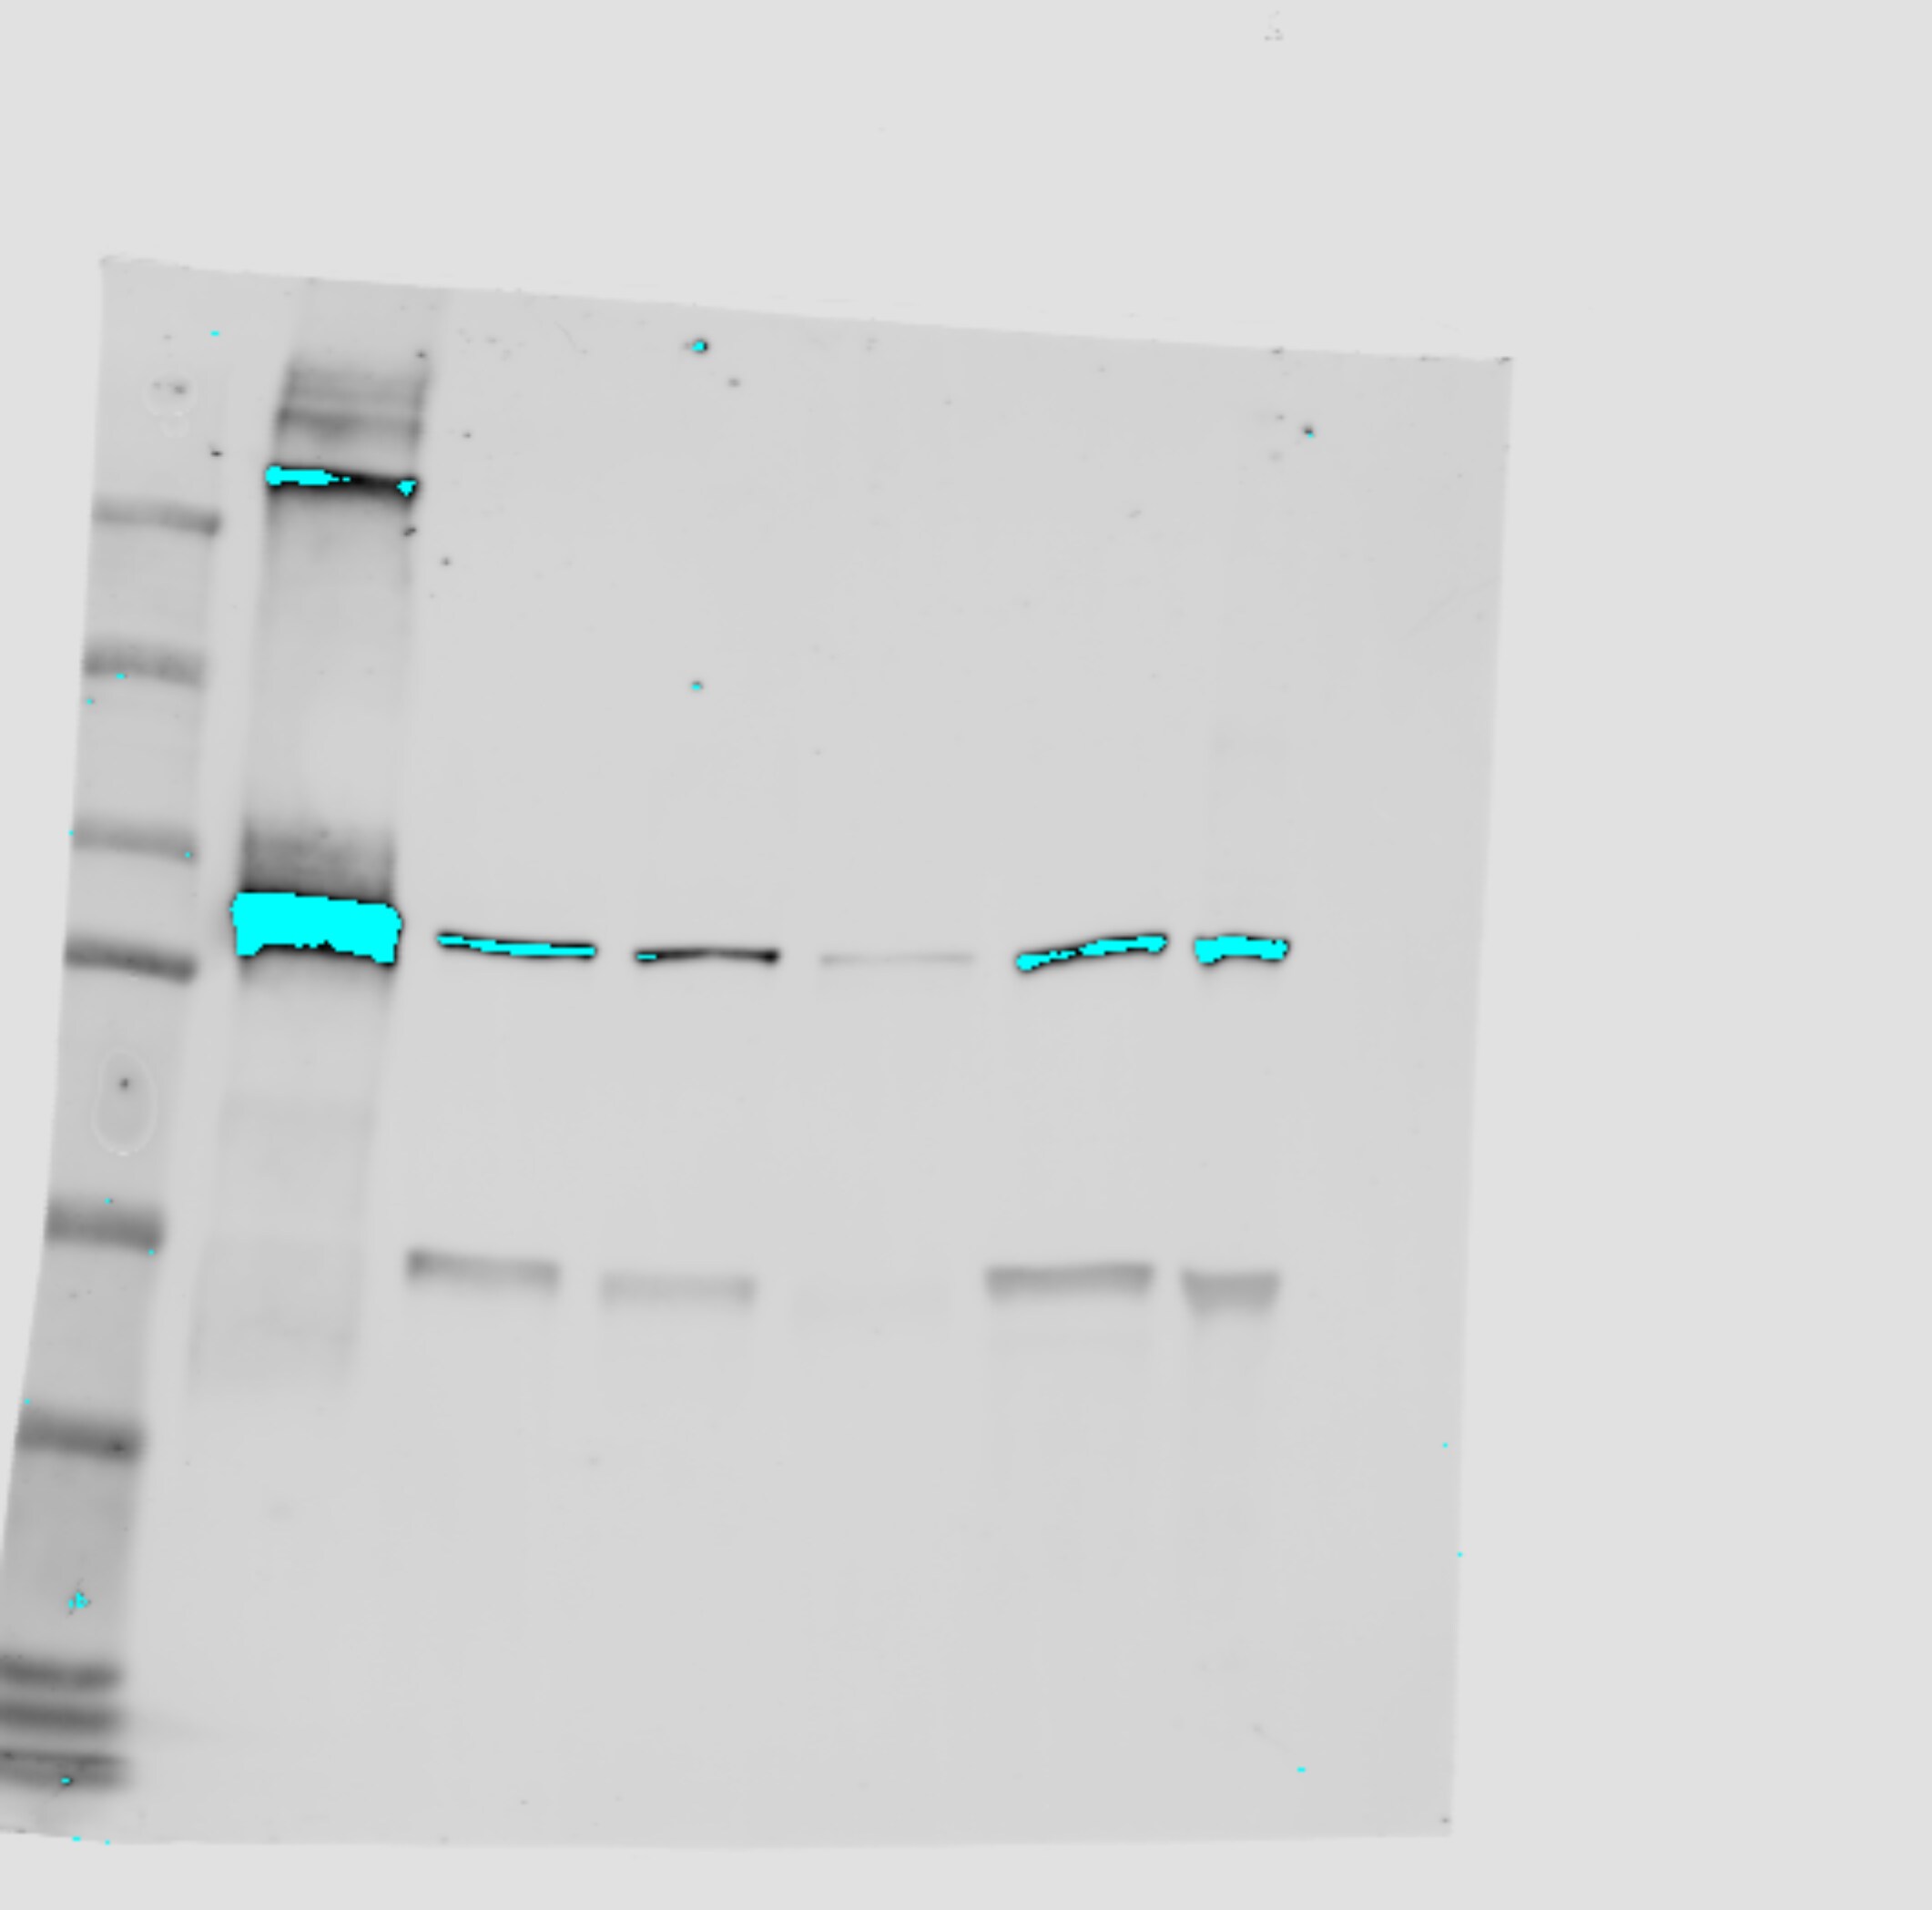
Application: Western BlotSample Tested: LNCaP human prostate cancer cell line and PC-3 human prostate cancer cell lineSpecies: HumanVerified Customer | Posted 12/01/2022Ladder: Precision plus protein standards. Blot is also probed for alpha tubulin at 50KDa. Lane 1:Human recombinant importin beta, showing between the 100KDa and 75 KDa bands. Lane 2 and 3 : Human importin beta detected in LNCaP-C42 prostate cancer line Lane 4: Human importin beta detected in LNCaP-95 cell line Lane 5: Human importin beta detected in PC3 cell line Lane 6: Human importin beta detected in 22rv1 cell line

-
Application: Western BlotSample Tested: U266 human myeloma cell lineSpecies: HumanVerified Customer | Posted 03/30/20221 ug/ml works excellent in the myeloma cell lysate.
-
Application: Immunocytochemistry/ImmunofluorescenceSample Tested: NIH-3T3 mouse embryonic fibroblast cell lineSpecies: MouseVerified Customer | Posted 02/06/2022
There are no reviews that match your criteria.
Protocols
Find general support by application which include: protocols, troubleshooting, illustrated assays, videos and webinars.
- Appropriate Fixation of IHC/ICC Samples
- Cellular Response to Hypoxia Protocols
- ClariTSA™ Fluorophore Kits
- Detection & Visualization of Antibody Binding
- ICC Cell Smear Protocol for Suspension Cells
- ICC Immunocytochemistry Protocol Videos
- ICC for Adherent Cells
- Immunocytochemistry (ICC) Protocol
- Immunocytochemistry Troubleshooting
- Immunofluorescence of Organoids Embedded in Cultrex Basement Membrane Extract
- Immunohistochemistry (IHC) and Immunocytochemistry (ICC) Protocols
- Preparing Samples for IHC/ICC Experiments
- Preventing Non-Specific Staining (Non-Specific Binding)
- Primary Antibody Selection & Optimization
- Protocol for VisUCyte™ HRP Polymer Detection Reagent
- Protocol for the Fluorescent ICC Staining of Cell Smears - Graphic
- Protocol for the Fluorescent ICC Staining of Cultured Cells on Coverslips - Graphic
- Protocol for the Preparation and Fluorescent ICC Staining of Cells on Coverslips
- Protocol for the Preparation and Fluorescent ICC Staining of Non-adherent Cells
- Protocol for the Preparation and Fluorescent ICC Staining of Stem Cells on Coverslips
- Protocol for the Preparation of a Cell Smear for Non-adherent Cell ICC - Graphic
- R&D Systems Quality Control Western Blot Protocol
- TUNEL and Active Caspase-3 Detection by IHC/ICC Protocol
- The Importance of IHC/ICC Controls
- Troubleshooting Guide: Western Blot Figures
- Western Blot Conditions
- Western Blot Protocol
- Western Blot Protocol for Cell Lysates
- Western Blot Troubleshooting
- Western Blot Troubleshooting Guide
- View all Protocols, Troubleshooting, Illustrated assays and Webinars
Loading...