Best Seller
Human SOX10 Antibody
R&D Systems | Catalog # AF2864

Key Product Details
Species Reactivity
Validated:
Human
Cited:
Human, Mouse, Rat, Avian - Chicken, Chicken, Gerbil, Primate - Macaca mulatta (Rhesus Macaque), Transgenic Mouse, Xenograft
Applications
Validated:
Immunohistochemistry, Western Blot, Immunocytochemistry
Cited:
Immunohistochemistry, Immunohistochemistry-Paraffin, Immunohistochemistry-Frozen, Western Blot, Flow Cytometry, Immunocytochemistry, Immunocytochemistry/ Immunofluorescence, Immunoprecipitation, FACS, IHC-F, In Situ, In Situ Hybridization, Proximity Ligation Assay (PLA)
Label
Unconjugated
Antibody Source
Polyclonal Goat IgG
Loading...
Product Specifications
Immunogen
E. coli-derived recombinant human SOX10
Met1-Ala118
Accession # P56693
Met1-Ala118
Accession # P56693
Specificity
Detects human SOX10 in direct ELISAs and Western blots.
Clonality
Polyclonal
Host
Goat
Isotype
IgG
Scientific Data Images for Human SOX10 Antibody
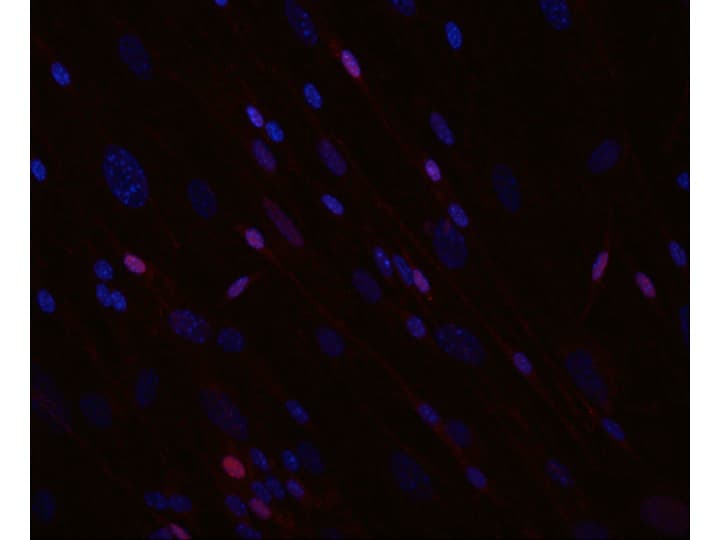
SOX10 in SK‑Mel‑28 Human Cell Line.
SOX10 was detected in immersion fixed SK‑Mel‑28 human malignant melanoma cell line using Goat Anti-Human SOX10 Antigen Affinity-purified Polyclonal Antibody (Catalog # AF2864) at 15 µg/mL for 3 hours at room temperature. Cells were stained using the NorthernLights™ 557-conjugated Anti-Goat IgG Secondary Antibody (red; NL001) and counterstained with DAPI (blue). Specific staining was localized to cell nuclei. Staining was performed using our protocol for Fluorescent ICC Staining of Non-adherent Cells.
SOX10 in BG01V Human Embryonic Stem Cells.
SOX10 was detected in immersion fixed BG01V human embryonic stem cells differentiated to neural crest stem cells using Goat Anti-Human SOX10 Antigen Affinity-purified Polyclonal Antibody (Catalog # AF2864) at 10 µg/mL for 3 hours at room temperature. Cells were stained using the NorthernLights™ 557-conjugated Anti-Goat IgG Secondary Antibody (red; Catalog # NL001) and counterstained with DAPI (blue). Specific staining was localized to nuclei. View our protocol for Fluorescent ICC Staining of Cells on Coverslips.
SOX10 in Human Melanoma Tissue.
SOX10 was detected in immersion fixed paraffin-embedded sections of human melanoma tissue using Goat Anti-Human SOX10 Antigen Affinity-purified Polyclonal Antibody (Catalog # AF2864) at 15 µg/mL for 1 hour at room temperature followed by incubation with the Anti-Goat IgG VisUCyte™ HRP Polymer Antibody (VC004). Before incubation with the primary antibody, tissue was subjected to heat-induced epitope retrieval using Antigen Retrieval Reagent-Basic (CTS013). Tissue was stained using DAB (brown) and counterstained with hematoxylin (blue). Specific staining was localized to cell nuclei. Staining was performed using our protocol for IHC Staining with VisUCyte HRP Polymer Detection Reagents.
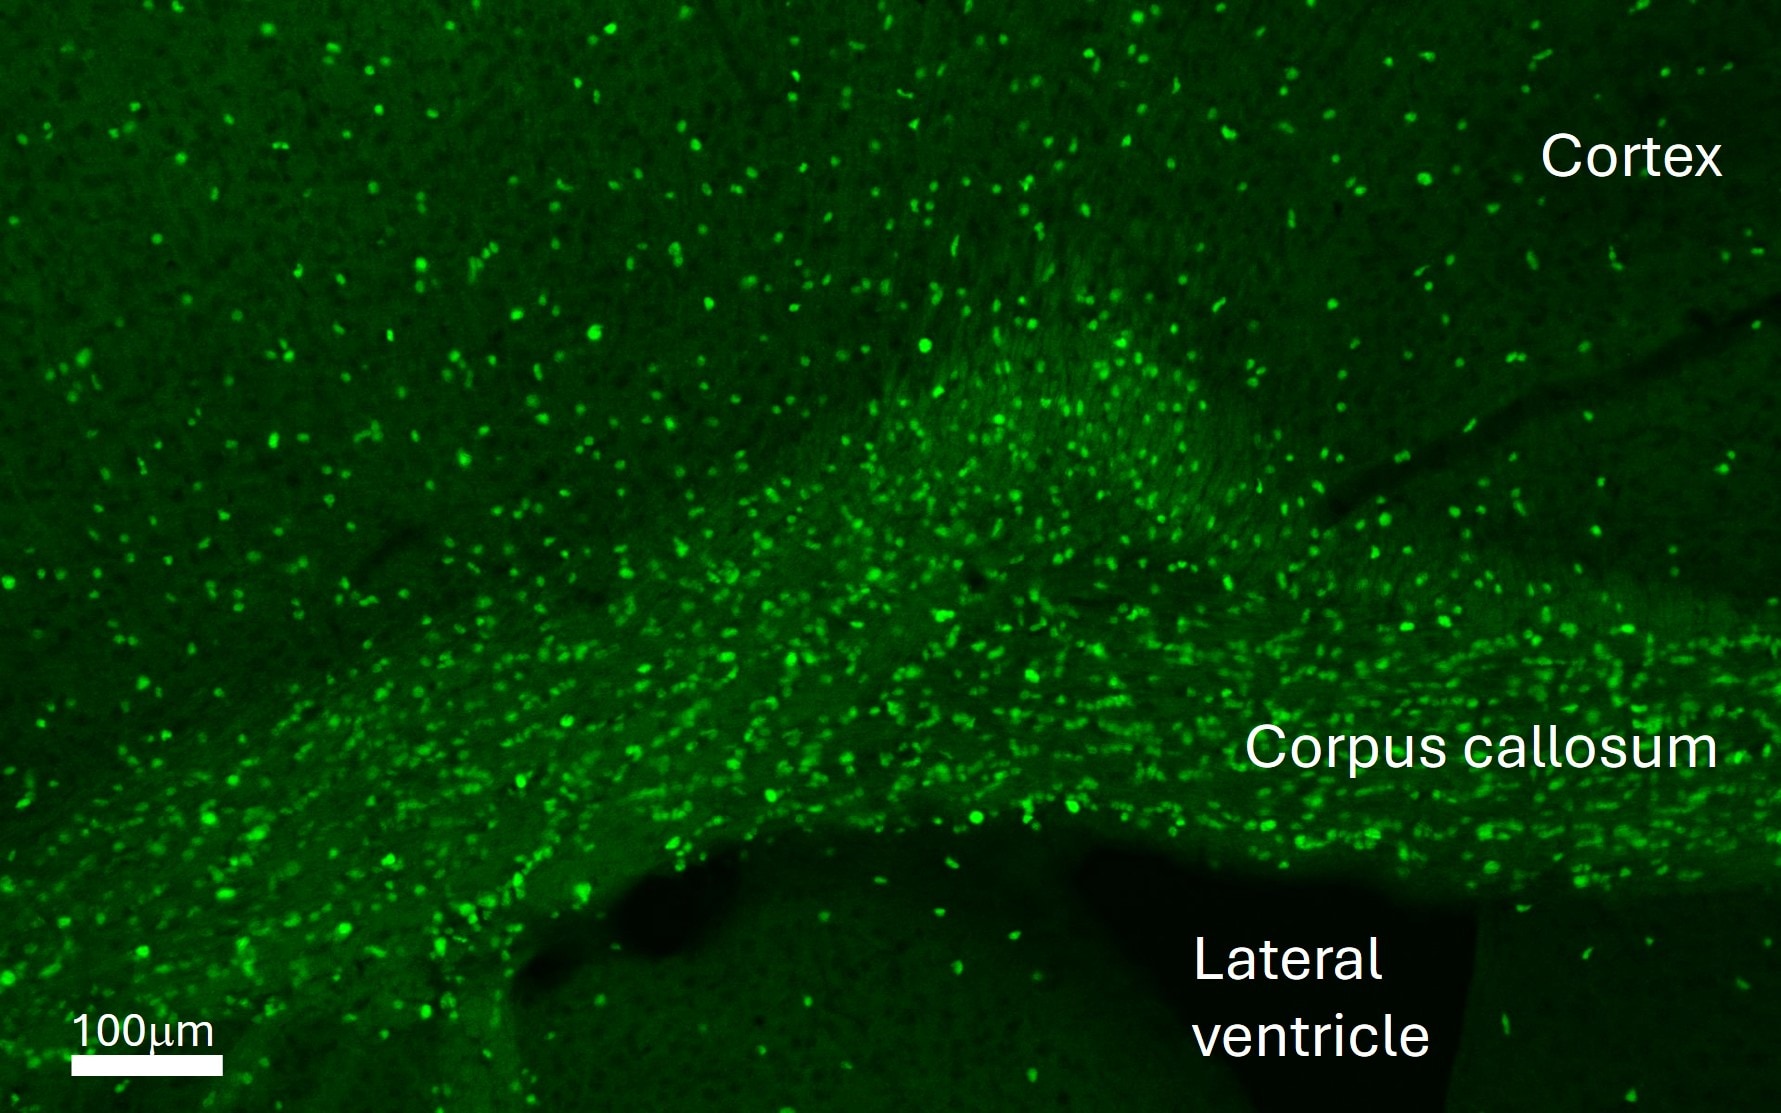
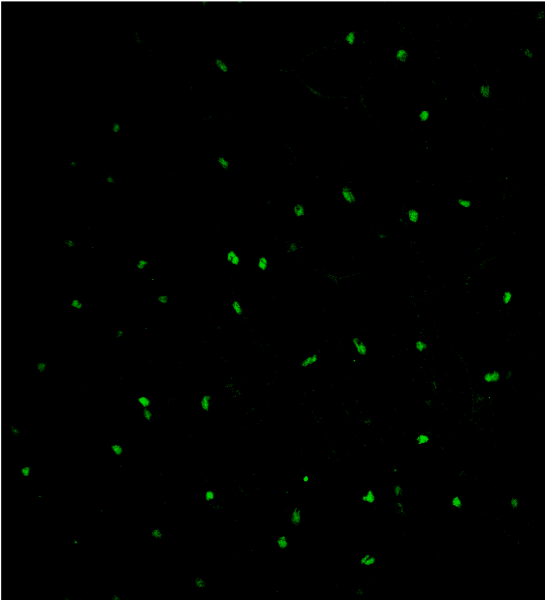
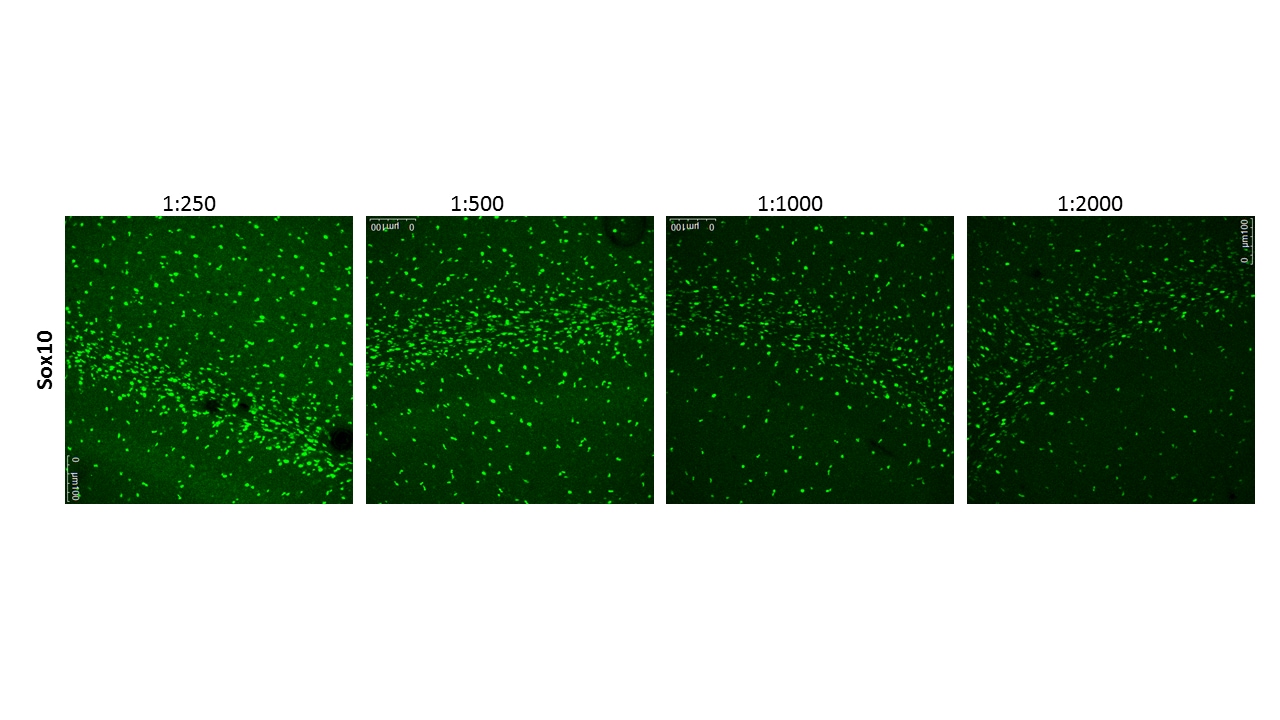
SOX10 in Adult Mouse Cortex Tissue.
Adult mouse (P6W) brain perfused with 4% paraformaldehyde/PBS, 30 um free floating section. Block with 1% BSA/0.3% Triton X-100/PBS for 30min, primary antibody (1:1000, 0.2ug/ml), secondary antibody (anti-goat Alexa Fluor 488). Antigen retrieval treatment was not needed. Image from a verified customer review.
Detection of Mouse SOX10 by Immunohistochemistry
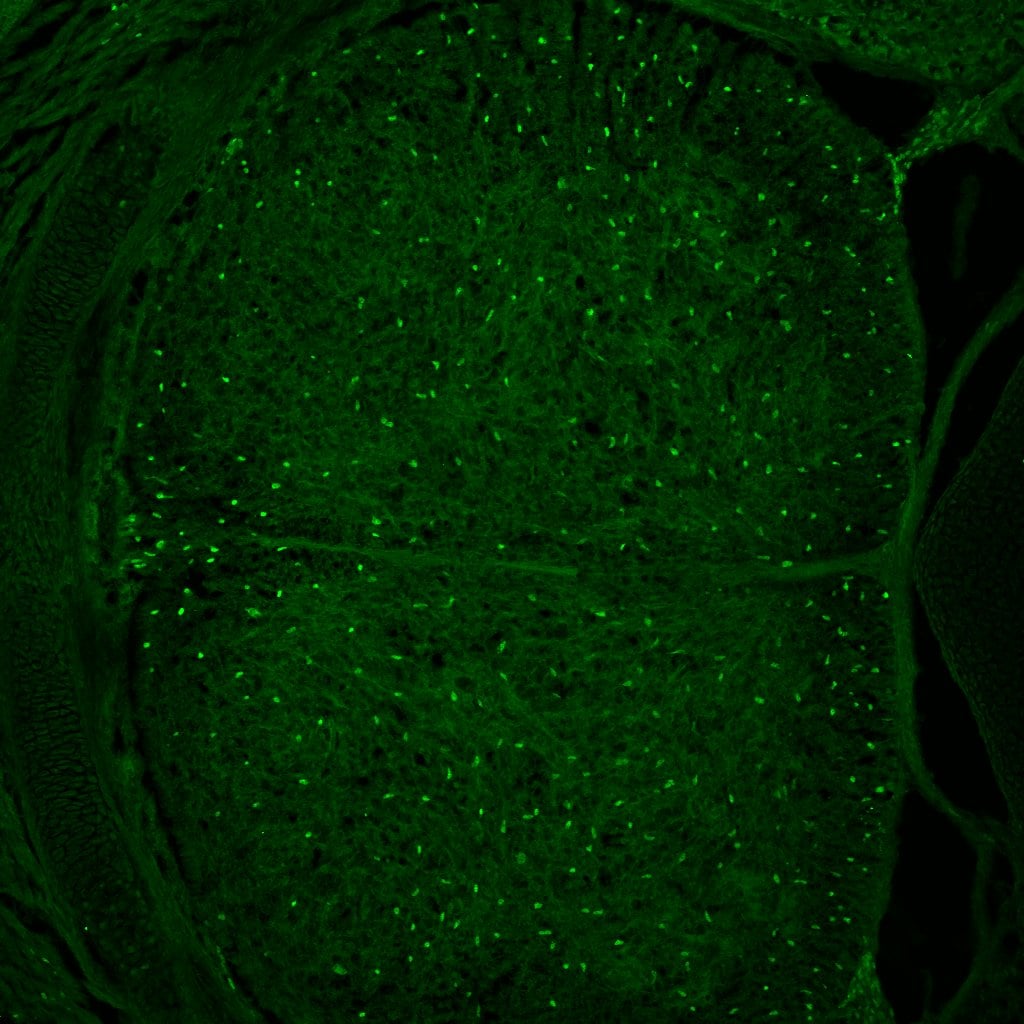
PDGFR alpha driven brain tumors display features of high grade glioma.(a–g) Histopathological analysis of tumor areas by H&E staining shows a high concentration of mitotic figures (a, arrows), high cellularity and nuclear atypia (b), perineuronal satellitosis (c; N, neuronal nuclei), perivascular growth (d), intrafascicular growth (e), subarachnoid spreading (f), and areas of incipient necrosis (g; arrows point to pyknotic nuclei). (h–k) IF labeling of brain tumor sections for cell type specific markers. Nuclei labeled with DAPI are shown in blue. Tumor cells with high PDGFR alpha expression were highly proliferative, as seen by proliferation marker Ki67 (h), and express the OPC cell lineage markers Olig2, Sox2, Sox10, and Ng2, as well as the neural stem cell marker Nestin (i–k). Tumor cells were negative for immunosignal of astroglial marker GFAP, mature oligodendrocyte marker APC-CC1, and neuronal marker NeuN (l–n). Scale bars: 10 μm (a–g), 20 μm (h–n). Image collected and cropped by CiteAb from the following publication (https://pubmed.ncbi.nlm.nih.gov/25683249), licensed under a CC-BY license. Not internally tested by R&D Systems.
Detection of Mouse SOX10 by Immunocytochemistry/Immunofluorescence
Adult dynamin 2-depleted Schwann cells are replaced by dynamin 2-positive Schwann cells in remyelinated nerves.(A) Immunostainings for DNM2, SOX10 (SCs) and YFP (reporter-recombined SCs) on SN cross-sections of control* (MpzCreERT2:Rosa26-stoploxP/loxP-YFP) and P0ERT2-Dnm2KO* (MpzCreERT2:Dnm2loxP/loxP: Rosa26-stoploxP/loxP-YFP) mice at 4 wpT and 14 wpT. White arrows: YFP-recombined SCs that express DNM2 (in controls at 4 wpt and 14 wpt); black arrowheads: YFP-recombined SCs lacking DNM2 (in mutants at 4 wpt); white arrowheads: Non-recombined SCs expressing DNM2 (in controls and mutants at 4 wpt and 14 wpt). Scale bar = 25 μm for entire panel. (B) Quantification related to (A). Percentage of YFP+ cells among SOX10+ SCs/SN cross-sections at 4 wpT, 6 wpT, and 14 wpT. N = 3 mice/genotype, Two-Way ANOVA with Sidak’s multiple comparisons test. (C) Western blot analysis of cleaved caspase 3 (cC3) in SN lysates of control* and P0ERT2-Dnm2KO* mice at 4 wpT, 6 wpT and 14 wpT. Full-length blots in Supplementary file 1F. (D) Quantification referring to (C). Control average was set to 1. N = 3 mice/time point and genotype, Two-Way ANOVA with Sidak’s multiple comparisons test. Results in graphs represent means ±s.e.m.; ***p<0.001. Image collected and cropped by CiteAb from the following publication (https://pubmed.ncbi.nlm.nih.gov/30648534), licensed under a CC-BY license. Not internally tested by R&D Systems.
Detection of Mouse SOX10 by Immunocytochemistry/Immunofluorescence
Schwann cells lacking dynamin 2 show impaired cell cycle progression, reduced mitosis rate, and cytokinesis defects.(A) Schematic representation of the cell cycle phases marked by Ki-67 and EdU. (B) EdU-labeling, combined with immunostainings for Ki-67 and SOX10 on control and P0-Dnm2KO SN cross-sections at P5. Arrows: EdU+ Ki-67+ SOX10+ SCs, arrowheads: Ki-67+ SOX10+ SCs. Scale bar = 25 μm for entire panel. (C) Quantification of (B). Percentage of EdU+ SCs/SN cross-sections. N = 5 mice/time point and genotype, Two-Way ANOVA with Sidak’s multiple comparisons test. (D) Quantification of (B). Percentage of Ki-67+ SCs/SN cross-sections at P5. N = 5 mice/genotype, two-tailed unpaired Student´s t-test. (E) Quantification of (B). Percentage of EdU+ among Ki-67+ SCs/SN cross-section at P5. N = 5 mice/genotype, two-tailed unpaired Student´s t-test. (F) Quantification of mitotic events in cultured mouse SCs isolated from MpzCre:Rosa26-stoploxP/loxP-YFP (control*) and MpzCre:Dnm2loxP/loxP:Rosa26-stoploxP/loxP-YFP (P0-Dnm2KO*) SNs at P1, monitored by time-lapse microscopy for 24 hr. Each data point represents one individual animal (at least 42 cells/animal analyzed). N = 5 controls and seven mutant mice, two-tailed unpaired Student´s t-test. (G) Quantification of mitosis duration (minutes) of SCs of control* and P0-Dnm2KO* mice, monitored by time-lapse microscopy for 24 hr. Each data point represents one cell derived from a total of 5 control and seven mutant mice. Cells derived from each animal were isolated and analyzed separately, but pooled in one graph; two-tailed unpaired Student´s t-test. (H) Exemplary picture of a multinucleated Dnm2KO SCs after 48 hr in culture. Scale bar = 25 μm. (I) Quantification of multinucleated cells in control and Dnm2KO SCs after 24 hr, 48 hr and 76 hr in culture. N = 6 mice/genotype for 48 hr; N = 6 control* and n = 5 P0-Dnm2KO* mice for 24 hr and 72 hr, two-Way ANOVA with Sidak’s multiple comparisons test. (J) Exemplary time-lapse images of
Detection of Mouse SOX10 by Immunohistochemistry
PDGFR alpha driven brain tumors display features of high grade glioma.(a–g) Histopathological analysis of tumor areas by H&E staining shows a high concentration of mitotic figures (a, arrows), high cellularity and nuclear atypia (b), perineuronal satellitosis (c; N, neuronal nuclei), perivascular growth (d), intrafascicular growth (e), subarachnoid spreading (f), and areas of incipient necrosis (g; arrows point to pyknotic nuclei). (h–k) IF labeling of brain tumor sections for cell type specific markers. Nuclei labeled with DAPI are shown in blue. Tumor cells with high PDGFR alpha expression were highly proliferative, as seen by proliferation marker Ki67 (h), and express the OPC cell lineage markers Olig2, Sox2, Sox10, and Ng2, as well as the neural stem cell marker Nestin (i–k). Tumor cells were negative for immunosignal of astroglial marker GFAP, mature oligodendrocyte marker APC-CC1, and neuronal marker NeuN (l–n). Scale bars: 10 μm (a–g), 20 μm (h–n). Image collected and cropped by CiteAb from the following publication (https://pubmed.ncbi.nlm.nih.gov/25683249), licensed under a CC-BY license. Not internally tested by R&D Systems.
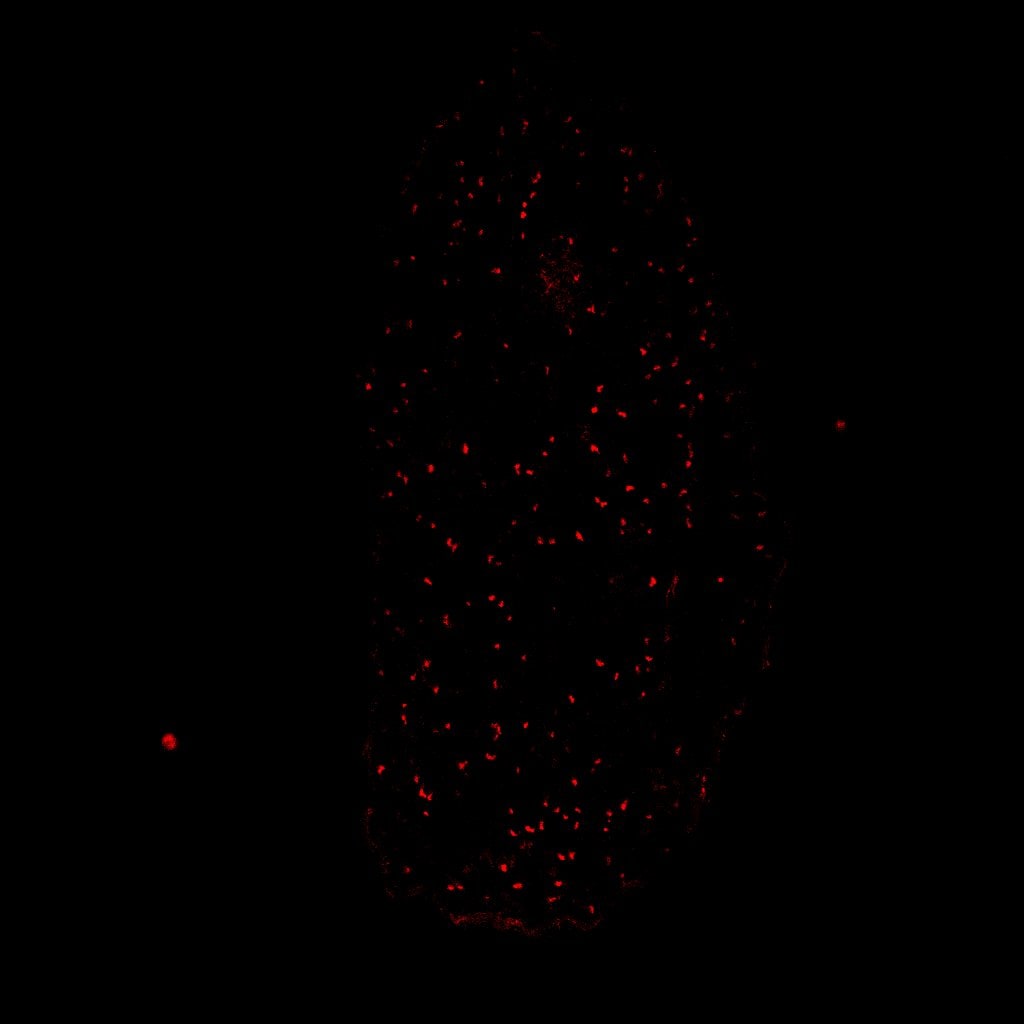
Detection of Mouse SOX10 by Immunohistochemistry
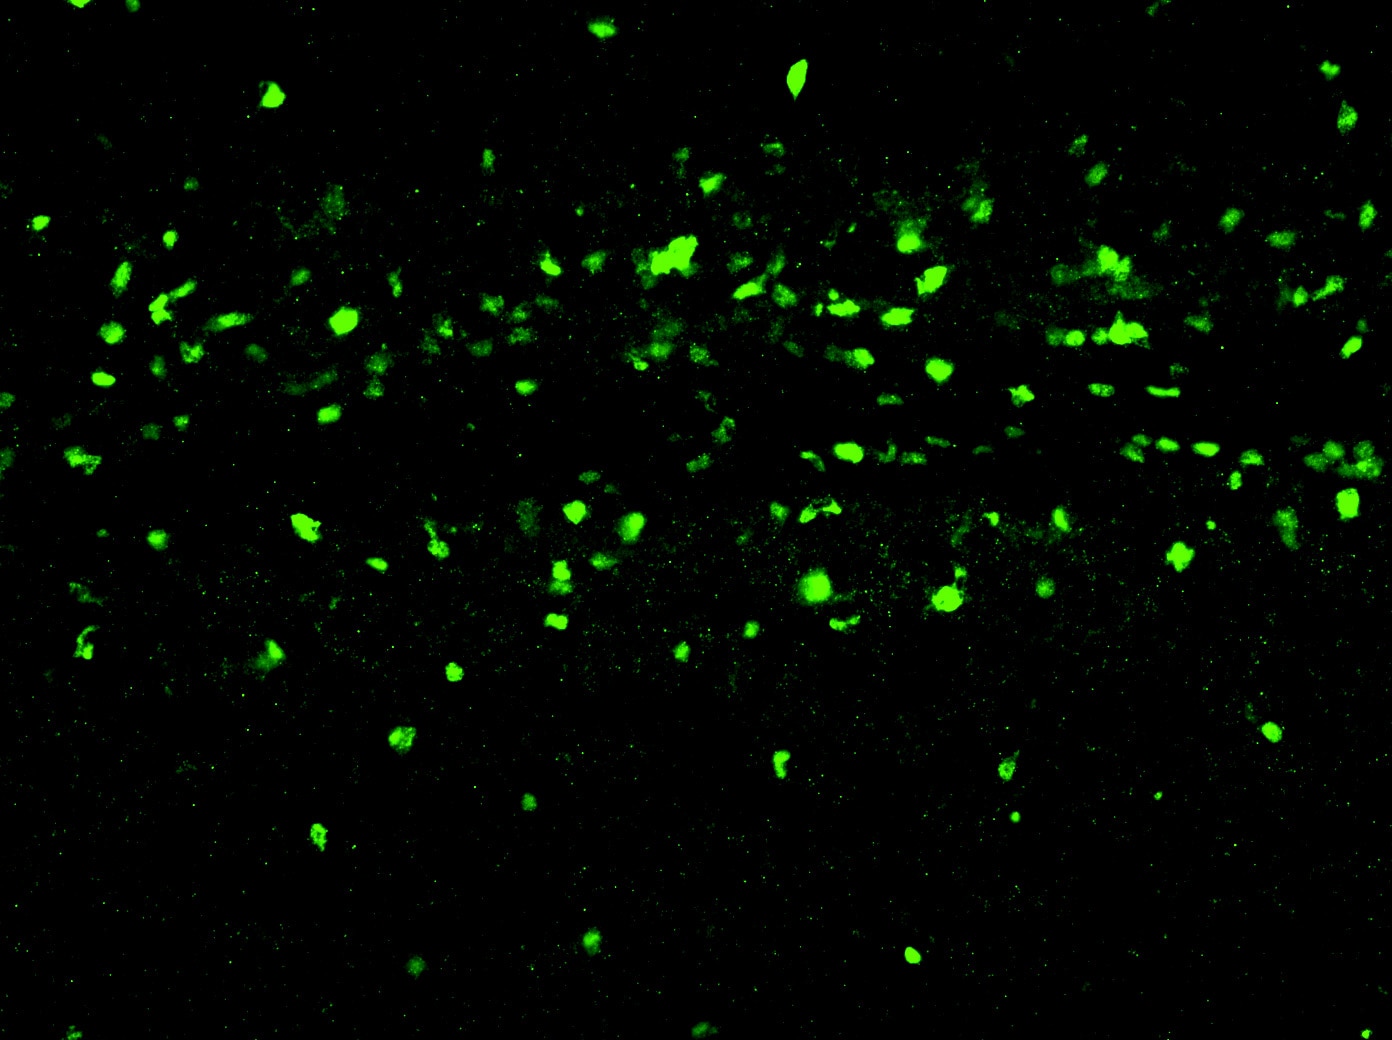
Filamentous actin is increased in Nedd4 knockdown&Nedd4−/− NCCs. e Representative images of migrating trunk NCCs within somites (S) 8–10 in control&Wnt1-Cre; Nedd4fl/fl E9.5 embryos. Whole embryos with 20–23 somites stained with anti-SOX10 (green)&anti-CD31 antibodies (red) to recognise NCCs&blood vessels. Dashed line marks the ventral limit of the dorsal aorta (DA) which was used to normalise migration distance of pioneering NCCs (arrowhead). Scale bar = 100 μm. Image collected & cropped by CiteAb from the following open publication (https://pubmed.ncbi.nlm.nih.gov/35440627), licensed under a CC-BY license. Not internally tested by R&D Systems.
Detection of Mouse SOX10 by Immunocytochemistry/ Immunofluorescence
Mice lacking dynamin 2 in Schwann cells display characteristics of inflammation and Schwann cell death. (E) (Left) Immunostainings of controls and P0-Dnm2KO SN cross-sections for cleaved-caspase 3 (cC3) in combination with the SC marker SOX10 at P5. (Right) Percentage of cC3+ SOX10+ SCs at P5 and P14. N = 5 mice/time point and genotype, two-tailed unpaired Student’s t-test. Scale bar = 25 μm for entire panel. Image collected and cropped by CiteAb from the following open publication (https://pubmed.ncbi.nlm.nih.gov/30648534), licensed under a CC-BY license. Not internally tested by R&D Systems.Applications for Human SOX10 Antibody
Application
Recommended Usage
Immunocytochemistry
5-15 µg/mL
Sample: Immersion fixed SK‑Mel‑28 human malignant melanoma cell line and immersion fixed BG01V human embryonic stem cells differentiated to neural crest stem cells
Sample: Immersion fixed SK‑Mel‑28 human malignant melanoma cell line and immersion fixed BG01V human embryonic stem cells differentiated to neural crest stem cells
Immunohistochemistry
5-15 µg/mL
Sample: Immersion fixed paraffin-embedded sections of human melanoma tissue
Sample: Immersion fixed paraffin-embedded sections of human melanoma tissue
Western Blot
0.1 µg/mL
Sample: Recombinant Human SOX10
Sample: Recombinant Human SOX10
Reviewed Applications
Read 10 reviews rated 4.5 using AF2864 in the following applications:
Formulation, Preparation, and Storage
Purification
Antigen Affinity-purified
Reconstitution
Reconstitute at 0.2 mg/mL in sterile PBS. For liquid material, refer to CoA for concentration.
Loading...
Formulation
Lyophilized from a 0.2 μm filtered solution in PBS with Trehalose. *Small pack size (SP) is supplied either lyophilized or as a 0.2 µm filtered solution in PBS.
Shipping
Lyophilized product is shipped at ambient temperature. Liquid small pack size (-SP) is shipped with polar packs. Upon receipt, store immediately at the temperature recommended below.
Stability & Storage
Use a manual defrost freezer and avoid repeated freeze-thaw cycles.
- 12 months from date of receipt, -20 to -70 °C as supplied.
- 1 month, 2 to 8 °C under sterile conditions after reconstitution.
- 6 months, -20 to -70 °C under sterile conditions after reconstitution.
Calculators
Background: SOX10
Long Name
SRY-box transcription factor 10
Alternate Names
DOM, PCWH, SOX-10, WS2E, WS4, WS4C
Gene Symbol
SOX10
UniProt
Additional SOX10 Products
Product Documents for Human SOX10 Antibody
Certificate of Analysis
To download a Certificate of Analysis, please enter a lot or batch number in the search box below.
Note: Certificate of Analysis not available for kit components.
Product Specific Notices for Human SOX10 Antibody
For research use only
Related Research Areas
Citations for Human SOX10 Antibody
 Powered by Bioz
Customer Reviews for Human SOX10 Antibody (10)
4.5 out of 5
10 Customer Ratings
Have you used Human SOX10 Antibody?
Submit a review and receive an Amazon gift card!
$25/€18/£15/$25CAN/¥2500 Yen for a review with an image
$10/€7/£6/$10CAN/¥1110 Yen for a review without an image
Submit a review
Customer Images
Showing
1
-
5 of
10 reviews
Showing All
Filter By:
-
Application: Immunohistochemistry-FrozenSample Tested: Brain (cortex) tissueSpecies: MouseVerified Customer | Posted 04/17/2026Adult mouse cortex, coronal section.Adult mouse (P6W) brain perfused with 4% paraformaldehyde/PBS, 30 um free floating section. Block with 1% BSA/0.3% Triton X-100/PBS for 30min, primary antibody (1:1000, 0.2ug/ml), secondary antibody (anti-goat Alexa Fluor 488). Antigen retrieval treatment was not needed.

-
Application: Immunocytochemistry/ImmunofluorescenceSample Tested: iPS2 human induced pluripotent stem cellsSpecies: human iPS cellsVerified Customer | Posted 02/06/2020Generated cells of oligodendrocytes lineage from iPS cells
-
Application: Immunocytochemistry/ImmunofluorescenceSample Tested: Adult brainSpecies: MouseVerified Customer | Posted 10/29/2019
-
Application: Immunohistochemistry-FrozenSample Tested: Embryonic spinal cordSpecies: MouseVerified Customer | Posted 05/09/2019
-
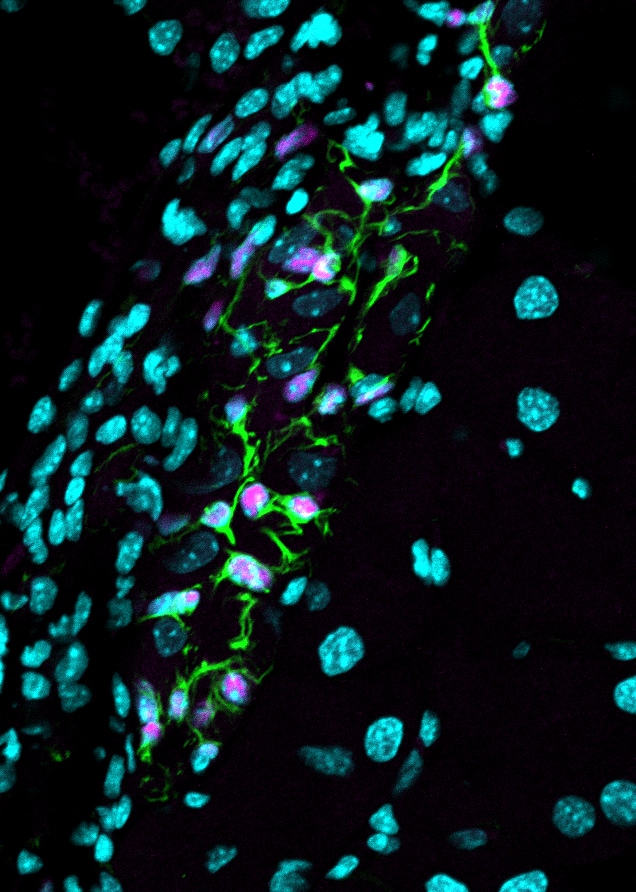
Application: Immunohistochemistry-ParaffinSample Tested: Mouse PancreasSpecies: MouseVerified Customer | Posted 02/26/2019Glial cells in the pancreas. Pink = Sox10; Green = GFAP; blue = DAPIAntigen retrieval: HIER, pH 6 Block: 1 hour in 2% normal donkey serum, 2 mg/ml BSA; 0.2% triton-x Primary: 10 ug/ml in blocking buffer, overnight at 4C Secondary: Donkey anti-goat DyLight 650, 1:300 for 1 hour
-
Application: Immunocytochemistry/ImmunofluorescenceSample Tested: Neural progenitor cellsSpecies: HumanVerified Customer | Posted 08/20/2018
-
Application: Immunocytochemistry/ImmunofluorescenceSample Tested: Neural progenitor cellsSpecies: HumanVerified Customer | Posted 08/20/2018
-
Application: ImmunohistochemistrySample Tested: Adult brainSpecies: MouseVerified Customer | Posted 06/20/2018This antibody worked beautifully at 1:1000 in adult (P25) mouse brain perfused with 4% paraformaldehyde, 30um free floating sections. 1. Antigen Retrieval: 100mM Sodium Citrate pH6.0, 0.05% 2. Rinse sections PBS once 3. Block in 5% NDS in PBSTx 1% RT for 1 hour 4. Primary Antibody (1:1000) in 1% NDS in PBSTx 0.3% (Incubate RT overnight on shaker) 5. Wash 3x 10 min PBS 6. Secondary Antibody 1:600 in 1% NDS in PBSTx 0.3% (Incubate RT 2h on shaker) 7. Wash 3x 10 min PBS 8. Mount on slides in water and let dry 9. Coverslip using Prolong Gold
-
Application: ImmunohistochemistrySample Tested: Sciatic nerveSpecies: MouseVerified Customer | Posted 11/02/2017Cryosection of mouse sciatic nerve 10µm thick. Tissue fixed with 4% PFA after dissection, inclusion in OCT. Storage at -80°C. Thawed sections at RT are treated with TritonX100 0.1% Tween 20 0.1% in PBS 1X for half an hour before blocking and primary antibody.
-
Application: Immunocytochemistry/ImmunofluorescenceSample Tested: sciatic nerve cultureSpecies: MouseVerified Customer | Posted 07/22/2017Cell culture from mouse sciatic nerves, Sox10+ cells are Schwann cells. Standard immunostaining, 5ug/ml of goat anti sox10 antibody. Dapi counterstaining.
There are no reviews that match your criteria.
Protocols
Find general support by application which include: protocols, troubleshooting, illustrated assays, videos and webinars.
- Antigen Retrieval Protocol (PIER)
- Antigen Retrieval for Frozen Sections Protocol
- Appropriate Fixation of IHC/ICC Samples
- Cellular Response to Hypoxia Protocols
- Chromogenic IHC Staining of Formalin-Fixed Paraffin-Embedded (FFPE) Tissue Protocol
- Chromogenic Immunohistochemistry Staining of Frozen Tissue
- ClariTSA™ Fluorophore Kits
- Detection & Visualization of Antibody Binding
- Fluorescent IHC Staining of Frozen Tissue Protocol
- Graphic Protocol for Heat-induced Epitope Retrieval
- Graphic Protocol for the Preparation and Fluorescent IHC Staining of Frozen Tissue Sections
- Graphic Protocol for the Preparation and Fluorescent IHC Staining of Paraffin-embedded Tissue Sections
- Graphic Protocol for the Preparation of Gelatin-coated Slides for Histological Tissue Sections
- ICC Cell Smear Protocol for Suspension Cells
- ICC Immunocytochemistry Protocol Videos
- ICC for Adherent Cells
- IHC Sample Preparation (Frozen sections vs Paraffin)
- Immunocytochemistry (ICC) Protocol
- Immunocytochemistry Troubleshooting
- Immunofluorescence of Organoids Embedded in Cultrex Basement Membrane Extract
- Immunofluorescent IHC Staining of Formalin-Fixed Paraffin-Embedded (FFPE) Tissue Protocol
- Immunohistochemistry (IHC) and Immunocytochemistry (ICC) Protocols
- Immunohistochemistry Frozen Troubleshooting
- Immunohistochemistry Paraffin Troubleshooting
- Preparing Samples for IHC/ICC Experiments
- Preventing Non-Specific Staining (Non-Specific Binding)
- Primary Antibody Selection & Optimization
- Protocol for Heat-Induced Epitope Retrieval (HIER)
- Protocol for Making a 4% Formaldehyde Solution in PBS
- Protocol for VisUCyte™ HRP Polymer Detection Reagent
- Protocol for the Fluorescent ICC Staining of Cell Smears - Graphic
- Protocol for the Fluorescent ICC Staining of Cultured Cells on Coverslips - Graphic
- Protocol for the Preparation & Fixation of Cells on Coverslips
- Protocol for the Preparation and Chromogenic IHC Staining of Frozen Tissue Sections
- Protocol for the Preparation and Chromogenic IHC Staining of Frozen Tissue Sections - Graphic
- Protocol for the Preparation and Chromogenic IHC Staining of Paraffin-embedded Tissue Sections
- Protocol for the Preparation and Chromogenic IHC Staining of Paraffin-embedded Tissue Sections - Graphic
- Protocol for the Preparation and Fluorescent ICC Staining of Cells on Coverslips
- Protocol for the Preparation and Fluorescent ICC Staining of Non-adherent Cells
- Protocol for the Preparation and Fluorescent ICC Staining of Stem Cells on Coverslips
- Protocol for the Preparation and Fluorescent IHC Staining of Frozen Tissue Sections
- Protocol for the Preparation and Fluorescent IHC Staining of Paraffin-embedded Tissue Sections
- Protocol for the Preparation of Gelatin-coated Slides for Histological Tissue Sections
- Protocol for the Preparation of a Cell Smear for Non-adherent Cell ICC - Graphic
- R&D Systems Quality Control Western Blot Protocol
- TUNEL and Active Caspase-3 Detection by IHC/ICC Protocol
- The Importance of IHC/ICC Controls
- Troubleshooting Guide: Immunohistochemistry
- Troubleshooting Guide: Western Blot Figures
- Western Blot Conditions
- Western Blot Protocol
- Western Blot Protocol for Cell Lysates
- Western Blot Troubleshooting
- Western Blot Troubleshooting Guide
- View all Protocols, Troubleshooting, Illustrated assays and Webinars
Loading...
Associated Pathways
