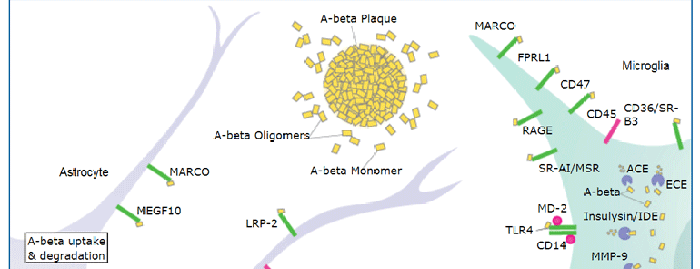
CD36 (alternatively known as platelet membrane glycoprotein IV (GPIV), thrombospondin receptor, fatty acid translocase (FAT), and scavenger receptor class B, member 3 (SR-B3)) is an 88 kDa, integral membrane glycoprotein that belongs to the class B scavenger receptor family (1, 2). The molecule is described as being ditopic, with two transmembrane segments connected by an extracellular loop (3). Mouse CD36 is synthesized as a 472 amino acid (aa) protein that contains a 6 aa N‑terminal cytoplasmic domain, a 22 aa N‑terminal transmembrane segment, a 420 aa extracellular “loop”, a 22 aa C‑terminal transmembrane segment, and a 9 aa C‑terminal cytoplasmic tail (4). Both cytoplasmic tails are palmitoylated, with the C‑terminal tail involved in oxidized LDL binding (5, 6). With respect to the extracellular loop, the N‑terminal region is believed to bind both thrombospondin-1 and Plasmodium-infected erythrocytes. Other ligands for CD36 include long-chain fatty acids, collagen, phospholipids and apoptotic cells (1). The extracellular loop of mouse CD36 is 94%, 92%, 84%, and 84% aa identical to the extracellular loops of rat, hamster, human, and bovine CD36, respectively. Cells known to express CD36 include capillary endothelium, adipocytes, skeletal muscle cells, intestinal epithelium, smooth muscle cells, and hematopoietic cells such as red blood cells, platelets, and monocytes (1). On the surface of cells, CD36 is suggested to exist as a dimer in response to ligation (7). CD36 is reported to regulate fatty uptake, act as an angiogenic with TSP-1, and participate in the clearance of apoptotic phagocytes (1, 8).

Key Product Details
Species Reactivity
Validated:
Mouse
Cited:
Human, Mouse, Rat, Transgenic Mouse
Applications
Validated:
Immunohistochemistry, Western Blot, ELISA Capture (Matched Antibody Pair), Flow Cytometry, CyTOF-ready
Cited:
Immunohistochemistry, Immunohistochemistry-Frozen, Western Blot, Neutralization, Flow Cytometry, Immunoprecipitation, Binding Assay
Label
Unconjugated
Antibody Source
Polyclonal Goat IgG
Loading...
Product Specifications
Immunogen
Chinese hamster ovary cell line CHO-derived recombinant mouse CD36/SR-B3
Gly30-Lys439
Accession # Q3UAI3
Gly30-Lys439
Accession # Q3UAI3
Specificity
Detects mouse CD36/SR-B3 in ELISAs and Western blots. In sandwich ELISAs, approximately 20% cross-reactivity with recombinant human CD36 is observed.
Clonality
Polyclonal
Host
Goat
Isotype
IgG
Scientific Data Images for Mouse CD36/SR-B3 Antibody
Detection of CD36/SR‑B3 in J774A.1 Mouse Cell Line by Flow Cytometry.
J774A.1 mouse reticulum cell sarcoma macrophage cell line was stained with Goat Anti-Mouse CD36/SR-B3 Antigen Affinity-purified Polyclonal Antibody (Catalog # AF2519, filled histogram) or isotype control antibody (Catalog # AB-108-C, open histogram), followed by Phycoerythrin-conjugated Anti-Goat IgG Secondary Antibody (Catalog # F0107).
CD36/SR‑B3 in Mouse Kidney.
CD36/SR-B3 was detected in immersion fixed paraffin-embedded sections of mouse kidney using Goat Anti-Mouse CD36/SR-B3 Antigen Affinity-purified Polyclonal Antibody (Catalog # AF2519) at 3 µg/mL for 1 hour at room temperature followed by incubation with the Anti-Goat IgG VisUCyte™ HRP Polymer Antibody (Catalog # VC004). Before incubation with the primary antibody, tissue was subjected to heat-induced epitope retrieval using Antigen Retrieval Reagent-Basic (Catalog # CTS013). Tissue was stained using DAB (brown) and counterstained with hematoxylin (blue). Specific staining was localized to cytoplasm and plasma membrane. View our protocol for IHC Staining with VisUCyte HRP Polymer Detection Reagents.
Detection of Mouse CD36/SR-B3 by Western Blot
Liver GADD45 beta controls liver fatty acid handling by cytosolic FABP1 retentionA, BMale 12‐weeks‐old wild‐type (WT; C57Bl/6J) or obese/diabetic (db/db; BKS.Cg‐m+/+ Lepr DB/J) mice with (Ad‐G45b OE) or without (Ad‐NC) prior liver‐restricted GADD45 beta over‐expression were fasted and insulin was injected with livers harvested shortly thereafter and subsequently liver proteins were subjected to immunoblotting for insulin signalling proteins including phosphoprotein kinase B (PKB/Akt; A) and glycogen synthase kinase beta (GSK3b; B). Inserts show representative blots (n = 6/group).C, DRepresentative immunoblots (C) and relative abundance quantifications (D; n = 6) of proteins and phosphoproteins including light chain 3 isoform B (LC3B), S6 kinase 1 (S6K1), p42/44 mitogen activated protein kinase (ERK1/2), eukaryotic initiation factor 2 alpha (eIF2a), glucose regulated protein 78 (GRP78/HSPA5), fatty acid transport protein 2 (FATP2/SLC27A2), cluster determinant 36 (CD36/FAT) and fatty acid binding protein 1 (FABP1) from fasted GADD45 beta +/+ (WT) or GADD45 beta −/− (KO) mice.ERepresentative immunoblots of HNF4a (nuclear marker), BCKDE1A (mitochondrial marker), NTCP (microsomal marker) and ARG1 (cytosolic marker) from liver whole tissue lysate (W) as well as fractionated organelles/intraceuular structures including nuclei (N), mitochondria (MT), microsomes (MS) and cytoplasm (C), from GADD45 beta +/+ (WT) and GADD45 beta −/− (KO) mice.Data information: Data are mean ± SEM. The statistical test used and respective P‐value outputs can be found in Appendix Table S1. Image collected and cropped by CiteAb from the following publication (https://pubmed.ncbi.nlm.nih.gov/27137487), licensed under a CC-BY license. Not internally tested by R&D Systems.
Detection of Mouse CD36/SR-B3 by Western Blot
Liver GADD45 beta controls liver fatty acid handling by cytosolic FABP1 retentionA, BMale GADD45 beta +/+ (WT; n = 16) or GADD45 beta −/− (KO; n = 15) mice fasted for 24 h (fasted) with (AV‐G45b OE) or without (AV‐NC) liver‐restricted GADD45 beta over‐expression (n = 7–8/group). Liver mRNA expression of Gadd45b (A) as well as fatty acid metabolic genes (B) encompassing transport (Slc28a2, Slc27a5, Cd36), intracellular binding (Fabp1, Dbi) and metabolism (Acly, Dgat1, Atgl, Hsl).CRepresentative immunoblots of FATP2, CD36, FABP1 and GADD45 beta from liver whole tissue lysate (W) as well as fractionated organelles/intracellular structures including nuclei (N), mitochondria (MT), microsomes (MS) and cytoplasm (C), from GADD45 beta +/+ (WT) and GADD45 beta −/− (KO) mice.DQuantified band densities of FABP1 enrichment from fractions in C (n = 4/group).ELiver fraction enrichment of FABP1 from male GADD45 beta +/+ (WT) or GADD45 beta −/− (KO) mice fasted for 24 h with (AD‐G45b OE) or without (AD‐NC) liver‐restricted GADD45 beta over‐expression (n = 4/group). Insert shows a representative FABP1 immunoblot.FLiver fraction enrichment of FABP1 from obese/diabetic male db/db mice fasted for 24 h with (AD‐G45b OE) or without (AD‐NC) liver‐restricted GADD45 beta over‐expression (n = 4/group). Insert shows a representative FABP1 immunoblot.GFABP1 and GADD45B immunoblots from Flag immunoprecipitations (IP‐FLAG) or mock IP (IP‐HA) from liver input samples from mice with (AD‐G45b OE) or without (AD‐NC) liver‐restricted GADD45 beta over‐expression. Shown is a representative immunoblot from 3 separate experiments using 3 different input samples per condition.H–JLiver tissue long‐chain acyl‐CoA (LC‐acyl‐CoA) concentrations were determined in GADD45 beta +/+ (WT) or GADD45 beta −/− (KO) mice (H; n = 6/group) with (AD‐G45b OE) or without (AD‐NC) liver‐restricted GADD45 beta over‐expression (I; n = 5/group). Liver LC‐acyl‐CoA concentrations were determined in wild‐type (WT; C57Bl/6J) or obese/diabetic (db/db; BKS.Cg‐m+/+ Lepr DB/J) mice with (AD‐G45b OE) or
Detection of Mouse CD36/SR-B3 by Western Blot
HIIT improves lipid metabolism of skeletal muscle in T2DM mice. (A,D) Protein expressions of ACC, HMGCR, CPT-1 alpha, CD36, and internal control alpha -tubulin in skeletal muscle. (B,C,E,F) Quantification of proteins described in (A,D) with normalization to protein levels of alpha -tubulin. All data are presented as mean ± SEM. n = 4 per group; *p < 0.05, **p < 0.01. Image collected and cropped by CiteAb from the following publication (https://pubmed.ncbi.nlm.nih.gov/32922365), licensed under a CC-BY license. Not internally tested by R&D Systems.
Detection of Mouse CD36/SR-B3 by Immunocytochemistry/ Immunofluorescence
Absence of Endo1 increases cell surface CD36 levels and lipid uptake in adipocytes.(A) Cell surface expression of CD36 in mature white adipocytes. **P < 0.01 versus WT. Results are expressed as mean ± SEM (n = 4). Two-tailed t test. (B) Total CD36 expression in gonadal adipose tissue (GAT) and s.c. adipose tissue (SAT). The molecular weights of protein markers are indicated (kDa). Results are expressed as mean ± SEM (n = 5). (C) Immunofluorescence images of CD36 cell surface expression in differentiated white adipocytes (left panel). Level of cellular fluorescence determined by corrected total cell fluorescence per area (CTCF/area). Results are expressed as mean ± SEM (n = 9). ***P < 0.005 versus WT. Two-tailed t test (right panel). Scale bar: 20 μm. (D) Lipid uptake in differentiated adipocytes, mature adipocytes, and differentiated myotubes. Results are expressed as mean ± SEM (n = 5–6). *P < 0.05; **P < 0.01; ****P < 0.001 versus basal. †P < 0.05; ††P < 0.01; ††††P < 0.001 versus WT. One-way ANOVA with Bonferroni correction. Image collected and cropped by CiteAb from the following open publication (https://insight.jci.org/articles/view/168418), licensed under a CC-BY license. Not internally tested by R&D Systems.
Detection of Mouse CD36/SR-B3 by Immunocytochemistry/ Immunofluorescence
Endospanin 1 directly interacts with CD36.(A) Detection of Flag-CD36 in 6Myc-Endo1 immunoprecipitate from HEK293T cells coexpressing 6Myc-Endo1 and Flag-CD36 compared with HEK293T cells transfected with Flag-CD36 alone. Representative blots of 3 independent experiments. (B) Detection of 6Myc-Endo1 after Flag-CD36 immunoprecipitation from HEK293T cells coexpressing 6Myc-Endo1 and Flag-CD36 compared with HEK293T cells transfected with 6Myc-Endo1 alone. Representative blots of 3 independent experiments. (C) Kinetics of Endo1 and CD36 protein expression in differentiated adipocytes during differentiation of adipocyte precursors isolated from the stromal vascular fraction of the s.c. adipose tissue of WT mice into mature white adipocytes. Results are expressed as mean ± SEM of 8 independent experiments. One representative Western blot is shown. (D) Confocal immunofluorescence detection and colocalization of Endo1 (rabbit anti-Endo1) and CD36 (goat anti-CD36) in differentiated adipocytes. Nuclei (blue) are stained with fluorescent DAPI dye. Scale bar: 20 μm. Representative images of 4 independent experiments. (E) Detection of endogenous Endo1 and CD36 after immunoprecipitation with Endo1 or CD36 antibodies from lysates of visceral adipose tissue (VAT), gonadal adipose tissue (GAT), and s.c. adipose tissue (SAT) of WT and KO mice. Endo1-KO adipocytes and tissues were used as negative controls. The molecular weights of protein markers are indicated (kDa). Representative blots of 2 independent experiments. Image collected and cropped by CiteAb from the following open publication (https://insight.jci.org/articles/view/168418), licensed under a CC-BY license. Not internally tested by R&D Systems.
Detection of CD36/SR-B3 by Western Blot
Induced levels of lipogenic proteins after insulin stimulation were lower in DKO hepatocytes.(A) Expression levels of FASN, ACC, and FAT/CD36 in hepatocytes at 360 min after insulin stimulation were analyzed by immunoblotting. (B) Expression levels of lipogenic molecules are presented by measuring band intensities after correction with those of beta -Actin. Open and closed bars indicate WT and DKO hepatocytes, respectively. The numbers of mice examined were WT, n = 3; DKO, n = 4. Data are expressed as means ± S.D. *P<0.05, **P<0.01 and ***P<0.001 as compared between WT and DKO hepatocytes. #P<0.05 and ##P<0.01 as compared between basal and insulin stimulation. Image collected and cropped by CiteAb from the following open publication (https://pubmed.ncbi.nlm.nih.gov/36827398), licensed under a CC-BY license. Not internally tested by R&D Systems.
Detection of Mouse CD36/SR-B3 by Western Blot
Impact of peroxisomal defect on the expression of phagocytosis-related genes in WT and mutant (Abcd1−/−Abcd2−/− and Acox1−/−) BV-2 cells. (A) Schematic representation of the main actors of phagocytosis. (B) Venn diagrams illustrating the up- and downregulated phagocytosis-related DEGs in Abcd1−/−Abcd2−/− and Acox1−/− non-stimulated BV-2 cells (DataSet GSE200022). Genes whose expression level was measured at the protein level are boxed. (C) Pie chart displaying the number of up- or downregulated phagocytosis-related DEGs after a 24-h LPS treatment (Log2FC > 1, AdjP Value < 0.05) in WT, Abcd1−/−Abcd2−/−, and Acox1−/− BV-2 cells (DataSet GSE237635). (D) Venn diagrams representing the LPS response of these DEGs (three independent batches of BV-2 cells for each genotype). (E) Heat map representing RNA-Seq gene expression of these DEGs at 24 h after LPS stimulation in WT, Abcd1−/−Abcd2−/−, and Acox1−/− BV-2 cells. (F) Representative image of Western blotting analysis (three independent experiments) of the expression levels of CD36, FCGR2B, MRC1, TLR2, and TLR4 in WT, Abcd1−/−Abcd2−/−, and Acox1−/− BV-2 cells untreated (–) or treated with LPS for 24 h (+). Expected molecular weights are indicated. Source data are available online for this figure. Image collected and cropped by CiteAb from the following open publication (https://www.frontiersin.org/articles/10.3389/fnmol.2023.1299314/full), licensed under a CC-BY license. Not internally tested by R&D Systems.
Mouse CD36 / SR-B3 ELISA Standard Curve
Recombinant Mouse CD36/SR‑B3 Fc Chimera (Catalog # 2519-CD) was serially diluted and captured by Goat Anti-Mouse CD36/SR‑B3 Antigen Affinity-purified Polyclonal Antibody (Catalog # AF2519) coated on a Clear Polystyrene Microplate (Catalog # DY990). Goat Anti-Mouse CD36/SR‑B3 Antigen Affinity-purified Polyclonal Antibody (Catalog # AF2519) was biotinylated and incubated with the protein captured on the plate. Detection of the standard curve was achieved by incubating Streptavidin-HRP (Catalog # DY998)
Mouse CD36 / SR-B3 ELISA Standard Curve
Recombinant Mouse CD36/SR‑B3 Fc Chimera (Catalog # 2519-CD) was serially diluted and captured by Goat Anti-Mouse CD36/SR‑B3 Antigen Affinity-purified Polyclonal Antibody (Catalog # AF2519) coated on a Clear Polystyrene Microplate (Catalog # DY990). Goat Anti-Mouse CD36/SR‑B3 Antigen Affinity-purified Polyclonal Antibody (Catalog # AF2519) was biotinylated and incubated with the protein captured on the plate. Detection of the standard curve was achieved by incubating Streptavidin-HRP (Catalog # DY998)Applications for Mouse CD36/SR-B3 Antibody
Application
Recommended Usage
CyTOF-ready
Ready to be labeled using established conjugation methods. No BSA or other carrier proteins that could interfere with conjugation.
Flow Cytometry
2.5 µg/106 cells
Sample: J774A.1 mouse monocyte/macrophage cell line
Sample: J774A.1 mouse monocyte/macrophage cell line
Immunohistochemistry
3-15 µg/mL
Sample: Immersion fixed paraffin-embedded sections of mouse kidney
Sample: Immersion fixed paraffin-embedded sections of mouse kidney
Western Blot
0.1 µg/mL
Sample: Recombinant Mouse CD36/SR-B3 Fc Chimera (Catalog # 2519-CD)
Sample: Recombinant Mouse CD36/SR-B3 Fc Chimera (Catalog # 2519-CD)
Mouse CD36/SR-B3 Sandwich Immunoassay
Please Note: Optimal dilutions of this antibody should be experimentally determined.
Reviewed Applications
Read 1 review rated 5 using AF2519 in the following applications:
Flow Cytometry Panel Builder
Bio-Techne Knows Flow Cytometry
Save time and reduce costly mistakes by quickly finding compatible reagents using the Panel Builder Tool.
Advanced Features
- Spectra Viewer - Custom analysis of spectra from multiple fluorochromes
- Spillover Popups - Visualize the spectra of individual fluorochromes
- Antigen Density Selector - Match fluorochrome brightness with antigen density

Formulation, Preparation, and Storage
Purification
Antigen Affinity-purified
Reconstitution
Reconstitute at 0.2 mg/mL in sterile PBS. For liquid material, refer to CoA for concentration.
Loading...
Formulation
Lyophilized from a 0.2 μm filtered solution in PBS with Trehalose. *Small pack size (SP) is supplied either lyophilized or as a 0.2 µm filtered solution in PBS.
Shipping
Lyophilized product is shipped at ambient temperature. Liquid small pack size (-SP) is shipped with polar packs. Upon receipt, store immediately at the temperature recommended below.
Stability & Storage
Use a manual defrost freezer and avoid repeated freeze-thaw cycles.
- 12 months from date of receipt, -20 to -70 °C as supplied.
- 1 month, 2 to 8 °C under sterile conditions after reconstitution.
- 6 months, -20 to -70 °C under sterile conditions after reconstitution.
Calculators
Background: CD36/SR-B3
References
- Febbraio, M. et al. (2001) J. Clin. Invest. 108:795.
- Silverstein, R.L. and M. Febbraio (2000) Curr. Opin. Lipid. 11:483.
- Gruarin, P. et al. (2000) Biochem. Biophys. Res. Commun. 275:446.
- Endemann, G. et al. (1993) J. Biol. Chem. 268:11811.
- Malaud, E. et al. (2002) Biochem. J. 364:507.
- Tao, N. et al. (1996) J. Biol. Chem. 271:22315.
- Daviet, L. et al. (1997) Thromb. Haemost. 78:897.
- Simantov, R. and R.L. Silverstein (2003) Front. Biosci. 8:s874.
Long Name
Scavenger Receptor Class B, Member 3
Alternate Names
CD36, Collagen R, FAT, GPIIIb, GPIV, SCARB3, SR-B3, SRB3, Thrombospondin R
Gene Symbol
CD36
UniProt
Additional CD36/SR-B3 Products
Product Documents for Mouse CD36/SR-B3 Antibody
Certificate of Analysis
To download a Certificate of Analysis, please enter a lot or batch number in the search box below.
Note: Certificate of Analysis not available for kit components.
Product Specific Notices for Mouse CD36/SR-B3 Antibody
For research use only
Citations for Mouse CD36/SR-B3 Antibody
 Powered by Bioz
Customer Reviews for Mouse CD36/SR-B3 Antibody (1)
5 out of 5
1 Customer Rating
Have you used Mouse CD36/SR-B3 Antibody?
Submit a review and receive an Amazon gift card!
$25/€18/£15/$25CAN/¥2500 Yen for a review with an image
$10/€7/£6/$10CAN/¥1110 Yen for a review without an image
Submit a review
Showing
1
-
1 of
1 review
Showing All
Filter By:
-
Application: Immunohistochemistry-FrozenSample Tested: See PMID 22651926Species: MouseVerified Customer | Posted 01/07/2015
There are no reviews that match your criteria.
Protocols
Find general support by application which include: protocols, troubleshooting, illustrated assays, videos and webinars.
- 7-Amino Actinomycin D (7-AAD) Cell Viability Flow Cytometry Protocol
- Antigen Retrieval Protocol (PIER)
- Antigen Retrieval for Frozen Sections Protocol
- Appropriate Fixation of IHC/ICC Samples
- Cellular Response to Hypoxia Protocols
- Chromogenic IHC Staining of Formalin-Fixed Paraffin-Embedded (FFPE) Tissue Protocol
- Chromogenic Immunohistochemistry Staining of Frozen Tissue
- ClariTSA™ Fluorophore Kits
- Detection & Visualization of Antibody Binding
- Extracellular Membrane Flow Cytometry Protocol
- Flow Cytometry Protocol for Cell Surface Markers
- Flow Cytometry Protocol for Staining Membrane Associated Proteins
- Flow Cytometry Staining Protocols
- Flow Cytometry Troubleshooting Guide
- Fluorescent IHC Staining of Frozen Tissue Protocol
- Graphic Protocol for Heat-induced Epitope Retrieval
- Graphic Protocol for the Preparation and Fluorescent IHC Staining of Frozen Tissue Sections
- Graphic Protocol for the Preparation and Fluorescent IHC Staining of Paraffin-embedded Tissue Sections
- Graphic Protocol for the Preparation of Gelatin-coated Slides for Histological Tissue Sections
- IHC Sample Preparation (Frozen sections vs Paraffin)
- Immunofluorescent IHC Staining of Formalin-Fixed Paraffin-Embedded (FFPE) Tissue Protocol
- Immunohistochemistry (IHC) and Immunocytochemistry (ICC) Protocols
- Immunohistochemistry Frozen Troubleshooting
- Immunohistochemistry Paraffin Troubleshooting
- Intracellular Flow Cytometry Protocol Using Alcohol (Methanol)
- Intracellular Flow Cytometry Protocol Using Detergents
- Intracellular Nuclear Staining Flow Cytometry Protocol Using Detergents
- Intracellular Staining Flow Cytometry Protocol Using Alcohol Permeabilization
- Intracellular Staining Flow Cytometry Protocol Using Detergents to Permeabilize Cells
- Preparing Samples for IHC/ICC Experiments
- Preventing Non-Specific Staining (Non-Specific Binding)
- Primary Antibody Selection & Optimization
- Propidium Iodide Cell Viability Flow Cytometry Protocol
- Protocol for Heat-Induced Epitope Retrieval (HIER)
- Protocol for Liperfluo
- Protocol for Making a 4% Formaldehyde Solution in PBS
- Protocol for VisUCyte™ HRP Polymer Detection Reagent
- Protocol for the Characterization of Human Th22 Cells
- Protocol for the Characterization of Human Th9 Cells
- Protocol for the Preparation & Fixation of Cells on Coverslips
- Protocol for the Preparation and Chromogenic IHC Staining of Frozen Tissue Sections
- Protocol for the Preparation and Chromogenic IHC Staining of Frozen Tissue Sections - Graphic
- Protocol for the Preparation and Chromogenic IHC Staining of Paraffin-embedded Tissue Sections
- Protocol for the Preparation and Chromogenic IHC Staining of Paraffin-embedded Tissue Sections - Graphic
- Protocol for the Preparation and Fluorescent IHC Staining of Frozen Tissue Sections
- Protocol for the Preparation and Fluorescent IHC Staining of Paraffin-embedded Tissue Sections
- Protocol for the Preparation of Gelatin-coated Slides for Histological Tissue Sections
- Protocol: Annexin V and PI Staining by Flow Cytometry
- Protocol: Annexin V and PI Staining for Apoptosis by Flow Cytometry
- R&D Systems Quality Control Western Blot Protocol
- TUNEL and Active Caspase-3 Detection by IHC/ICC Protocol
- The Importance of IHC/ICC Controls
- Troubleshooting Guide: Fluorokine Flow Cytometry Kits
- Troubleshooting Guide: Immunohistochemistry
- Troubleshooting Guide: Western Blot Figures
- Western Blot Conditions
- Western Blot Protocol
- Western Blot Protocol for Cell Lysates
- Western Blot Troubleshooting
- Western Blot Troubleshooting Guide
- View all Protocols, Troubleshooting, Illustrated assays and Webinars