Rat GFR alpha-1/GDNF R alpha-1 Antibody
R&D Systems | Catalog # AF560

Key Product Details
Validated by
Biological Validation
Species Reactivity
Validated:
Rat
Cited:
Human, Mouse, Rat, Porcine, Avian - Chicken, Transgenic Mouse
Applications
Validated:
Immunohistochemistry, Western Blot, Blockade of Receptor-ligand Interaction
Cited:
Immunohistochemistry, Immunohistochemistry-Paraffin, Immunohistochemistry-Frozen, Western Blot, Neutralization, Flow Cytometry, Immunocytochemistry, IFC, Immunochromatography
Label
Unconjugated
Antibody Source
Polyclonal Goat IgG
Loading...
Product Specifications
Immunogen
Mouse myeloma cell line NS0-derived recombinant rat GFR alpha ‑1/GDNF R alpha ‑1
Asp25-Leu445
Accession # Q62997
Asp25-Leu445
Accession # Q62997
Specificity
Detects rat GFR alpha ‑1/GDNF R alpha ‑1 in direct ELISAs and Western blots. In direct ELISAs, approximately 20% cross-reactivity with recombinant human GFR alpha ‑1 is observed and less than 1% cross-reactivity with recombinant mouse GFR alpha ‑2 is observed.
Clonality
Polyclonal
Host
Goat
Isotype
IgG
Scientific Data Images for Rat GFR alpha-1/GDNF R alpha-1 Antibody
Detection of Rat GFR alpha ‑1/GDNF R alpha ‑1 by Western Blot.
Western blot shows lysates of rat brain tissue. PVDF membrane was probed with 0.2 µg/mL of Goat Anti-Rat GFRa-1/GDNF Ra-1 Antigen Affinity-purified Polyclonal Antibody (Catalog # AF560) followed by HRP-conjugated Anti-Goat IgG Secondary Antibody (Catalog # HAF109). A specific band was detected for GFRa-1/GDNF Ra-1 at approximately 52 kDa (as indicated). This experiment was conducted under non-reducing conditions and using Immunoblot Buffer Group 1.
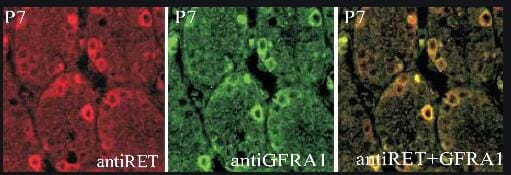
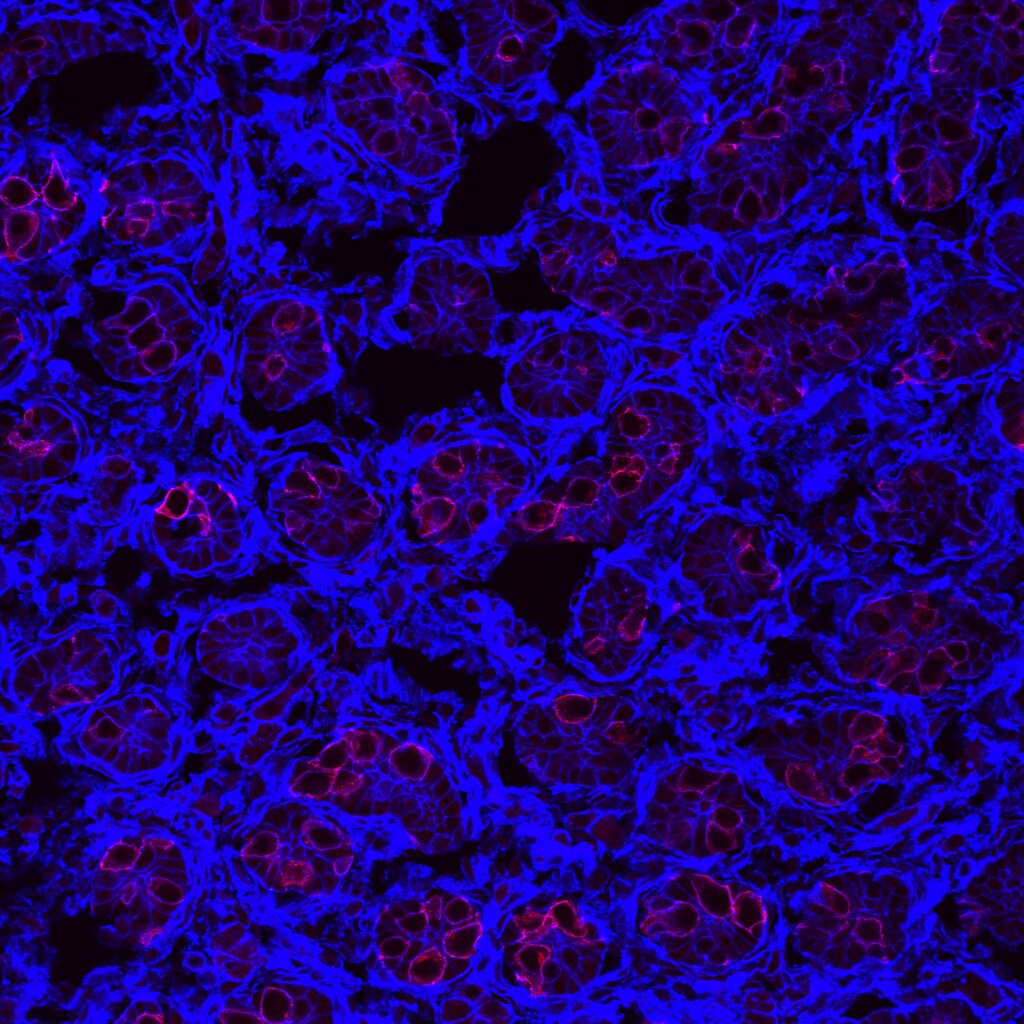
GFR alpha ‑1/GDNF R alpha ‑1 in Rat Spinal Cord.
GFRa-1/GDNF Ra-1 was detected in perfusion fixed frozen sections of rat spinal cord using Goat Anti-Rat GFRa-1/GDNF Ra-1 Antigen Affinity-purified Polyclonal Antibody (Catalog # AF560) at 15 µg/mL overnight at 4 °C. Tissue was stained using the Anti-Goat HRP-DAB Cell & Tissue Staining Kit (brown; Catalog # CTS008) and counterstained with hematoxylin (blue). Specific staining was localized to spinal cord dorsal horn. View our protocol for Chromogenic IHC Staining of Frozen Tissue Sections.
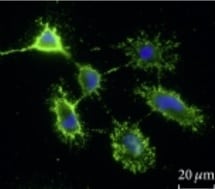
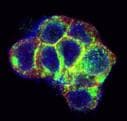
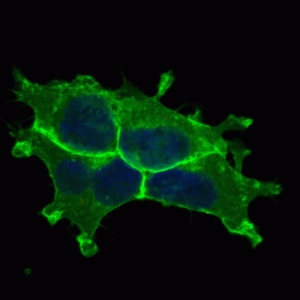
Detection of Mouse GFR alpha-1/GDNF R alpha-1 by Immunocytochemistry/ Immunofluorescence
Ectopic RAR gamma expression by GFR alpha 1+ spermatogonia. (A) The CAG-CAT-3xFLAG-Rarg transgene. When CAT between the loxP sites is deleted by TM-activated Cre, FLAG-tagged RAR gamma is constitutively expressed under the control of the CAG promoter. (B) Experimental design of the fate analysis of GFR alpha 1+ cells with enforced FLAG-RAR gamma expression upon VA readministration in VAD mice, as shown in C-F. Gfra1-CreERT2; CAG-CAT-3xFLAG-Rarg transgenic mice were maintained in VAD and VA was administered 2 days after TM injection, as indicated. Testes were then processed for IF. (C,D) IF images of whole-mount seminiferous tubules of the mice described above, 2 days after VA injection, stained for FLAG-RAR gamma (green) and KIT (magenta) (C), and cell number relative to the number of initial induced cells (D). Data for GFP-labeled NGN3+ and GFR alpha 1+ cells are reproduced from Fig. 2C and Fig. 3C, respectively, for comparison. The mean±s.e.m. value of three testes is shown. *P<0.003 (t-test), compared with the values of FLAG-RAR gamma + GFR alpha 1+ cells at day 2. (E,F) Representative confocal images of the same field of whole-mounts of seminiferous tubules of mice treated as described above, at 2 days after VA injection; staining was performed for GFR alpha 1, KIT and FLAG (E). Open arrowheads, white arrowheads and small arrows indicate FLAG+ cells that are GFR alpha 1+/KIT+, GFR alpha 1+/KIT− and GFR alpha 1−/KIT+, respectively. (F) Quantitation of GFP+ and FLAG-RAR gamma + cells showing different patterns of GFR alpha 1 and KIT expression in Gfra1-CreERT2; CAG-CAT-EGFP and Gfra1-CreERT2; CAG-CAT-3xFLAG-Rarg mice, respectively. Cell numbers are shown above each bar. (G) Experimental design of the fate analysis of GFR alpha 1+ cells with enforced FLAG-RAR gamma expression under normal conditions, as shown in H-J. Gfra1-CreERT2; CAG-CAT-3xFLAG-Rarg transgenic mice were pulsed with TM at 13-17 weeks of age, and after 2 and 10 days their testes were processed for IF. (H) IF images of whole-mount seminiferous tubules 2 and 10 days after TM injection, stained f
Detection of Mouse GFR alpha-1/GDNF R alpha-1 by Immunocytochemistry/ Immunofluorescence
Fate of pulse-labeled GFR alpha 1+ spermatogonia during VAD/VA administration. (A) The experimental schedule for B and C. Two days after the TM pulse, Gfra1-CreERT2; CAG-CAT-EGFP transgenic mice maintained in VAD were injected with VA and then fed a normal diet. Testis samples were harvested at the indicated times. (B) Representative IF images of whole-mount seminiferous tubule 0, 2, 6 and 10 days after VA injection stained for GFP and GFR alpha 1. (C) The number of GFP-labeled GFR alpha 1+ Aundiff (magenta), GFR alpha 1− Aundiff (green), KIT+ (blue) spermatogonia and total labeled (black) cells. Shown is the mean±s.e.m. of five, five, seven, six, four and three testes for days 0, 2, 4, 6, 8 and 10, respectively. Data, except for those of GFR alpha 1+ cells, on days 2, 6, 8 and 10 were significantly different compared with the values on day 0 (P<0.03, t-test). (D) Schedule for E and F. After the TM pulse, Gfra1-CreERT2; CAG-CAT-EGFP transgenic mice were continually fed the VAD diet. (E) Representative IF images of whole-mount seminiferous tubule 2, 14 and 30 days after TM pulse stained for GFP and GFR alpha 1. (F) Number of GFP-labeled GFR alpha 1+ Aundiff (magenta) and GFR alpha 1− Aundiff (green) spermatogonia and total labeled cells (black), shown as the mean±s.e.m. of eight, three and five testes on days 0, 14 and 30, respectively. *P=0.032, **P<0.002 (t-test) compared with the values for day 2. Scale bars: 50 μm. Image collected and cropped by CiteAb from the following open publication (https://journals.biologists.com/dev/article/doi/10.1242/dev.118695/2586…), licensed under a CC-BY license. Not internally tested by R&D Systems.
Detection of Mouse GFR alpha-1/GDNF R alpha-1 by Western Blot
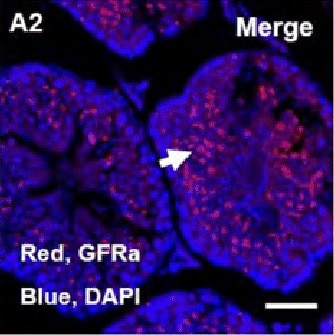
Characterization of GFR alpha 1 and co-receptor expression in neurons and synapses of the septum→Hb→IPN pathway.(A) dTomato epifluorescence (red) in sagittal sections of Gfra1dTOM mouse brain injected with tamoxifen at 3 months counterstained with DAPI (blue). Scale bar, 500 μm. (B) GFP (green) and ChAT (red) immunostaining in sagittal sections of a 3-month-old Gfra1GFP mouse brain counterstained with DAPI (blue). Scale bar, 400 μm. (C, D) GFP (green), ChAT (red), and SP (gray) immunostaining in coronal sections of the mHb (C) and IPN (D) of a 3-month-old Gfra1GFP mouse brain. Scale bars, 200 μm. (E) GFR alpha 1 immunostaining (red) in coronal sections of the mHb and IPN from a 3-month-old control (C57BL6/J) mouse. Scale bars, 200 μm. (F) GFP (green) and GFR alpha 1 (red) immunostaining in a coronal section containing the IPN of a 3-month-old Gad67Cre;R1CGfx/fx mouse. GFP signal represents the GABAergic cells that express Gfra1. Scale bars, 100 μm (merged) and 35 μm (inset). (G) GFP (green) and CR (red) immunostaining in coronal sections of the BAC and TS from a 3-month-old Gfra1GFP mouse brain counterstained with DAPI (blue). Scale bars, 100 μm (BAC) and 200 μm (TS). (H, I) Immunoblots of We, Ct, and Sn protein extracts from the mHb and IPN of 3-month-old C57BL6/J mice probed for GFR alpha 1 and NCAM (H) or RET and PSD95 (I). Tubulin was probed as loading control. (J, M) GFR alpha 1 (green) and PSD93 (red) immunostaining in the mHb (J) and IPN (L) of 3-month-old C57BL6/J mice. Scale bars, 10 μm (merged) and 5 μm (insets). Graphs show the quantification (± SEM) of GFR alpha 1, PSD93, and double-labeled puncta in mHb (K) and IPN (M). N = 5 mice (25–30 images per mouse per structure). The data underlying this figure can be found at https://figshare.com/projects/Raw_Data_Fernandez-Suarez_et_al_2021/1234…. 3V, 3th ventricle; ChAT, choline acetyltransferase; CR, calretinin; Ct, cytosolic protein fraction; dIPN, dorsal interpeduncular nucleus; dmHb, dorsal medial habenula; FR, fasciculus retroflexus; GFR alpha 1
Detection of Mouse GFR alpha-1/GDNF R alpha-1 by Western Blot
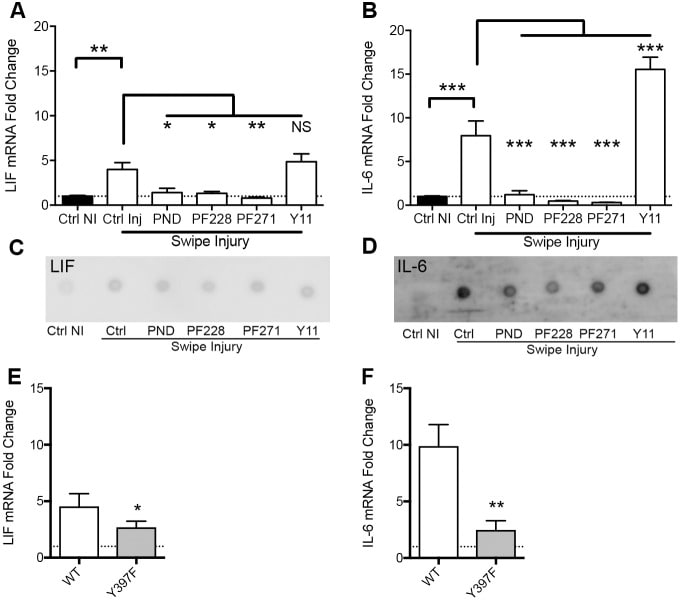
Spermatogenesis development of adult Mafb-cKO mice.Six-week-old mice were injected with tamoxifen and testes of cKO mice at 3- and 8-months of age were examined compared to those of age-matched controls (n = 4 for each group). (A) Testicular sections stained with Periodic acid-Schiff (PAS). (B) Immunostaining with various testicular cell types; undifferentiated spermatogonia (GFRA1 and PLZF), differentiated spermatogonia (KIT+ inside the tubule), spermatocytes (SCP3), spermatids (PNA-Lectin), Sertoli cells (SOX9 and Vimentin), and Leydig cells (KIT+ outside the tubule and STAR). The color of markers is indicated in the left boxes in panels. Colored arrows corresponding to the boxed markers are shown. (C) The expression level of the genes involved in testis function and germ cell development. The marker genes representing undifferentiated spermatogonia (Nanos3), differentiated spermatogonia (c-Kit), undifferentiated and differentiated spermatogonia (Sohlh1), differentiated spermatogonia and preleptotene spermatocytes (Stra8), spermatids (Prm2), Leydig cells (Hsd3b1), and Sertoli cells (Sox9) were analyzed by qRT-PCR. Each reaction was performed in duplicate for each gene. The data represent the means±SEM and are shown as relative mRNA expression after normalization to Hprt. *P<0.05. (D) The proportion of seminiferous stages: I-III, IV-VI, VII-VIII, and IX-XII from each genotype. *P<0.05. M; Month. Image collected and cropped by CiteAb from the following open publication (https://dx.plos.org/10.1371/journal.pone.0190800), licensed under a CC-BY license. Not internally tested by R&D Systems.
Detection of Mouse GFR alpha-1/GDNF R alpha-1 by Immunocytochemistry/ Immunofluorescence
Ectopic RAR gamma expression by GFR alpha 1+ spermatogonia. (A) The CAG-CAT-3xFLAG-Rarg transgene. When CAT between the loxP sites is deleted by TM-activated Cre, FLAG-tagged RAR gamma is constitutively expressed under the control of the CAG promoter. (B) Experimental design of the fate analysis of GFR alpha 1+ cells with enforced FLAG-RAR gamma expression upon VA readministration in VAD mice, as shown in C-F. Gfra1-CreERT2; CAG-CAT-3xFLAG-Rarg transgenic mice were maintained in VAD and VA was administered 2 days after TM injection, as indicated. Testes were then processed for IF. (C,D) IF images of whole-mount seminiferous tubules of the mice described above, 2 days after VA injection, stained for FLAG-RAR gamma (green) and KIT (magenta) (C), and cell number relative to the number of initial induced cells (D). Data for GFP-labeled NGN3+ and GFR alpha 1+ cells are reproduced from Fig. 2C and Fig. 3C, respectively, for comparison. The mean±s.e.m. value of three testes is shown. *P<0.003 (t-test), compared with the values of FLAG-RAR gamma + GFR alpha 1+ cells at day 2. (E,F) Representative confocal images of the same field of whole-mounts of seminiferous tubules of mice treated as described above, at 2 days after VA injection; staining was performed for GFR alpha 1, KIT and FLAG (E). Open arrowheads, white arrowheads and small arrows indicate FLAG+ cells that are GFR alpha 1+/KIT+, GFR alpha 1+/KIT− and GFR alpha 1−/KIT+, respectively. (F) Quantitation of GFP+ and FLAG-RAR gamma + cells showing different patterns of GFR alpha 1 and KIT expression in Gfra1-CreERT2; CAG-CAT-EGFP and Gfra1-CreERT2; CAG-CAT-3xFLAG-Rarg mice, respectively. Cell numbers are shown above each bar. (G) Experimental design of the fate analysis of GFR alpha 1+ cells with enforced FLAG-RAR gamma expression under normal conditions, as shown in H-J. Gfra1-CreERT2; CAG-CAT-3xFLAG-Rarg transgenic mice were pulsed with TM at 13-17 weeks of age, and after 2 and 10 days their testes were processed for IF. (H) IF images of whole-mount seminiferous tubules 2 and 10 days after TM injection, stained f
Detection of Mouse GFR alpha-1/GDNF R alpha-1 by Immunocytochemistry/ Immunofluorescence
Expression of genes in the RA signaling pathway and the specificity of RAR gamma expression by NGN3+ spermatogonia. (A) Scatter plot comparing the levels of transcripts expressed by GFR alpha 1+ and NGN3+ cells according to microarray analysis. For each fraction, average values from three independent RNA samples sorted from different animals are shown. The middle line indicates a difference of 0, and the outer lines represent ratios {log2([NGN3+]/[GFR alpha 1+])} of 1.0 and −1.0. Red dots indicate genes expressed at significantly different levels (P<0.05, t-test with Benjamini–Hochberg correction). Members of the Rar and Rxr gene families are indicated. A list of the genes in this panel is shown in supplementary material Table S2. (B) qRT-PCR analysis of Rara and Rarg mRNA expression in GFR alpha 1+, NGN3+ and KIT+ spermatogonia. Relative copy numbers are shown in arbitrary units after normalization to the amount of Actb mRNA. The mean±s.e.m. values of three independent cell preparations from different animals are shown. *P=0.043, **P=0.011 and ***P=0.0065 (t-test). (C) Representative IF images of whole-mount seminiferous tubules from Ngn3-EGFP mice stained for EGFP, GFR alpha 1 and RAR gamma. (D,E) Frequency of single- and double-positive spermatogonia for the expression of RAR gamma and NGN3 (recognized as RAR gamma +/KIT− and NGN3-EGFP+/KIT−, respectively) (D) and of RAR gamma and GFR alpha 1 (E). Total counts are shown above each bar. Scale bar: 50 μm. Image collected and cropped by CiteAb from the following open publication (https://journals.biologists.com/dev/article/doi/10.1242/dev.118695/2586…), licensed under a CC-BY license. Not internally tested by R&D Systems.
Detection of Mouse GFR alpha-1/GDNF R alpha-1 by Immunocytochemistry/ Immunofluorescence
Fate of pulse-labeled GFR alpha 1+ spermatogonia during VAD/VA administration. (A) The experimental schedule for B and C. Two days after the TM pulse, Gfra1-CreERT2; CAG-CAT-EGFP transgenic mice maintained in VAD were injected with VA and then fed a normal diet. Testis samples were harvested at the indicated times. (B) Representative IF images of whole-mount seminiferous tubule 0, 2, 6 and 10 days after VA injection stained for GFP and GFR alpha 1. (C) The number of GFP-labeled GFR alpha 1+ Aundiff (magenta), GFR alpha 1− Aundiff (green), KIT+ (blue) spermatogonia and total labeled (black) cells. Shown is the mean±s.e.m. of five, five, seven, six, four and three testes for days 0, 2, 4, 6, 8 and 10, respectively. Data, except for those of GFR alpha 1+ cells, on days 2, 6, 8 and 10 were significantly different compared with the values on day 0 (P<0.03, t-test). (D) Schedule for E and F. After the TM pulse, Gfra1-CreERT2; CAG-CAT-EGFP transgenic mice were continually fed the VAD diet. (E) Representative IF images of whole-mount seminiferous tubule 2, 14 and 30 days after TM pulse stained for GFP and GFR alpha 1. (F) Number of GFP-labeled GFR alpha 1+ Aundiff (magenta) and GFR alpha 1− Aundiff (green) spermatogonia and total labeled cells (black), shown as the mean±s.e.m. of eight, three and five testes on days 0, 14 and 30, respectively. *P=0.032, **P<0.002 (t-test) compared with the values for day 2. Scale bars: 50 μm. Image collected and cropped by CiteAb from the following open publication (https://journals.biologists.com/dev/article/doi/10.1242/dev.118695/2586…), licensed under a CC-BY license. Not internally tested by R&D Systems.
Detection of Mouse GFR alpha-1/GDNF R alpha-1 by Immunocytochemistry/ Immunofluorescence
Retention of the spermatogonial phenotype following gene correction.Immunostaining was performed on gene-corrected GT59 (left) and GT65 cells (right): DAZL, a germ cell specific marker; GFRA1, POU5F1, ETV5, CDH1, and SOHLH1, markers of undifferentiated spermatogonia. Additionally, GT59 and GT65 cells were treated with the differentiation factor, retinoic acid (1 µM) or a vehicle control and then immunostained to examine levels of ZBTB16, a marker of undifferentiated spermatogonia. Bar represents 50 microns. Image collected and cropped by CiteAb from the following open publication (https://pubmed.ncbi.nlm.nih.gov/25409432), licensed under a CC-BY license. Not internally tested by R&D Systems.
Detection of Mouse GFR alpha-1/GDNF R alpha-1 by Immunocytochemistry/ Immunofluorescence
Testis anatomy and spermatogonial populations and their kinetics in the VAD model. (A) Anatomy of seminiferous tubules and seminiferous epithelium. Aundiff spermatogonia, including GFR alpha 1+ (magenta) and NGN3+ (green) cells and KIT+ differentiating spermatogonia (blue), reside in the basal compartment (between the basement membrane and the tight junction of Sertoli cells). (B) Hierarchical and heterogeneous composition of spermatogonia. PL, preleptotene spermatocytes. (C) Representative whole-mount IF images of spermatogonia derived from an Ngn3-EGFP mouse triple stained for GFR alpha 1, GFP and KIT. (D) The experimental schedule for E and F. Wild-type VAD mice were injected with VA and fed a normal (VA-sufficient) diet thereafter, before analysis at the indicated times. (E) Representative images of in situ hybridization analysis of Gfra1, Ngn3 and Kit expression in testis sections. Arrowheads indicate spermatogonia expressing these genes. Note the persisting Kit expression in interstitial cells (asterisks). (F) Counts of Gfra1+, Ngn3+ and Kit+ spermatogonia. Raw counts are summarized in supplementary material Table S1. Scale bars: 100 μm. Image collected and cropped by CiteAb from the following open publication (https://journals.biologists.com/dev/article/doi/10.1242/dev.118695/2586…), licensed under a CC-BY license. Not internally tested by R&D Systems.Applications for Rat GFR alpha-1/GDNF R alpha-1 Antibody
Application
Recommended Usage
Blockade of Receptor-ligand Interaction
Immunohistochemistry
5-15 µg/mL
Sample: Perfusion fixed frozen sections of rat spinal cord
Sample: Perfusion fixed frozen sections of rat spinal cord
Western Blot
0.2 µg/mL
Sample: Rat brain tissue
Sample: Rat brain tissue
Reviewed Applications
Read 14 reviews rated 4.7 using AF560 in the following applications:
Formulation, Preparation, and Storage
Purification
Antigen Affinity-purified
Reconstitution
Reconstitute at 0.2 mg/mL in sterile PBS. For liquid material, refer to CoA for concentration.
Loading...
Formulation
Lyophilized from a 0.2 μm filtered solution in PBS with Trehalose. *Small pack size (SP) is supplied either lyophilized or as a 0.2 µm filtered solution in PBS.
Shipping
Lyophilized product is shipped at ambient temperature. Liquid small pack size (-SP) is shipped with polar packs. Upon receipt, store immediately at the temperature recommended below.
Stability & Storage
Use a manual defrost freezer and avoid repeated freeze-thaw cycles.
- 12 months from date of receipt, -20 to -70 °C as supplied.
- 1 month, 2 to 8 °C under sterile conditions after reconstitution.
- 6 months, -20 to -70 °C under sterile conditions after reconstitution.
Calculators
Background: GFR alpha-1/GDNF R alpha-1
‑2 are members of a family of at least four cysteine-rich glycosyl-phosphatidylinositol (GPI)-linked cell surface proteins that share conserved placements of many of their cysteine residues. Binding of GDNF to membrane-associated GFR alpha -1 or GFR alpha -2 initiates the association with and activation of the Ret tyrosine kinase. Soluble GFR alpha s released enzymatically from the cell surface-associated protein with phosphatidylinositol phospholipase C, as well as recombinantly produced soluble GFR alpha -1, can also bind with high-affinity to GDNF and trigger the activation of Ret tyrosine kinase. Rat GFR alpha -1 cDNA encodes a 468 amino acid (aa) residue protein with an
N‑terminal 24 aa residue hydrophobic signal peptide. Like other GPI-linked proteins, rat GFR alpha -1 has a C-terminal hydrophobic region which is preceded by a three aa residue (ASS) GPI-binding site. Human GFR alpha -1 shares 93% amino acid identity with rat GFR alpha -1. The expression of the various GFR alpha s are differentially regulated in the central and peripheral nervous system, suggesting complementary roles for the GFR alpha s in mediating the activities of the GDNF family of neurotrophic factors.
References
- Thompson, J. et al. (1998) Mol. Cell Neurosci. 11:117.
- Trupp, M. et al. (1998) Mol. Cell Neurosci. 11:47.
- Baloh, R.H. et al. (1998) Proc. Natl. Acad. Sci. USA 95:5801.
Long Name
Glial Cell line-derived Neurotrophic Factor Receptor alpha 1
Alternate Names
GDNF R alpha-1, GFR alpha1, GFRa-1, GFRA1
Gene Symbol
GFRA1
UniProt
Additional GFR alpha-1/GDNF R alpha-1 Products
Product Documents for Rat GFR alpha-1/GDNF R alpha-1 Antibody
Certificate of Analysis
To download a Certificate of Analysis, please enter a lot or batch number in the search box below.
Note: Certificate of Analysis not available for kit components.
Product Specific Notices for Rat GFR alpha-1/GDNF R alpha-1 Antibody
For research use only
Related Research Areas
Citations for Rat GFR alpha-1/GDNF R alpha-1 Antibody
 Powered by Bioz
Customer Reviews for Rat GFR alpha-1/GDNF R alpha-1 Antibody (14)
4.7 out of 5
14 Customer Ratings
Have you used Rat GFR alpha-1/GDNF R alpha-1 Antibody?
Submit a review and receive an Amazon gift card!
$25/€18/£15/$25CAN/¥2500 Yen for a review with an image
$10/€7/£6/$10CAN/¥1110 Yen for a review without an image
Submit a review
Customer Images
Showing
1
-
5 of
14 reviews
Showing All
Filter By:
-
Application: ImmunohistochemistrySample Tested: Testis tissueSpecies: RatVerified Customer | Posted 07/22/2021

-
Application: ImmunohistochemistrySample Tested: Adult brainSpecies: RatVerified Customer | Posted 04/27/2021
-
Application: Immunocytochemistry/ImmunofluorescenceSample Tested: Balb/3T3 mouse embryonic fibroblast cell lineSpecies: MouseVerified Customer | Posted 04/13/2021
-
Application: Immunocytochemistry/ImmunofluorescenceSample Tested: Adult testisSpecies: MouseVerified Customer | Posted 11/11/2019IF 1:200 detect gfra1 positive cell in testis
-
Application: Immunocytochemistry/ImmunofluorescenceSample Tested: spermatogonial stem cellsSpecies: MouseVerified Customer | Posted 09/12/2019
-
Application: Immunocytochemistry/ImmunofluorescenceSample Tested: Testis tissueSpecies: MouseVerified Customer | Posted 04/22/2016Frozen sections from paraformaldehyde fixed postnatal day 1 mouse testes were cut at 5 microns and affixed to sides. Sections were permealbilized with 0.1% Triton X-100 in PBS, then blocked with 3% BSA in 0.1% Triton X-100 in PBS for 30 min. Sections were then incubated for 1 hour at RT with Goat Anti-Rat GFR alpha 1/GDNF R alpha 1 Antibody (R&D Systems AF560) at 5 µg/ml. After washing 3X with 0.1% Triton X-100 in PBS, sections were incubated with Donkey anti-Goat (H+L) Secondary Antibody, Alexa Fluor 555 conjugate (red; ThermoFisher Scientific A21432) for 1 hour at RT. Phalloidin was used a counterstain (blue) to label F-actin.
-
Application: ImmunofluorescenceSample Tested: See PMID 23012458Species: MouseVerified Customer | Posted 01/08/2015
-
Application: ImmunofluorescenceSample Tested: See PMID 22711565Species: MouseVerified Customer | Posted 01/08/2015
-
Application: ImmunofluorescenceSample Tested: Recombinant rat GFR alpha-1 expressed in 293 cellsSpecies: RatVerified Customer | Posted 12/18/2014
-
Application: ImmunoprecipitationSample Tested: Rat GFR alpha-1 expressed in 293 cellsSpecies: RatVerified Customer | Posted 12/18/2014
-
Application: Immunohistochemistry-FrozenSample Tested: PFA-fixed cryosections of mouse brainSpecies: MouseVerified Customer | Posted 12/18/2014
-
Application: ImmunofluorescenceSample Tested: Hippocampal neuronsSpecies: MouseVerified Customer | Posted 12/18/2014
-
Application: Western BlotSample Tested: Recombinant rat GFR alpha-1 expressed in 293 cellsSpecies: RatVerified Customer | Posted 12/18/2014
-
Application: Western BlotSample Tested: Hippocampal neuronsSpecies: MouseVerified Customer | Posted 12/18/2014
There are no reviews that match your criteria.
Protocols
Find general support by application which include: protocols, troubleshooting, illustrated assays, videos and webinars.
- Antigen Retrieval Protocol (PIER)
- Antigen Retrieval for Frozen Sections Protocol
- Appropriate Fixation of IHC/ICC Samples
- Cellular Response to Hypoxia Protocols
- Chromogenic IHC Staining of Formalin-Fixed Paraffin-Embedded (FFPE) Tissue Protocol
- Chromogenic Immunohistochemistry Staining of Frozen Tissue
- ClariTSA™ Fluorophore Kits
- Detection & Visualization of Antibody Binding
- Fluorescent IHC Staining of Frozen Tissue Protocol
- Graphic Protocol for Heat-induced Epitope Retrieval
- Graphic Protocol for the Preparation and Fluorescent IHC Staining of Frozen Tissue Sections
- Graphic Protocol for the Preparation and Fluorescent IHC Staining of Paraffin-embedded Tissue Sections
- Graphic Protocol for the Preparation of Gelatin-coated Slides for Histological Tissue Sections
- IHC Sample Preparation (Frozen sections vs Paraffin)
- Immunofluorescent IHC Staining of Formalin-Fixed Paraffin-Embedded (FFPE) Tissue Protocol
- Immunohistochemistry (IHC) and Immunocytochemistry (ICC) Protocols
- Immunohistochemistry Frozen Troubleshooting
- Immunohistochemistry Paraffin Troubleshooting
- Preparing Samples for IHC/ICC Experiments
- Preventing Non-Specific Staining (Non-Specific Binding)
- Primary Antibody Selection & Optimization
- Protocol for Heat-Induced Epitope Retrieval (HIER)
- Protocol for Making a 4% Formaldehyde Solution in PBS
- Protocol for VisUCyte™ HRP Polymer Detection Reagent
- Protocol for the Preparation & Fixation of Cells on Coverslips
- Protocol for the Preparation and Chromogenic IHC Staining of Frozen Tissue Sections
- Protocol for the Preparation and Chromogenic IHC Staining of Frozen Tissue Sections - Graphic
- Protocol for the Preparation and Chromogenic IHC Staining of Paraffin-embedded Tissue Sections
- Protocol for the Preparation and Chromogenic IHC Staining of Paraffin-embedded Tissue Sections - Graphic
- Protocol for the Preparation and Fluorescent IHC Staining of Frozen Tissue Sections
- Protocol for the Preparation and Fluorescent IHC Staining of Paraffin-embedded Tissue Sections
- Protocol for the Preparation of Gelatin-coated Slides for Histological Tissue Sections
- R&D Systems Quality Control Western Blot Protocol
- TUNEL and Active Caspase-3 Detection by IHC/ICC Protocol
- The Importance of IHC/ICC Controls
- Troubleshooting Guide: Immunohistochemistry
- Troubleshooting Guide: Western Blot Figures
- Western Blot Conditions
- Western Blot Protocol
- Western Blot Protocol for Cell Lysates
- Western Blot Troubleshooting
- Western Blot Troubleshooting Guide
- View all Protocols, Troubleshooting, Illustrated assays and Webinars
Loading...