TGF-beta 1, -2, and -3 are a closely related group of proteins (70-80% sequence homology) that are produced by many cell types and function as growth and differentiation factors. The active forms of TGF-beta 1, -2, and -3 are disulfide-linked homodimers.

Discontinued Product
MAB240 has been discontinued.
An alternative/replacement product is available:
MAB1835, MAB2402. View all TGF-beta 1 products.
Key Product Details
Species Reactivity
Validated:
Multi-Species
Cited:
Human, Mouse, Rat, Bovine, Canine, Feline, Primate - Macaca fascicularis (Crab-eating Monkey or Cynomolgus Macaque), Primate - Macaca mulatta (Rhesus Macaque), Primate - Papio anubis (Olive Baboon), Rabbit, Transgenic Mouse
Applications
Validated:
Immunohistochemistry, Western Blot, ELISA Capture (Matched Antibody Pair), Neutralization, Intracellular Staining by Flow Cytometry, Immunocytochemistry, CyTOF-ready
Cited:
Immunohistochemistry, Immunohistochemistry-Paraffin, Immunohistochemistry-Frozen, Western Blot, Neutralization, Flow Cytometry, Immunocytochemistry, Immunoprecipitation, Affinity Chromatography, Array Development, ELISA Capture, ELISA Development, In vivo assay, Functional Assay, Immunodepletion, SEM, Westen Blot
Label
Unconjugated
Antibody Source
Monoclonal Mouse IgG1 Clone # 9016
Loading...
Product Specifications
Immunogen
Chinese hamster ovary cell line CHO-derived recombinant TGF‑ beta 1 and latent TGF‑ beta 1
Specificity
Detects TGF-beta 1 from human, mouse, rat, and other species in direct ELISAs and Western blots. In sandwich ELISAs, less than
Clonality
Monoclonal
Host
Mouse
Isotype
IgG1
Endotoxin Level
<0.10 EU per 1 μg of the antibody by the LAL method.
Scientific Data Images for TGF-beta 1 Antibody (9016)
TGF‑ beta 1 in HEK293 Human Cell Line.
TGF-beta 1 was detected in immersion fixed HEK293 human embryonic kidney cell line using Mouse Anti-TGF-beta 1 Monoclonal Antibody (Catalog # MAB240) at 3 µg/mL for 3 hours at room temperature. Cells were stained using the NorthernLights™ 493-conjugated Anti-Mouse IgG Secondary Antibody (green; Catalog # NL009) and counterstained with DAPI (blue). Specific staining was localized to cytoplasm. View our protocol for Fluorescent ICC Staining of Cells on Coverslips.
TGF-beta 1 in Human Prostate Cancer Tissue.
TGF-beta 1 was detected in immersion fixed paraffin-embedded sections of human prostate cancer tissue using Mouse Anti- TGF-beta 1 Monoclonal Antibody (Catalog # MAB240) at 25 µg/mL overnight at 4 °C. Tissue was stained using the Anti-Mouse HRP-DAB Cell & Tissue Staining Kit (brown; Catalog # CTS002) and counterstained with hematoxylin (blue). Specific labeling was localized to the cytoplasm of epithelial cells in the prostate gland. View our protocol for Chromogenic IHC Staining of Paraffin-embedded Tissue Sections.
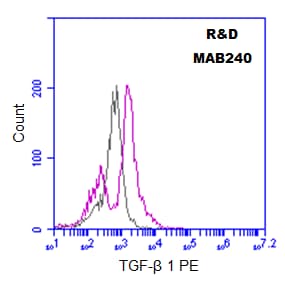
Detection of TGF‑ beta 1 in PC‑3 Human Cell Line by Flow Cytometry.
PC-3 human prostate cancer cell line was stained with Mouse Anti-TGF-beta 1 Monoclonal Antibody (Catalog # MAB240, filled histogram) or isotype control antibody (Catalog # MAB002, open histogram), followed by Allophycocyanin-conjugated Anti-Mouse IgG F(ab')2Secondary Antibody (Catalog # F0101B). To facilitate intracellular staining, cells were fixed with paraformaldehyde and permeabilized with saponin.
TGF‑ beta 1 Inhibition of IL‑4-dependent Cell Proliferation and Neutralization by TGF‑ beta 1 Antibody.
Recombinant Human TGF-beta 1 (Catalog # 240-B) inhibits Recombinant Mouse IL-4 (Catalog # 404-ML) induced proliferation in the HT-2 mouse T cell line in a dose-dependent manner (orange line). Inhibition of Recombinant Mouse IL-4 (7.5 ng/mL) activity elicited by Recombinant Human TGF-beta 1 (0.25 ng/mL) is neutralized (green line) by increasing concentrations of Mouse Anti-TGF-beta 1 Monoclonal Antibody (Catalog # MAB240). The ND50 is typically 0.3-1.0 µg/mL.
Detection of Mouse TGF-beta 1 by Western Blot
ERK and TGF-beta 1 levels in IBD-A33+ Li-EVs.(a) MC38 cells were treated with 1 mg ml−1 IBD lysates or Ctrl lysates for 24 h. TGF-beta 1 in MC38 cells or MC38-EVs was measured using western blot analysis. (b) MC38 cells were treated with 1 mg ml−1 IBD lysates or Ctrl lysates for the indicated times. Activation of ERK, JNK, p38 and ATK in MC38 cells was measured using western blot analysis. (c) MC38 cells were pretreated with DMSO, 10 μM ERK-specific inhibitor U0126 or JNK-specific inhibitor SP600125 for 30 min and then treated with 1 mg ml−1 IBD lysates or Ctrl lysates for 24 h. TGF-beta 1 in MC38-EVs was measured by western blot analysis. (d) Activation of ERK, JNK, p38 and ATK in colon tissues from healthy control or IBD mice was measured using western blot analysis. (e,f) Mice were fed with 2% DSS solution on day 0. Mice received intrarectal injection with 20 μg cholesterol-conjugated ERK or NC siRNA every other day on days 0–11. Twenty-four hours after the last injection, mice were killed. TGF-beta 1 in colon tissues and A33+ Li-EVs was measured using western blot analysis (e). The body weights of mice were measured daily (f). Ctrl group, mice that received normal drinking water. (a–e) Data are representative of three independent experiments; (f) data are presented as the mean±s.d. from one of the two independent experiments (n=5 per group). P values were generated by two-way ANOVA, followed by Newman–Keuls multiple comparison test using GraphPad Prism 5 (**P<0.01, ***P<0.001), IBD+NC siRNA versus IBD+ERK siRNA. Image collected and cropped by CiteAb from the following publication (https://pubmed.ncbi.nlm.nih.gov/27721471), licensed under a CC-BY license. Not internally tested by R&D Systems.
Detection of Mouse TGF-beta 1 by Western Blot
A33+ Li-EVs alleviate IBD through TGF-beta 1 signalling.(a) A33+ Li-EVs were isolated from healthy control or 2% DSS-induced IBD mice. TGF-beta 1, A33 and beta -Actin were detected by western blot analysis. (b) The CD4+ T-cell proliferation assay was performed as described above in the presence of 30 μg ml−1 Ctrl or IBD-A33+ Li-EVs, and the results were statistically analysed (n=9). (c–f) Mice were fed with drinking water containing 2% DSS on day 0. On days −2 and 2, the mice were intravenously treated with the indicated dose of A33+ Li-EVs. The body weights were measured daily (c). Appearance (left) and statistical analysis (right) of colonic length on days 11 (d). Histological appearance on day 11. Representative colonic sections stained with haematoxylin and eosine (H&E). In the PBS group, the right image is a magnified region of the left image (e). IL-1 beta, IL-6, TNF-alpha, IL-10, IL-22 levels and MPO activity in colon tissue were measured on day 11 (f). (g) IBD mice were treated with 100 μg A33+ Li-EVs, IBD-A33+ Li-EVs and Sp-EVs on days −2 and 2. The body weights were measured daily. (h) TGF-beta 1 in A33+ Li-EVs and Sp-EVs was detected using western blot analysis. (i) IBD was introduced into Smad3+/− mice and treated with 100 μg A33+ Li-EVs and IBD-A33+ Li-EVs on days −2 and 2. The body weights were measured daily. Ctrl group, mice received normal drinking water; PBS group, mice with drinking water containing 2% DSS and intravenously treated with PBS on days −2 and 2. (a,b,d–f) Data are representative of three independent experiments or shown as mean values±s.e.m. pooled from three independent experiments; (c,g,i) data are presented as the mean±s.d. from one of the three independent experiments (n=5 per group). P values were generated by one-way ANOVA in b,d,f, or two-way ANOVA in c,g,i, followed by Newman–Keuls multiple comparison test using GraphPad Prism 5 (*P<0.05, **P<0.01, ***P<0.001), corresponding colour indicating the relevant group versus PBS group in c, versus PBS group
Detection of Human TGF-beta 1 by Flow Cytometry
CD4+ V delta 1+ T-cell clones have a TH0-cytokine profile and are effector-memory cells. (A) CD4+ V delta 1+ clones produce regulatory IL-10 and TGF-beta, TH2 cytokines IL-4, -5, and -13, and to a lesser extent proinflammatory IL-17A and IL-6, and the TH1-cytokines IL-2, IFN-gamma, and TNF-alpha after stimulation with PMA/ionomycin. (B) CD4+ V delta 1+ clones were not naïve but belonged to the effector memory; they were CD45RA−, CD27−, CCR7−, and predominantly CD62L− and CD28±. Image collected and cropped by CiteAb from the following publication (https://journal.frontiersin.org/article/10.3389/fimmu.2014.00645/abstra…), licensed under a CC-BY license. Not internally tested by R&D Systems.
Detection of Mouse TGF-beta 1 by Western Blot
ERK and TGF-beta 1 levels in IBD-A33+ Li-EVs.(a) MC38 cells were treated with 1 mg ml−1 IBD lysates or Ctrl lysates for 24 h. TGF-beta 1 in MC38 cells or MC38-EVs was measured using western blot analysis. (b) MC38 cells were treated with 1 mg ml−1 IBD lysates or Ctrl lysates for the indicated times. Activation of ERK, JNK, p38 and ATK in MC38 cells was measured using western blot analysis. (c) MC38 cells were pretreated with DMSO, 10 μM ERK-specific inhibitor U0126 or JNK-specific inhibitor SP600125 for 30 min and then treated with 1 mg ml−1 IBD lysates or Ctrl lysates for 24 h. TGF-beta 1 in MC38-EVs was measured by western blot analysis. (d) Activation of ERK, JNK, p38 and ATK in colon tissues from healthy control or IBD mice was measured using western blot analysis. (e,f) Mice were fed with 2% DSS solution on day 0. Mice received intrarectal injection with 20 μg cholesterol-conjugated ERK or NC siRNA every other day on days 0–11. Twenty-four hours after the last injection, mice were killed. TGF-beta 1 in colon tissues and A33+ Li-EVs was measured using western blot analysis (e). The body weights of mice were measured daily (f). Ctrl group, mice that received normal drinking water. (a–e) Data are representative of three independent experiments; (f) data are presented as the mean±s.d. from one of the two independent experiments (n=5 per group). P values were generated by two-way ANOVA, followed by Newman–Keuls multiple comparison test using GraphPad Prism 5 (**P<0.01, ***P<0.001), IBD+NC siRNA versus IBD+ERK siRNA. Image collected and cropped by CiteAb from the following publication (https://pubmed.ncbi.nlm.nih.gov/27721471), licensed under a CC-BY license. Not internally tested by R&D Systems.Applications for TGF-beta 1 Antibody (9016)
Application
Recommended Usage
CyTOF-ready
Ready to be labeled using established conjugation methods. No BSA or other carrier proteins that could interfere with conjugation.
ELISA Capture (Matched Antibody Pair)
2-8 µg/mL
Immunocytochemistry
3-25 µg/mL
Sample: Immersion fixed HEK293 human embryonic kidney cell line
Sample: Immersion fixed HEK293 human embryonic kidney cell line
Immunohistochemistry
8-25 µg/mL
Sample: Immersion fixed paraffin-embedded sections of human prostate cancer tissue
Sample: Immersion fixed paraffin-embedded sections of human prostate cancer tissue
Intracellular Staining by Flow Cytometry
2.5 µg/106 cells
Sample: PC‑3 human prostate cancer cell line fixed with paraformaldehyde and permeabilized with saponin
Sample: PC‑3 human prostate cancer cell line fixed with paraformaldehyde and permeabilized with saponin
Western Blot
1 µg/mL
Sample: Recombinant Human TGF-beta 1 (Catalog # 240-B)
under non-reducing conditions only
Sample: Recombinant Human TGF-beta 1 (Catalog # 240-B)
under non-reducing conditions only
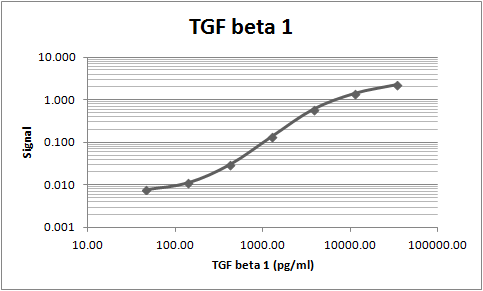
Neutralization
Measured by its ability to neutralize TGF‑ beta 1 inhibition of IL‑4-dependent proliferation in the HT‑2 mouse T cell line. Tsang, M. et al. (1995) Cytokine 7:389. The Neutralization Dose (ND50) is typically 0.3-1.0 µg/mL in the presence of 0.25 ng/mL Recombinant Human TGF‑ beta 1 and 7.5 ng/mL Recombinant Mouse IL‑4.
Reviewed Applications
Read 9 reviews rated 4.7 using MAB240 in the following applications:
Flow Cytometry Panel Builder
Bio-Techne Knows Flow Cytometry
Save time and reduce costly mistakes by quickly finding compatible reagents using the Panel Builder Tool.
Advanced Features
- Spectra Viewer - Custom analysis of spectra from multiple fluorochromes
- Spillover Popups - Visualize the spectra of individual fluorochromes
- Antigen Density Selector - Match fluorochrome brightness with antigen density

Formulation, Preparation, and Storage
Purification
Protein A or G purified from hybridoma culture supernatant
Reconstitution
Reconstitute at 0.5 mg/mL in sterile PBS. For liquid material, refer to CoA for concentration.
Formulation
Lyophilized from a 0.2 μm filtered solution in PBS with Trehalose. *Small pack size (SP) is supplied either lyophilized or as a 0.2 µm filtered solution in PBS.
Shipping
Lyophilized product is shipped at ambient temperature. Liquid small pack size (-SP) is shipped with polar packs. Upon receipt, store immediately at the temperature recommended below.
Stability & Storage
Use a manual defrost freezer and avoid repeated freeze-thaw cycles.
- 12 months from date of receipt, -20 to -70 °C as supplied.
- 1 month, 2 to 8 °C under sterile conditions after reconstitution.
- 6 months, -20 to -70 °C under sterile conditions after reconstitution.
Calculators
Background: TGF-beta 1
Long Name
Transforming Growth Factor beta 1
Alternate Names
TGF beta1, TGFB, TGFB1, TGFbeta 1
Gene Symbol
TGFB1
Additional TGF-beta 1 Products
Product Documents for TGF-beta 1 Antibody (9016)
Certificate of Analysis
To download a Certificate of Analysis, please enter a lot or batch number in the search box below.
Note: Certificate of Analysis not available for kit components.
Product Specific Notices for TGF-beta 1 Antibody (9016)
For research use only
Related Research Areas
Citations for TGF-beta 1 Antibody (9016)
 Powered by Bioz
Customer Reviews for TGF-beta 1 Antibody (9016) (9)
4.7 out of 5
9 Customer Ratings
Have you used TGF-beta 1 Antibody (9016)?
Submit a review and receive an Amazon gift card!
$25/€18/£15/$25CAN/¥2500 Yen for a review with an image
$10/€7/£6/$10CAN/¥1110 Yen for a review without an image
Submit a review
Customer Images
Showing
1
-
5 of
9 reviews
Showing All
Filter By:
-
Application: ELISASample Tested: SerumSpecies: HumanVerified Customer | Posted 08/29/2019

-
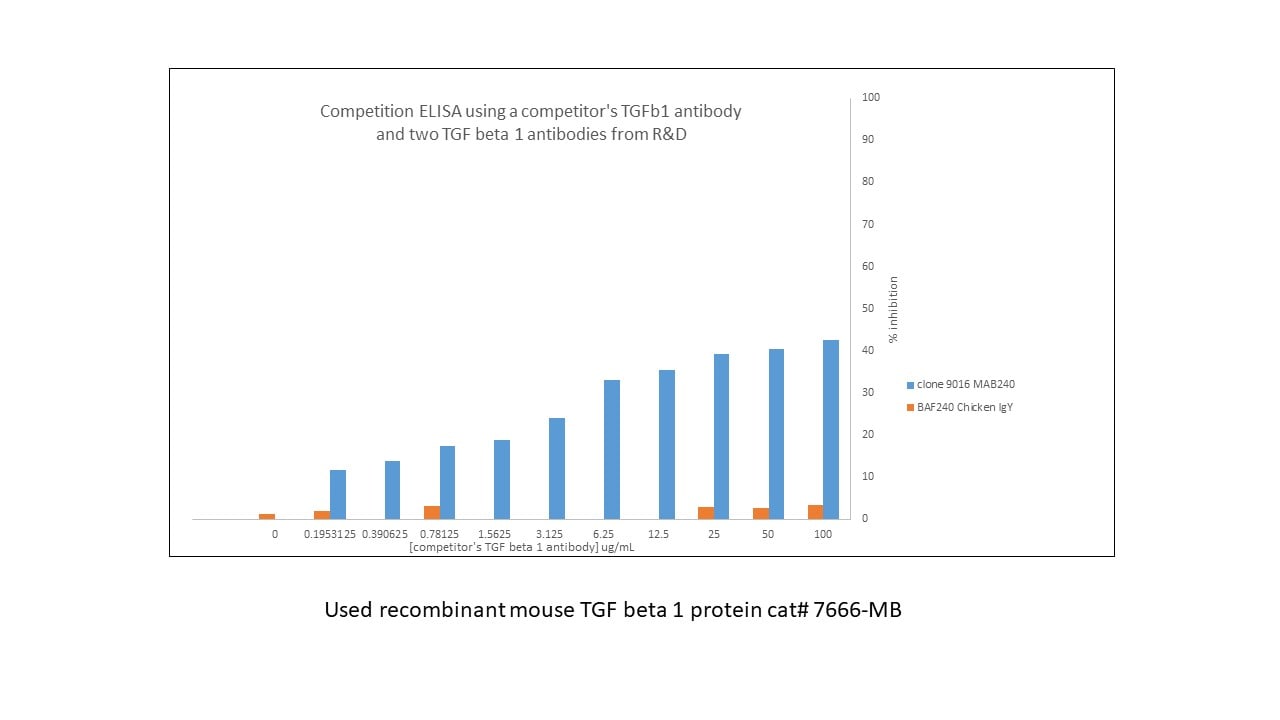
Sample Tested: Recombinant proteinSpecies: MouseVerified Customer | Posted 03/28/2019I performed a competition ELISA to see if another company's TGFb1 had a similar epitope to two of R&D's antibodies. I coated my plate with 50ng/well of recombinant mouse TGF beta 1 protein (cat# 7666-MB) overnight. I washed and blocked with reagent diluent 2 DY995 for 2hr, washed and added another company's TGFb1 antibody at different concentrations 0.2-100ug/mL in reagent diluent 2 and incubated 1hr. I did not wash my wells but add the two antibodies MAB240-biotinylated it in-house and BAF at a final concentration of 2ug/mL and incubated 1hr diluted in reagent diluent 2. I washed and added streptavidin-HRP DY998 (1:200) and incubated 30 mins, washed and developed with the substrate pack DY999. I found MAB240 competed for binding to the mouse TGF beta 1 protein when the competitor's antibody was present but the chicken polyclonal was not inhibited.
-
Application: ImmunohistochemistrySample Tested: A375 human melanoma cell lineSpecies: HumanVerified Customer | Posted 08/22/2018
-
Application: ImmunohistochemistrySample Tested: Brain tissueSpecies: MouseVerified Customer | Posted 08/08/201810.1093/cercor/bhy164
-
Application: ELISASample Tested: Tumor cell lyastesSpecies: MouseVerified Customer | Posted 04/01/2018
-
Application: ELISASample Tested: Serum and PlasmaSpecies: HumanVerified Customer | Posted 01/05/2018This antibody was used as the capture to build an ELISA for TGF-beta 1. BAF240 was used as the detection.
-
Application: Block/NeutralizeSample Tested: Blood monocytesSpecies: HumanVerified Customer | Posted 08/01/2017
-
Verified Customer | Posted 04/26/2017
-
Application: Flow CytometrySample Tested: Breast cancer cellsSpecies: HumanVerified Customer | Posted 12/07/201610^6 of MDA-MB-231 cells were stained for 30 minutes at 4C with 2.5 ug of Mouse TGF-beta 1 antibody (red), or control antibody (black). Secondary: PE-Goat anti-Mouse IgG 1:1,000. Blocking: 1% BSA. Unfixed cells.
There are no reviews that match your criteria.
Protocols
Find general support by application which include: protocols, troubleshooting, illustrated assays, videos and webinars.
- 7-Amino Actinomycin D (7-AAD) Cell Viability Flow Cytometry Protocol
- Antigen Retrieval Protocol (PIER)
- Antigen Retrieval for Frozen Sections Protocol
- Appropriate Fixation of IHC/ICC Samples
- Cellular Response to Hypoxia Protocols
- Chromogenic IHC Staining of Formalin-Fixed Paraffin-Embedded (FFPE) Tissue Protocol
- Chromogenic Immunohistochemistry Staining of Frozen Tissue
- ClariTSA™ Fluorophore Kits
- Detection & Visualization of Antibody Binding
- Extracellular Membrane Flow Cytometry Protocol
- Flow Cytometry Protocol for Cell Surface Markers
- Flow Cytometry Protocol for Staining Membrane Associated Proteins
- Flow Cytometry Staining Protocols
- Flow Cytometry Troubleshooting Guide
- Fluorescent IHC Staining of Frozen Tissue Protocol
- Graphic Protocol for Heat-induced Epitope Retrieval
- Graphic Protocol for the Preparation and Fluorescent IHC Staining of Frozen Tissue Sections
- Graphic Protocol for the Preparation and Fluorescent IHC Staining of Paraffin-embedded Tissue Sections
- Graphic Protocol for the Preparation of Gelatin-coated Slides for Histological Tissue Sections
- ICC Cell Smear Protocol for Suspension Cells
- ICC Immunocytochemistry Protocol Videos
- ICC for Adherent Cells
- IHC Sample Preparation (Frozen sections vs Paraffin)
- Immunocytochemistry (ICC) Protocol
- Immunocytochemistry Troubleshooting
- Immunofluorescence of Organoids Embedded in Cultrex Basement Membrane Extract
- Immunofluorescent IHC Staining of Formalin-Fixed Paraffin-Embedded (FFPE) Tissue Protocol
- Immunohistochemistry (IHC) and Immunocytochemistry (ICC) Protocols
- Immunohistochemistry Frozen Troubleshooting
- Immunohistochemistry Paraffin Troubleshooting
- Intracellular Flow Cytometry Protocol Using Alcohol (Methanol)
- Intracellular Flow Cytometry Protocol Using Detergents
- Intracellular Nuclear Staining Flow Cytometry Protocol Using Detergents
- Intracellular Staining Flow Cytometry Protocol Using Alcohol Permeabilization
- Intracellular Staining Flow Cytometry Protocol Using Detergents to Permeabilize Cells
- Preparing Samples for IHC/ICC Experiments
- Preventing Non-Specific Staining (Non-Specific Binding)
- Primary Antibody Selection & Optimization
- Propidium Iodide Cell Viability Flow Cytometry Protocol
- Protocol for Heat-Induced Epitope Retrieval (HIER)
- Protocol for Liperfluo
- Protocol for Making a 4% Formaldehyde Solution in PBS
- Protocol for VisUCyte™ HRP Polymer Detection Reagent
- Protocol for the Characterization of Human Th22 Cells
- Protocol for the Characterization of Human Th9 Cells
- Protocol for the Fluorescent ICC Staining of Cell Smears - Graphic
- Protocol for the Fluorescent ICC Staining of Cultured Cells on Coverslips - Graphic
- Protocol for the Preparation & Fixation of Cells on Coverslips
- Protocol for the Preparation and Chromogenic IHC Staining of Frozen Tissue Sections
- Protocol for the Preparation and Chromogenic IHC Staining of Frozen Tissue Sections - Graphic
- Protocol for the Preparation and Chromogenic IHC Staining of Paraffin-embedded Tissue Sections
- Protocol for the Preparation and Chromogenic IHC Staining of Paraffin-embedded Tissue Sections - Graphic
- Protocol for the Preparation and Fluorescent ICC Staining of Cells on Coverslips
- Protocol for the Preparation and Fluorescent ICC Staining of Non-adherent Cells
- Protocol for the Preparation and Fluorescent ICC Staining of Stem Cells on Coverslips
- Protocol for the Preparation and Fluorescent IHC Staining of Frozen Tissue Sections
- Protocol for the Preparation and Fluorescent IHC Staining of Paraffin-embedded Tissue Sections
- Protocol for the Preparation of Gelatin-coated Slides for Histological Tissue Sections
- Protocol for the Preparation of a Cell Smear for Non-adherent Cell ICC - Graphic
- Protocol: Annexin V and PI Staining by Flow Cytometry
- Protocol: Annexin V and PI Staining for Apoptosis by Flow Cytometry
- R&D Systems Quality Control Western Blot Protocol
- TUNEL and Active Caspase-3 Detection by IHC/ICC Protocol
- The Importance of IHC/ICC Controls
- Troubleshooting Guide: Fluorokine Flow Cytometry Kits
- Troubleshooting Guide: Immunohistochemistry
- Troubleshooting Guide: Western Blot Figures
- Western Blot Conditions
- Western Blot Protocol
- Western Blot Protocol for Cell Lysates
- Western Blot Troubleshooting
- Western Blot Troubleshooting Guide
- View all Protocols, Troubleshooting, Illustrated assays and Webinars
Loading...
Associated Pathways


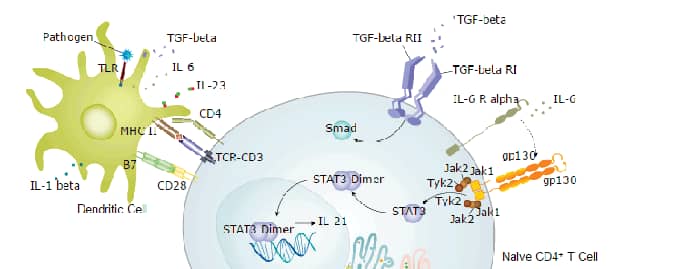
IL-21 Signaling Pathways and their Primary Biological Effects in Different Immune Cell Types
 Mesenchymal Stem Cell Differentiation Pathways & Lineage-specific Markers
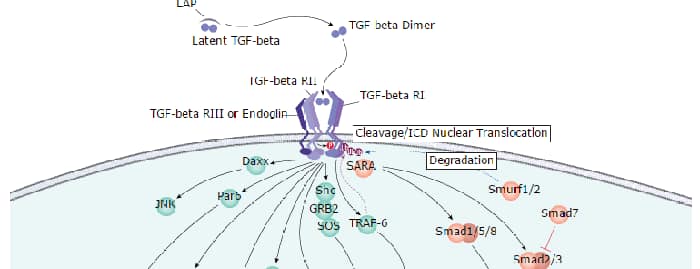
 TGF-beta Signaling Pathways
 Th17 Differentiation Pathway