Stem cell factor receptor (CD117, the gene product of the c-kit proto-oncogene) and its ligand, stem cell factor (also named c-kit ligand, mast cell growth factor), play essential roles in gametogenesis, melanogenesis and hematopoiesis. The human stem cell factor receptor cDNA encodes a 972 amino acid (aa) residue precursor membrane protein with a 25 aa residue signal peptide (experimentally determined), a 495 aa residue extracellular domain, a 23 aa residue transmembrane segment and a 429 aa residue cytoplasmic domain. Stem cell factor receptor is a member of the type III subfamily of receptor tyrosine kinases (RTK) that also includes the receptors for M-CSF, Flt-3, PDGF, and VEGF. All class III RTKs are characterized by the presence of five immunoglobulin-like domains in their extracellular region and a split kinase domain in their intracellular region. SCF binding induces receptor homodimerization and signal transduction. SCF receptor is expressed in hematopoietic progenitor cells, normal B- and T-lymphocyte progenitor cells, mast cells, germ cells, melanocytes, neurons, glial cells, placenta, kidney, lung, and gut. In addition, SCF receptor expression has also been reported in a number of human tumor cell lines. SCF receptor can be proteolytically cleaved from the cell surface and high levels of soluble SCF receptor has been detected in cell conditioned medium and human plasma. Recombinant soluble SCF receptor binds SCF with high affinity and is a potent SCF antagonist.

Key Product Details
Species Reactivity
Validated:
Human
Cited:
Human, Mouse
Applications
Validated:
Immunohistochemistry, Western Blot, Neutralization, Flow Cytometry, Simple Western, CyTOF-ready
Cited:
Immunohistochemistry, Immunohistochemistry-Paraffin, Western Blot, Neutralization, Immunocytochemistry
Label
Unconjugated
Antibody Source
Polyclonal Goat IgG
Loading...
Product Specifications
Immunogen
S. frugiperda insect ovarian cell line Sf 21-derived recombinant human CD117/c-kit
Gln26-Thr520
Accession # P10721
Gln26-Thr520
Accession # P10721
Specificity
Detects human and mouse CD117/c-kit in direct ELISAs and Western blots. In Western blots, approximately 2% cross-reactivity with recombinant human PDGF sR alpha is observed.
Clonality
Polyclonal
Host
Goat
Isotype
IgG
Endotoxin Level
<0.10 EU per 1 μg of the antibody by the LAL method.
Scientific Data Images for Human CD117/c-kit Antibody
Cell Proliferation Induced by SCF/c‑kit Ligand and Neutralization by Human CD117/c-kit Antibody.
Recombinant Human SCF/c-kit Ligand (Catalog # 255-SC) induces cell proliferation in the TF-1 human erythroleukemic cell line in a dose-dependent manner (orange line), as measured by the Resazurin (Catalog # AR002). Under these conditions, proliferation elicited by SCF/c-kit Ligand is neutralized (green line) by increasing concentrations of Goat Anti-Human CD117/c-kit Antigen Affinity-purified Polyclonal Antibody (Catalog # AF332). The ND50 is typically 0.06-0.36 µg/mL in the presence of 20 ng/mL of Recombinant Human SCF/c-kit Ligand.
CD117/c-kit in Human Brain.
CD117/c-kit was detected in immersion fixed paraffin-embedded sections of human brain (hippocampus) using Goat Anti-Human CD117/c-kit Antigen Affinity-purified Polyclonal Antibody (Catalog # AF332) at 15 µg/mL overnight at 4 °C. Before incubation with the primary antibody, tissue was subjected to heat-induced epitope retrieval using Antigen Retrieval Reagent-Basic (Catalog # CTS013). Tissue was stained using the Anti-Goat HRP-DAB Cell & Tissue Staining Kit (brown; Catalog # CTS008) and counterstained with hematoxylin (blue). Specific staining was localized to neurons. View our protocol for Chromogenic IHC Staining of Paraffin-embedded Tissue Sections.
Detection of Human CD117/c-kit by Western Blot.
Western blot shows lysates of MO7e human megakaryocytic leukemic cell line. PVDF membrane was probed with 0.1 µg/mL of Goat Anti-Human CD117/c-kit Antigen Affinity-purified Polyclonal Antibody (Catalog # AF332) followed by HRP-conjugated Anti-Goat IgG Secondary Antibody (Catalog # HAF017). A specific band was detected for CD117/c-kit at approximately 150 kDa (as indicated). This experiment was conducted under reducing conditions and using Immunoblot Buffer Group 1.
Detection of Human CD117/c-kit by Simple WesternTM.
Simple Western lane view shows lysates of MO7e human megakaryocytic leukemic cell line, loaded at 0.2 mg/mL. A specific band was detected for CD117/c-kit at approximately 172 kDa (as indicated) using 5 µg/mL of Goat Anti-Human CD117/c-kit Antigen Affinity-purified Polyclonal Antibody (Catalog # AF332) followed by 1:50 dilution of HRP-conjugated Anti-Goat IgG Secondary Antibody (Catalog # HAF109). This experiment was conducted under reducing conditions and using the 12-230 kDa separation system.
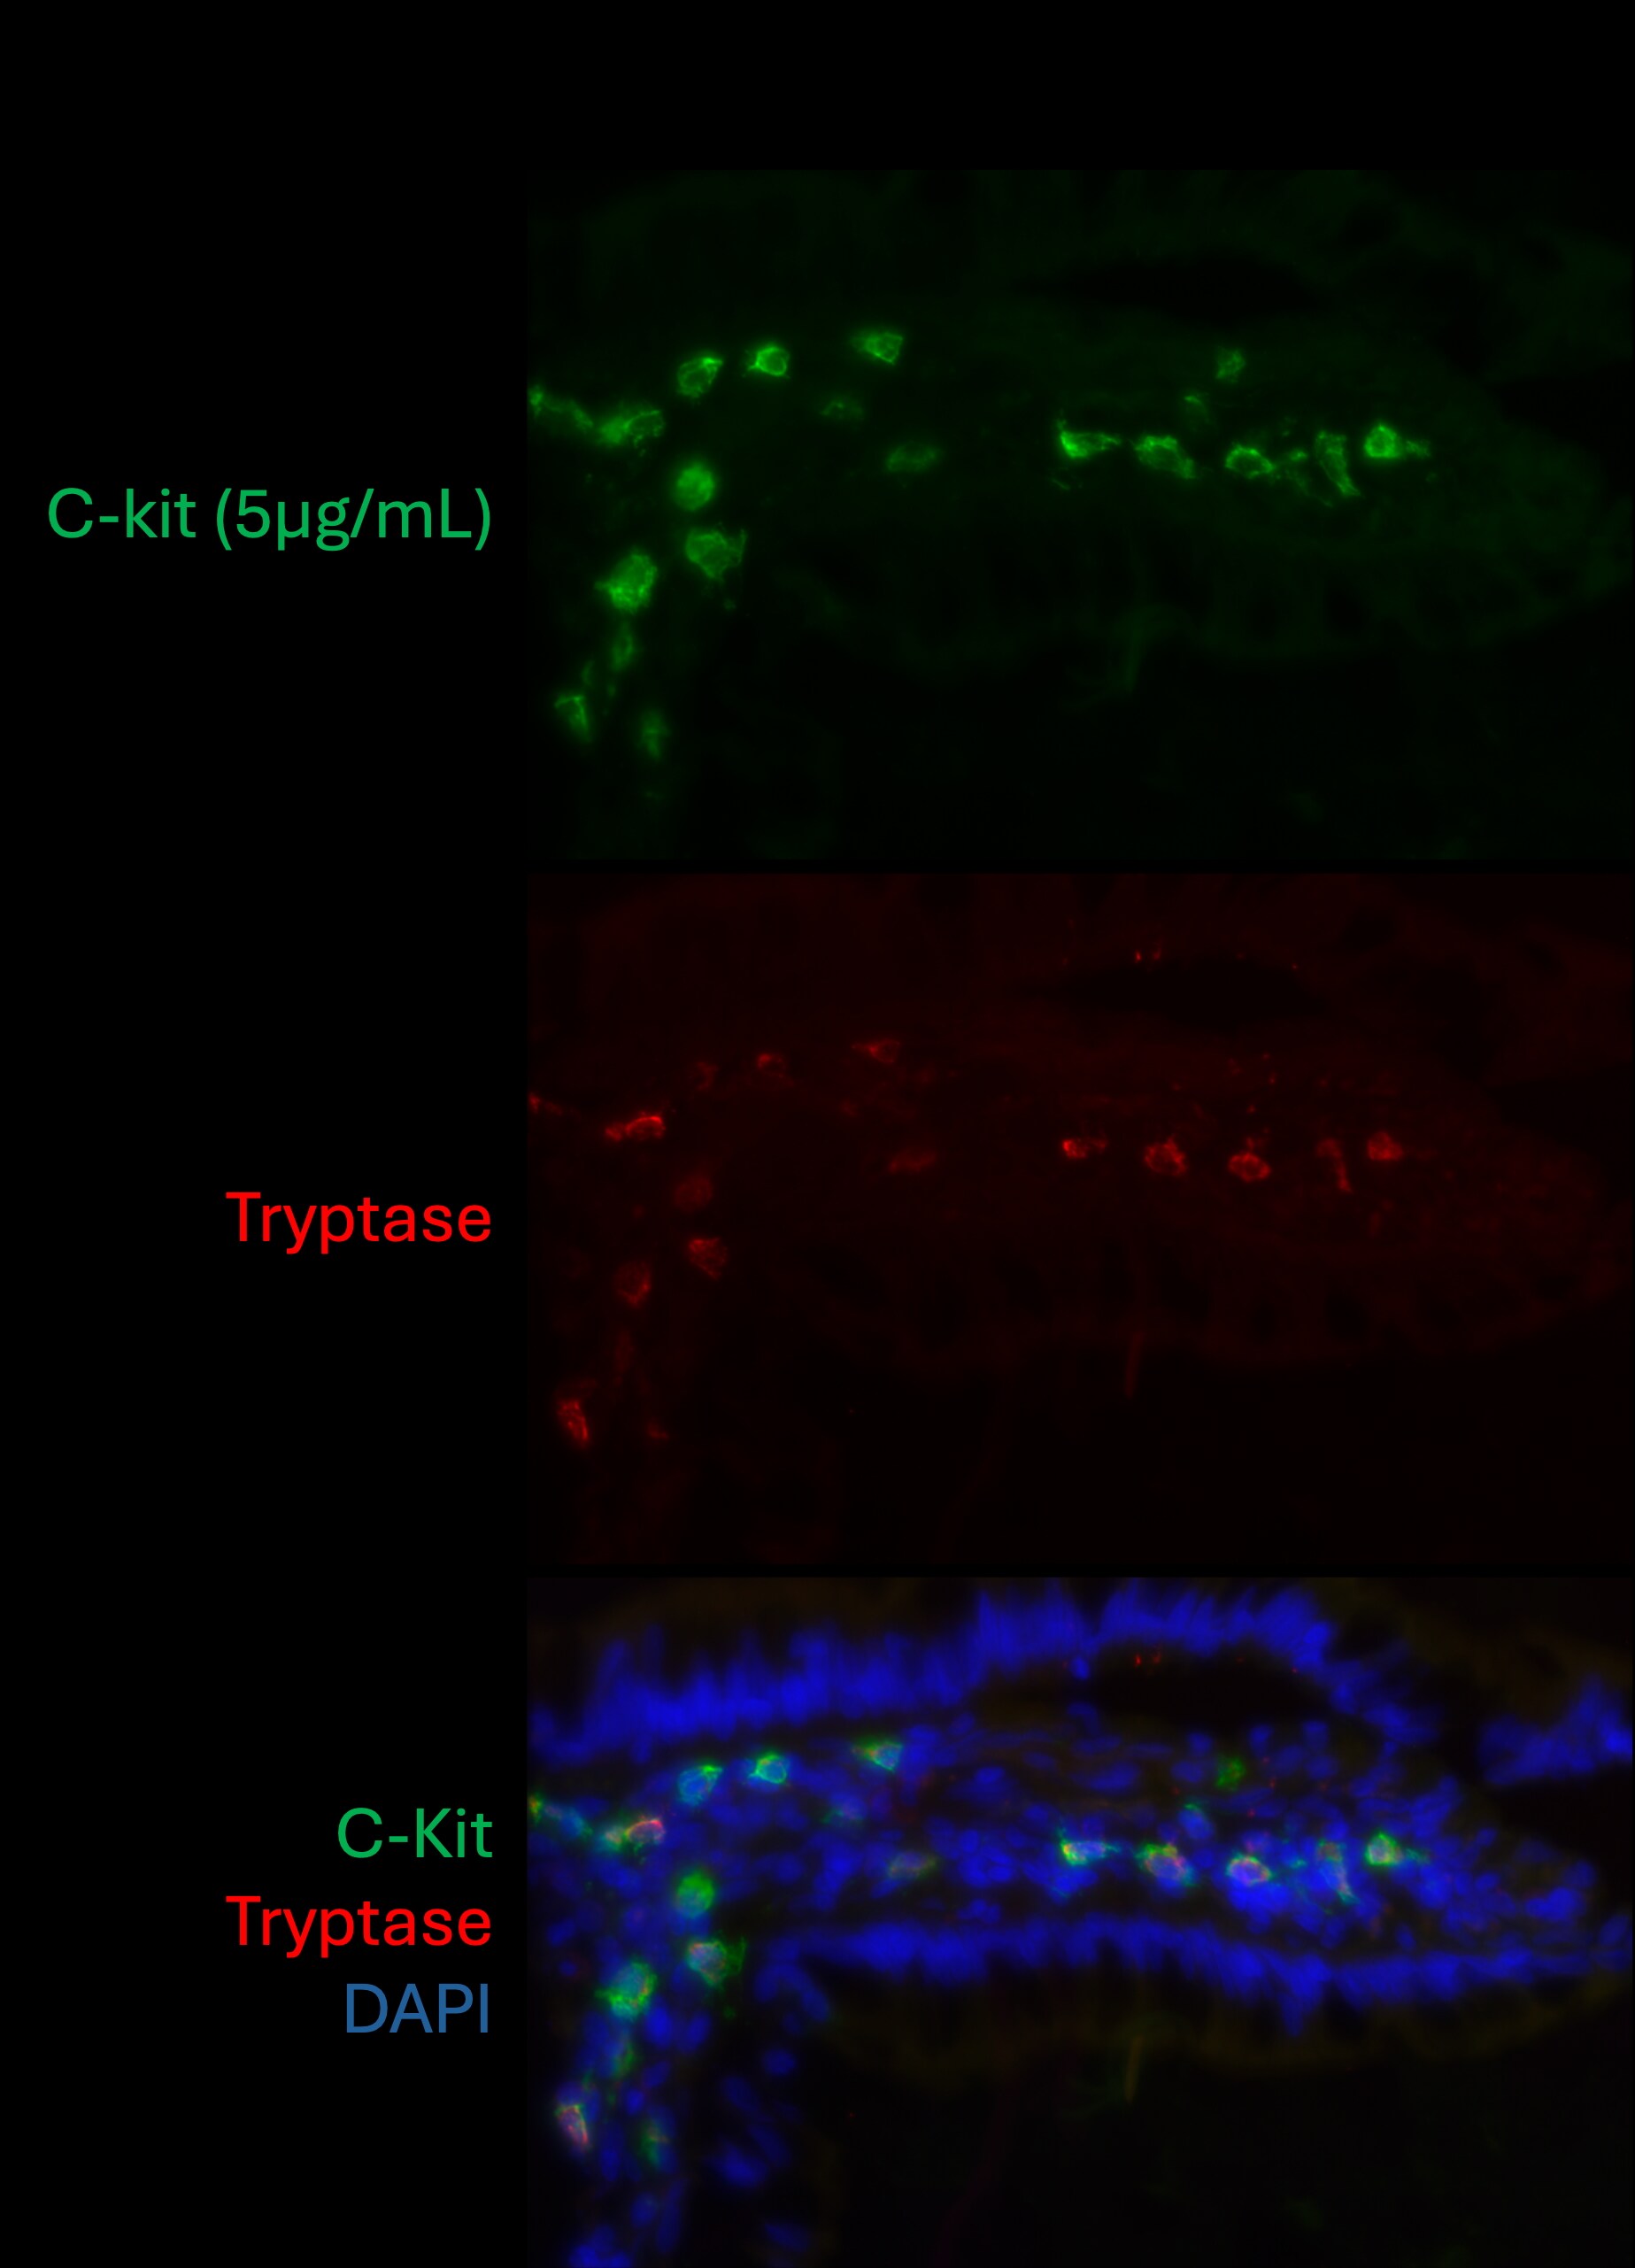
CD117/c-kit in Human Small Intestine.
Tissue fixed in 4% PFA for 1 hour, and cryoprotected in 30% sucrose for 24 hours. Tissue frozen in OCT compound and cut at 10um thickness. Blocked for 1 hour in protein block and stained at 5 ug/mL. Image from a verified customer review.
Detection of CD117/c-kit by Western Blot
The protein loading of KIT‐EVs shifts among vesicle subtypes after cell treatment with SMase inhibitors. (A) Viability assessment of HMC‐1.1 cells at the end of the 16 h treatment with DMSO (vehicle control), 10 μM GW4869 (n‐SMase inhibitor) or 10 μM amitriptyline (a‐SMase inhibitor) to control for potential drug‐induced cell death. Data are presented as mean ± S.D. from three independent experiments, normalized to the control. (B, C) EVs released by control‐ or inhibitor‐treated HMC‐1.1 cells were pelleted as P15 (B) or P120 (C) EVs and evaluated by nanoparticle tracking. The sum of P15 (B) or P120 (C) EVs (ranging from 0 to 250 nm) released under each condition was plotted. Representative data are shown as mean ± S.D. from five repetitions. Ns, not significant; **, 0.0011; ****p < 0.0001 (two‐tailed, unpaired Student t‐test). (D) Total lysates (30 μg) of DMSO‐ or inhibitor‐treated cells were analyzed by immunoblotting with the indicated antibodies. (E,F) KIT‐EVs were captured with an antibody against N‐terminal KIT from P15 (3.4 × 10⁸ EVs) (E) or P120 (2.6 × 10⁹ EVs) (F) vesicles released by control, GW4869‐ or amitriptyline‐treated cells. Total KIT‐EV lysates were evaluated by Western blotting; representative blots are shown. (G,H) Signal intensities of proteins in KIT‐EVs (E,F) were quantified and normalized to the DMSO control. Up‐ or down‐regulation (indicated by arrows) of protein content in P15 and P120 KIT‐EVs in response to GW4869 (G) or amitriptyline (H) is displayed in Volcano graphs (n = 3). The q‐value is the FDR‐adjusted p‐value, and the dashed line indicates the significance threshold. In D, E and F, dashed lines imply lanes from the same blot that were not loaded contiguously Image collected and cropped by CiteAb from the following open publication (https://pubmed.ncbi.nlm.nih.gov/36239715), licensed under a CC-BY license. Not internally tested by R&D Systems.
Detection of CD117/c-kit by Western Blot
HMC‐1‐derived EVs contain KIT and canonical EV protein markers. (A, B) Detection of canonical EV marker (A) and mast cell marker proteins (B) as well as calreticulin as an exclusion marker in HMC‐1.1 and HMC‐1.2 cells and secreted EVs. 30 μg of protein of cell or EV lysates were separated by SDS‐PAGE, blotted and probed with the indicated antibodies. (C) HMC‐1.1‐derived EVs were separated from soluble protein by size exclusion chromatography (SEC; qEVoriginal70) and eluted as pooled fractions F7‐F11, followed by filter concentration. Cell (30 μg) and EV lysates (15 μg) were analyzed by immunoblotting with the indicated antibodies. The dashed line indicates the samples were run on the same blot, but not in contiguous lanes. (D) A representative graph showing the concentration and size measurement of SEC‐isolated EVs (C) by nanoparticle tracking. The average profile of five workflow repetitions is displayed. (E) Workflow of the immunocapture of EV subpopulations. EVs are bulk‐isolated from pre‐cleared cell culture media by PEG‐precipitation and incubated with antibody‐conjugated beads allowing for immunocapture of specific EV subpopulations. (F) Representative Western blot of CD9‐, CD81‐ and CD63‐immunocaptured EVs. Each bead capture was performed from an equal number of HMC‐1.1‐derived EVs (1.9 × 10¹⁰ EVs). Unconjugated beads served as a negative control. The presence of canonical EV protein markers as well as KIT in the EV subpopulations were determined by immunoblotting. *, signal from previous probing with a flotillin‐1 antibody Image collected and cropped by CiteAb from the following open publication (https://pubmed.ncbi.nlm.nih.gov/36239715), licensed under a CC-BY license. Not internally tested by R&D Systems.
Detection of CD117/c-kit by Western Blot
KIT‐containing EVs can be isolated by immunocapture. (B) Representative immunoblots showing the canonical EV marker content of KIT‐EVs captured from HMC‐1.1‐derived EVs that isolated by size exclusion chromatography (SEC). Three different antibodies directed against N‐t, C‐t (left panel) or full‐length (fl) KIT protein (right panel) used for immunocapturing of KIT‐containing EVs. Each pulldown was performed from vesicles secreted by 20 × 106 & collected in SEC fractions seven to nine. Unbound EVs in the flow‐through (FT) pelleted by ultracentrifugation (UC) to demonstrate the capture efficiency. Beads conjugated to isotype control antibodies served as negative controls. Cell lysates (30 μg) included. g, goat; rb, rabbit; m, mouse. Dashed lines imply lanes from the same blot that not loaded contiguously. Image collected & cropped by CiteAb from the following open publication (https://pubmed.ncbi.nlm.nih.gov/36239715), licensed under a CC-BY license. Not internally tested by R&D Systems.
Detection of CD117/c-kit by Western Blot
HMC‐1‐derived EVs contain KIT and canonical EV protein markers. (A, B) Detection of canonical EV marker (A) and mast cell marker proteins (B) as well as calreticulin as an exclusion marker in HMC‐1.1 and HMC‐1.2 cells and secreted EVs. 30 μg of protein of cell or EV lysates were separated by SDS‐PAGE, blotted and probed with the indicated antibodies. (C) HMC‐1.1‐derived EVs were separated from soluble protein by size exclusion chromatography (SEC; qEVoriginal70) and eluted as pooled fractions F7‐F11, followed by filter concentration. Cell (30 μg) and EV lysates (15 μg) were analyzed by immunoblotting with the indicated antibodies. The dashed line indicates the samples were run on the same blot, but not in contiguous lanes. (D) A representative graph showing the concentration and size measurement of SEC‐isolated EVs (C) by nanoparticle tracking. The average profile of five workflow repetitions is displayed. (E) Workflow of the immunocapture of EV subpopulations. EVs are bulk‐isolated from pre‐cleared cell culture media by PEG‐precipitation and incubated with antibody‐conjugated beads allowing for immunocapture of specific EV subpopulations. (F) Representative Western blot of CD9‐, CD81‐ and CD63‐immunocaptured EVs. Each bead capture was performed from an equal number of HMC‐1.1‐derived EVs (1.9 × 10¹⁰ EVs). Unconjugated beads served as a negative control. The presence of canonical EV protein markers as well as KIT in the EV subpopulations were determined by immunoblotting. *, signal from previous probing with a flotillin‐1 antibody Image collected and cropped by CiteAb from the following open publication (https://pubmed.ncbi.nlm.nih.gov/36239715), licensed under a CC-BY license. Not internally tested by R&D Systems.
Detection of CD117/c-kit by Western Blot
KIT‐EVs are released as heterogeneous subpopulations with different physical properties. (A) Cell culture supernatant was subjected to differential ultracentrifugation to obtain P15 and P120 EV pellets, as illustrated. Where indicated, P15 and P120 EVs were further separated by iodixanol density gradients. Vesicles from each density fraction were pelleted and analyzed. (B) P15 and P120 EVs obtained from HMC‐1.1 cells were analyzed by nanoparticle tracking. Representative concentration and size profiles averaged from five workflow repetitions are depicted. The averaged percentage (%) of different size ranges within the P15 or P120 population is shown on top (bar chart). (C) Representative Western blot of HMC‐1.1 cell, P15 and P120 EV lysates (30 μg) probed with the indicated antibodies. (D, E) HMC‐1.1‐derived P15 (D) or P120 (E) EV pellets were separated by density gradients and the vesicles from each fraction (F1‐F10) were analyzed by nanoparticle tracking for concentration (particles/ml), shown as box plots, and size (represented as average mode, nm), shown as a line graph. Data in the box plots represent the median with the whiskers indicating minimum and maximum values; data in the line graph are represented as mean ± S.D. from five repetitions. Representative results are shown. (F, G) Representative immunoblots showing the presence of KIT and annexin A1 in P15 EV fractions (F) and KIT and CD81 in P120 EV fractions (G). The density (g/ml) of each fraction is indicated below Image collected and cropped by CiteAb from the following open publication (https://pubmed.ncbi.nlm.nih.gov/36239715), licensed under a CC-BY license. Not internally tested by R&D Systems.
Detection of CD117/c-kit by Western Blot
The protein loading of KIT‐EVs shifts among vesicle subtypes after cell treatment with SMase inhibitors. (A) Viability assessment of HMC‐1.1 cells at the end of the 16 h treatment with DMSO (vehicle control), 10 μM GW4869 (n‐SMase inhibitor) or 10 μM amitriptyline (a‐SMase inhibitor) to control for potential drug‐induced cell death. Data are presented as mean ± S.D. from three independent experiments, normalized to the control. (B, C) EVs released by control‐ or inhibitor‐treated HMC‐1.1 cells were pelleted as P15 (B) or P120 (C) EVs and evaluated by nanoparticle tracking. The sum of P15 (B) or P120 (C) EVs (ranging from 0 to 250 nm) released under each condition was plotted. Representative data are shown as mean ± S.D. from five repetitions. Ns, not significant; **, 0.0011; ****p < 0.0001 (two‐tailed, unpaired Student t‐test). (D) Total lysates (30 μg) of DMSO‐ or inhibitor‐treated cells were analyzed by immunoblotting with the indicated antibodies. (E,F) KIT‐EVs were captured with an antibody against N‐terminal KIT from P15 (3.4 × 10⁸ EVs) (E) or P120 (2.6 × 10⁹ EVs) (F) vesicles released by control, GW4869‐ or amitriptyline‐treated cells. Total KIT‐EV lysates were evaluated by Western blotting; representative blots are shown. (G,H) Signal intensities of proteins in KIT‐EVs (E,F) were quantified and normalized to the DMSO control. Up‐ or down‐regulation (indicated by arrows) of protein content in P15 and P120 KIT‐EVs in response to GW4869 (G) or amitriptyline (H) is displayed in Volcano graphs (n = 3). The q‐value is the FDR‐adjusted p‐value, and the dashed line indicates the significance threshold. In D, E and F, dashed lines imply lanes from the same blot that were not loaded contiguously Image collected and cropped by CiteAb from the following open publication (https://pubmed.ncbi.nlm.nih.gov/36239715), licensed under a CC-BY license. Not internally tested by R&D Systems.
Detection of CD117/c-kit by Western Blot
KIT‐EVs are released as heterogeneous subpopulations with different physical properties. (A) Cell culture supernatant was subjected to differential ultracentrifugation to obtain P15 and P120 EV pellets, as illustrated. Where indicated, P15 and P120 EVs were further separated by iodixanol density gradients. Vesicles from each density fraction were pelleted and analyzed. (B) P15 and P120 EVs obtained from HMC‐1.1 cells were analyzed by nanoparticle tracking. Representative concentration and size profiles averaged from five workflow repetitions are depicted. The averaged percentage (%) of different size ranges within the P15 or P120 population is shown on top (bar chart). (C) Representative Western blot of HMC‐1.1 cell, P15 and P120 EV lysates (30 μg) probed with the indicated antibodies. (D, E) HMC‐1.1‐derived P15 (D) or P120 (E) EV pellets were separated by density gradients and the vesicles from each fraction (F1‐F10) were analyzed by nanoparticle tracking for concentration (particles/ml), shown as box plots, and size (represented as average mode, nm), shown as a line graph. Data in the box plots represent the median with the whiskers indicating minimum and maximum values; data in the line graph are represented as mean ± S.D. from five repetitions. Representative results are shown. (F, G) Representative immunoblots showing the presence of KIT and annexin A1 in P15 EV fractions (F) and KIT and CD81 in P120 EV fractions (G). The density (g/ml) of each fraction is indicated below Image collected and cropped by CiteAb from the following open publication (https://pubmed.ncbi.nlm.nih.gov/36239715), licensed under a CC-BY license. Not internally tested by R&D Systems.
Detection of CD117/c-kit by Western Blot
KIT‐EV immunocapture of LAD2 huMC EVs and KIT‐EV recovery from spiked plasma. (A) Cytokine‐starved LAD2 huMCs were treated or not with stem cell factor (SCF; 100 ng/ml) for 2 h in HEPES‐BSA buffer. Cell lysates (30 μg) were analyzed by immunoblotting with the indicated antibodies. (B) EVs released into the supernatant by 18 × 106 LAD2 cells treated or not with SCF for 2 h were sedimented by differential ultracentrifugation into P15 and P120 EVs. KIT‐EV immunocapture was performed (KIT antibody AF332) from all sedimented LAD2 P15 and P120 EVs. The total bead elution was loaded and analyzed by Western blotting with the indicated antibodies. Input EV lysates (5 × 10⁸) were included. Representative blots are shown. (C) HMC‐1.1 cell line‐derived EVs (1.2 × 10¹⁰ EVs) were incubated or not in human normal plasma and captured with a KIT antibody (AF332) or by CD9 antibody‐conjugated beads. A goat HA antibody served as a negative isotype control. Representative blots are shown. sKIT, soluble KIT that is present in plasma. Dashed lines imply lanes from the same blot that were not loaded contiguously Image collected and cropped by CiteAb from the following open publication (https://pubmed.ncbi.nlm.nih.gov/36239715), licensed under a CC-BY license. Not internally tested by R&D Systems.
Detection of CD117/c-kit by Western Blot
HMC‐1‐derived EVs contain KIT and canonical EV protein markers. (A, B) Detection of canonical EV marker (A) and mast cell marker proteins (B) as well as calreticulin as an exclusion marker in HMC‐1.1 and HMC‐1.2 cells and secreted EVs. 30 μg of protein of cell or EV lysates were separated by SDS‐PAGE, blotted and probed with the indicated antibodies. (C) HMC‐1.1‐derived EVs were separated from soluble protein by size exclusion chromatography (SEC; qEVoriginal70) and eluted as pooled fractions F7‐F11, followed by filter concentration. Cell (30 μg) and EV lysates (15 μg) were analyzed by immunoblotting with the indicated antibodies. The dashed line indicates the samples were run on the same blot, but not in contiguous lanes. (D) A representative graph showing the concentration and size measurement of SEC‐isolated EVs (C) by nanoparticle tracking. The average profile of five workflow repetitions is displayed. (E) Workflow of the immunocapture of EV subpopulations. EVs are bulk‐isolated from pre‐cleared cell culture media by PEG‐precipitation and incubated with antibody‐conjugated beads allowing for immunocapture of specific EV subpopulations. (F) Representative Western blot of CD9‐, CD81‐ and CD63‐immunocaptured EVs. Each bead capture was performed from an equal number of HMC‐1.1‐derived EVs (1.9 × 10¹⁰ EVs). Unconjugated beads served as a negative control. The presence of canonical EV protein markers as well as KIT in the EV subpopulations were determined by immunoblotting. *, signal from previous probing with a flotillin‐1 antibody Image collected and cropped by CiteAb from the following open publication (https://pubmed.ncbi.nlm.nih.gov/36239715), licensed under a CC-BY license. Not internally tested by R&D Systems.
Detection of CD117/c-kit by Western Blot
KIT‐containing EVs can be isolated by immunocapture. (A) Illustration of the predicted topology of the receptor KIT in an EV. KIT is embedded in the EV membrane by its transmembrane domain (TMD) with the N‐terminal (N‐t) ligand‐binding domain exposed to the extravesicular environment, while the C‐terminal (C‐t) protein domain is directed into the EV lumen. Image collected & cropped by CiteAb from the following open publication (https://pubmed.ncbi.nlm.nih.gov/36239715), licensed under a CC-BY license. Not internally tested by R&D Systems.
Detection of CD117/c-kit by Western Blot
KIT‐EV immunocapture of LAD2 huMC EVs and KIT‐EV recovery from spiked plasma. (A) Cytokine‐starved LAD2 huMCs were treated or not with stem cell factor (SCF; 100 ng/ml) for 2 h in HEPES‐BSA buffer. Cell lysates (30 μg) were analyzed by immunoblotting with the indicated antibodies. (B) EVs released into the supernatant by 18 × 106 LAD2 cells treated or not with SCF for 2 h were sedimented by differential ultracentrifugation into P15 and P120 EVs. KIT‐EV immunocapture was performed (KIT antibody AF332) from all sedimented LAD2 P15 and P120 EVs. The total bead elution was loaded and analyzed by Western blotting with the indicated antibodies. Input EV lysates (5 × 10⁸) were included. Representative blots are shown. (C) HMC‐1.1 cell line‐derived EVs (1.2 × 10¹⁰ EVs) were incubated or not in human normal plasma and captured with a KIT antibody (AF332) or by CD9 antibody‐conjugated beads. A goat HA antibody served as a negative isotype control. Representative blots are shown. sKIT, soluble KIT that is present in plasma. Dashed lines imply lanes from the same blot that were not loaded contiguously Image collected and cropped by CiteAb from the following open publication (https://pubmed.ncbi.nlm.nih.gov/36239715), licensed under a CC-BY license. Not internally tested by R&D Systems.
Detection of CD117/c-kit by Western Blot
KIT‐containing EVs can be isolated by immunocapture. (A) Illustration of the predicted topology of the receptor KIT in an EV. KIT is embedded in the EV membrane by its transmembrane domain (TMD) with the N‐terminal (N‐t) ligand‐binding domain exposed to the extravesicular environment, while the C‐terminal (C‐t) protein domain is directed into the EV lumen. Image collected & cropped by CiteAb from the following open publication (https://pubmed.ncbi.nlm.nih.gov/36239715), licensed under a CC-BY license. Not internally tested by R&D Systems.
Detection of CD117/c-kit by Western Blot
KIT‐EVs are released as heterogeneous subpopulations with different physical properties. (A) Cell culture supernatant was subjected to differential ultracentrifugation to obtain P15 and P120 EV pellets, as illustrated. Where indicated, P15 and P120 EVs were further separated by iodixanol density gradients. Vesicles from each density fraction were pelleted and analyzed. (B) P15 and P120 EVs obtained from HMC‐1.1 cells were analyzed by nanoparticle tracking. Representative concentration and size profiles averaged from five workflow repetitions are depicted. The averaged percentage (%) of different size ranges within the P15 or P120 population is shown on top (bar chart). (C) Representative Western blot of HMC‐1.1 cell, P15 and P120 EV lysates (30 μg) probed with the indicated antibodies. (D, E) HMC‐1.1‐derived P15 (D) or P120 (E) EV pellets were separated by density gradients and the vesicles from each fraction (F1‐F10) were analyzed by nanoparticle tracking for concentration (particles/ml), shown as box plots, and size (represented as average mode, nm), shown as a line graph. Data in the box plots represent the median with the whiskers indicating minimum and maximum values; data in the line graph are represented as mean ± S.D. from five repetitions. Representative results are shown. (F, G) Representative immunoblots showing the presence of KIT and annexin A1 in P15 EV fractions (F) and KIT and CD81 in P120 EV fractions (G). The density (g/ml) of each fraction is indicated below Image collected and cropped by CiteAb from the following open publication (https://pubmed.ncbi.nlm.nih.gov/36239715), licensed under a CC-BY license. Not internally tested by R&D Systems.
Detection of CD117/c-kit by Western Blot
KIT‐EV immunocapture of LAD2 huMC EVs and KIT‐EV recovery from spiked plasma. (A) Cytokine‐starved LAD2 huMCs were treated or not with stem cell factor (SCF; 100 ng/ml) for 2 h in HEPES‐BSA buffer. Cell lysates (30 μg) were analyzed by immunoblotting with the indicated antibodies. (B) EVs released into the supernatant by 18 × 106 LAD2 cells treated or not with SCF for 2 h were sedimented by differential ultracentrifugation into P15 and P120 EVs. KIT‐EV immunocapture was performed (KIT antibody AF332) from all sedimented LAD2 P15 and P120 EVs. The total bead elution was loaded and analyzed by Western blotting with the indicated antibodies. Input EV lysates (5 × 10⁸) were included. Representative blots are shown. (C) HMC‐1.1 cell line‐derived EVs (1.2 × 10¹⁰ EVs) were incubated or not in human normal plasma and captured with a KIT antibody (AF332) or by CD9 antibody‐conjugated beads. A goat HA antibody served as a negative isotype control. Representative blots are shown. sKIT, soluble KIT that is present in plasma. Dashed lines imply lanes from the same blot that were not loaded contiguously Image collected and cropped by CiteAb from the following open publication (https://pubmed.ncbi.nlm.nih.gov/36239715), licensed under a CC-BY license. Not internally tested by R&D Systems.
Detection of CD117/c-kit by Western Blot
The protein loading of KIT‐EVs shifts among vesicle subtypes after cell treatment with SMase inhibitors. (A) Viability assessment of HMC‐1.1 cells at the end of the 16 h treatment with DMSO (vehicle control), 10 μM GW4869 (n‐SMase inhibitor) or 10 μM amitriptyline (a‐SMase inhibitor) to control for potential drug‐induced cell death. Data are presented as mean ± S.D. from three independent experiments, normalized to the control. (B, C) EVs released by control‐ or inhibitor‐treated HMC‐1.1 cells were pelleted as P15 (B) or P120 (C) EVs and evaluated by nanoparticle tracking. The sum of P15 (B) or P120 (C) EVs (ranging from 0 to 250 nm) released under each condition was plotted. Representative data are shown as mean ± S.D. from five repetitions. Ns, not significant; **, 0.0011; ****p < 0.0001 (two‐tailed, unpaired Student t‐test). (D) Total lysates (30 μg) of DMSO‐ or inhibitor‐treated cells were analyzed by immunoblotting with the indicated antibodies. (E,F) KIT‐EVs were captured with an antibody against N‐terminal KIT from P15 (3.4 × 10⁸ EVs) (E) or P120 (2.6 × 10⁹ EVs) (F) vesicles released by control, GW4869‐ or amitriptyline‐treated cells. Total KIT‐EV lysates were evaluated by Western blotting; representative blots are shown. (G,H) Signal intensities of proteins in KIT‐EVs (E,F) were quantified and normalized to the DMSO control. Up‐ or down‐regulation (indicated by arrows) of protein content in P15 and P120 KIT‐EVs in response to GW4869 (G) or amitriptyline (H) is displayed in Volcano graphs (n = 3). The q‐value is the FDR‐adjusted p‐value, and the dashed line indicates the significance threshold. In D, E and F, dashed lines imply lanes from the same blot that were not loaded contiguously Image collected and cropped by CiteAb from the following open publication (https://pubmed.ncbi.nlm.nih.gov/36239715), licensed under a CC-BY license. Not internally tested by R&D Systems.
Detection of CD117/c-kit by Western Blot
KIT‐EVs are released as heterogeneous subpopulations with different physical properties. (A) Cell culture supernatant was subjected to differential ultracentrifugation to obtain P15 and P120 EV pellets, as illustrated. Where indicated, P15 and P120 EVs were further separated by iodixanol density gradients. Vesicles from each density fraction were pelleted and analyzed. (B) P15 and P120 EVs obtained from HMC‐1.1 cells were analyzed by nanoparticle tracking. Representative concentration and size profiles averaged from five workflow repetitions are depicted. The averaged percentage (%) of different size ranges within the P15 or P120 population is shown on top (bar chart). (C) Representative Western blot of HMC‐1.1 cell, P15 and P120 EV lysates (30 μg) probed with the indicated antibodies. (D, E) HMC‐1.1‐derived P15 (D) or P120 (E) EV pellets were separated by density gradients and the vesicles from each fraction (F1‐F10) were analyzed by nanoparticle tracking for concentration (particles/ml), shown as box plots, and size (represented as average mode, nm), shown as a line graph. Data in the box plots represent the median with the whiskers indicating minimum and maximum values; data in the line graph are represented as mean ± S.D. from five repetitions. Representative results are shown. (F, G) Representative immunoblots showing the presence of KIT and annexin A1 in P15 EV fractions (F) and KIT and CD81 in P120 EV fractions (G). The density (g/ml) of each fraction is indicated below Image collected and cropped by CiteAb from the following open publication (https://pubmed.ncbi.nlm.nih.gov/36239715), licensed under a CC-BY license. Not internally tested by R&D Systems.
Detection of CD117/c-kit by Western Blot
The protein loading of KIT‐EVs shifts among vesicle subtypes after cell treatment with SMase inhibitors. (A) Viability assessment of HMC‐1.1 cells at the end of the 16 h treatment with DMSO (vehicle control), 10 μM GW4869 (n‐SMase inhibitor) or 10 μM amitriptyline (a‐SMase inhibitor) to control for potential drug‐induced cell death. Data are presented as mean ± S.D. from three independent experiments, normalized to the control. (B, C) EVs released by control‐ or inhibitor‐treated HMC‐1.1 cells were pelleted as P15 (B) or P120 (C) EVs and evaluated by nanoparticle tracking. The sum of P15 (B) or P120 (C) EVs (ranging from 0 to 250 nm) released under each condition was plotted. Representative data are shown as mean ± S.D. from five repetitions. Ns, not significant; **, 0.0011; ****p < 0.0001 (two‐tailed, unpaired Student t‐test). (D) Total lysates (30 μg) of DMSO‐ or inhibitor‐treated cells were analyzed by immunoblotting with the indicated antibodies. (E,F) KIT‐EVs were captured with an antibody against N‐terminal KIT from P15 (3.4 × 10⁸ EVs) (E) or P120 (2.6 × 10⁹ EVs) (F) vesicles released by control, GW4869‐ or amitriptyline‐treated cells. Total KIT‐EV lysates were evaluated by Western blotting; representative blots are shown. (G,H) Signal intensities of proteins in KIT‐EVs (E,F) were quantified and normalized to the DMSO control. Up‐ or down‐regulation (indicated by arrows) of protein content in P15 and P120 KIT‐EVs in response to GW4869 (G) or amitriptyline (H) is displayed in Volcano graphs (n = 3). The q‐value is the FDR‐adjusted p‐value, and the dashed line indicates the significance threshold. In D, E and F, dashed lines imply lanes from the same blot that were not loaded contiguously Image collected and cropped by CiteAb from the following open publication (https://pubmed.ncbi.nlm.nih.gov/36239715), licensed under a CC-BY license. Not internally tested by R&D Systems.
Detection of CD117/c-kit by Western Blot
KIT‐containing EVs can be isolated by immunocapture. (B) Representative immunoblots showing the canonical EV marker content of KIT‐EVs captured from HMC‐1.1‐derived EVs that isolated by size exclusion chromatography (SEC). Three different antibodies directed against N‐t, C‐t (left panel) or full‐length (fl) KIT protein (right panel) used for immunocapturing of KIT‐containing EVs. Each pulldown was performed from vesicles secreted by 20 × 106 & collected in SEC fractions seven to nine. Unbound EVs in the flow‐through (FT) pelleted by ultracentrifugation (UC) to demonstrate the capture efficiency. Beads conjugated to isotype control antibodies served as negative controls. Cell lysates (30 μg) included. g, goat; rb, rabbit; m, mouse. Dashed lines imply lanes from the same blot that not loaded contiguously. Image collected & cropped by CiteAb from the following open publication (https://pubmed.ncbi.nlm.nih.gov/36239715), licensed under a CC-BY license. Not internally tested by R&D Systems.
Detection of CD117/c-kit by Western Blot
The protein loading of KIT‐EVs shifts among vesicle subtypes after cell treatment with SMase inhibitors. (A) Viability assessment of HMC‐1.1 cells at the end of the 16 h treatment with DMSO (vehicle control), 10 μM GW4869 (n‐SMase inhibitor) or 10 μM amitriptyline (a‐SMase inhibitor) to control for potential drug‐induced cell death. Data are presented as mean ± S.D. from three independent experiments, normalized to the control. (B, C) EVs released by control‐ or inhibitor‐treated HMC‐1.1 cells were pelleted as P15 (B) or P120 (C) EVs and evaluated by nanoparticle tracking. The sum of P15 (B) or P120 (C) EVs (ranging from 0 to 250 nm) released under each condition was plotted. Representative data are shown as mean ± S.D. from five repetitions. Ns, not significant; **, 0.0011; ****p < 0.0001 (two‐tailed, unpaired Student t‐test). (D) Total lysates (30 μg) of DMSO‐ or inhibitor‐treated cells were analyzed by immunoblotting with the indicated antibodies. (E,F) KIT‐EVs were captured with an antibody against N‐terminal KIT from P15 (3.4 × 10⁸ EVs) (E) or P120 (2.6 × 10⁹ EVs) (F) vesicles released by control, GW4869‐ or amitriptyline‐treated cells. Total KIT‐EV lysates were evaluated by Western blotting; representative blots are shown. (G,H) Signal intensities of proteins in KIT‐EVs (E,F) were quantified and normalized to the DMSO control. Up‐ or down‐regulation (indicated by arrows) of protein content in P15 and P120 KIT‐EVs in response to GW4869 (G) or amitriptyline (H) is displayed in Volcano graphs (n = 3). The q‐value is the FDR‐adjusted p‐value, and the dashed line indicates the significance threshold. In D, E and F, dashed lines imply lanes from the same blot that were not loaded contiguously Image collected and cropped by CiteAb from the following open publication (https://pubmed.ncbi.nlm.nih.gov/36239715), licensed under a CC-BY license. Not internally tested by R&D Systems.
Detection of CD117/c-kit by Western Blot
KIT‐EV immunocapture of LAD2 huMC EVs and KIT‐EV recovery from spiked plasma. (A) Cytokine‐starved LAD2 huMCs were treated or not with stem cell factor (SCF; 100 ng/ml) for 2 h in HEPES‐BSA buffer. Cell lysates (30 μg) were analyzed by immunoblotting with the indicated antibodies. (B) EVs released into the supernatant by 18 × 106 LAD2 cells treated or not with SCF for 2 h were sedimented by differential ultracentrifugation into P15 and P120 EVs. KIT‐EV immunocapture was performed (KIT antibody AF332) from all sedimented LAD2 P15 and P120 EVs. The total bead elution was loaded and analyzed by Western blotting with the indicated antibodies. Input EV lysates (5 × 10⁸) were included. Representative blots are shown. (C) HMC‐1.1 cell line‐derived EVs (1.2 × 10¹⁰ EVs) were incubated or not in human normal plasma and captured with a KIT antibody (AF332) or by CD9 antibody‐conjugated beads. A goat HA antibody served as a negative isotype control. Representative blots are shown. sKIT, soluble KIT that is present in plasma. Dashed lines imply lanes from the same blot that were not loaded contiguously Image collected and cropped by CiteAb from the following open publication (https://pubmed.ncbi.nlm.nih.gov/36239715), licensed under a CC-BY license. Not internally tested by R&D Systems.
Detection of CD117/c-kit by Western Blot
The protein loading of KIT‐EVs shifts among vesicle subtypes after cell treatment with SMase inhibitors. (A) Viability assessment of HMC‐1.1 cells at the end of the 16 h treatment with DMSO (vehicle control), 10 μM GW4869 (n‐SMase inhibitor) or 10 μM amitriptyline (a‐SMase inhibitor) to control for potential drug‐induced cell death. Data are presented as mean ± S.D. from three independent experiments, normalized to the control. (B, C) EVs released by control‐ or inhibitor‐treated HMC‐1.1 cells were pelleted as P15 (B) or P120 (C) EVs and evaluated by nanoparticle tracking. The sum of P15 (B) or P120 (C) EVs (ranging from 0 to 250 nm) released under each condition was plotted. Representative data are shown as mean ± S.D. from five repetitions. Ns, not significant; **, 0.0011; ****p < 0.0001 (two‐tailed, unpaired Student t‐test). (D) Total lysates (30 μg) of DMSO‐ or inhibitor‐treated cells were analyzed by immunoblotting with the indicated antibodies. (E,F) KIT‐EVs were captured with an antibody against N‐terminal KIT from P15 (3.4 × 10⁸ EVs) (E) or P120 (2.6 × 10⁹ EVs) (F) vesicles released by control, GW4869‐ or amitriptyline‐treated cells. Total KIT‐EV lysates were evaluated by Western blotting; representative blots are shown. (G,H) Signal intensities of proteins in KIT‐EVs (E,F) were quantified and normalized to the DMSO control. Up‐ or down‐regulation (indicated by arrows) of protein content in P15 and P120 KIT‐EVs in response to GW4869 (G) or amitriptyline (H) is displayed in Volcano graphs (n = 3). The q‐value is the FDR‐adjusted p‐value, and the dashed line indicates the significance threshold. In D, E and F, dashed lines imply lanes from the same blot that were not loaded contiguously Image collected and cropped by CiteAb from the following open publication (https://pubmed.ncbi.nlm.nih.gov/36239715), licensed under a CC-BY license. Not internally tested by R&D Systems.
Detection of CD117/c-kit by Western Blot
KIT‐EV immunocapture of LAD2 huMC EVs and KIT‐EV recovery from spiked plasma. (A) Cytokine‐starved LAD2 huMCs were treated or not with stem cell factor (SCF; 100 ng/ml) for 2 h in HEPES‐BSA buffer. Cell lysates (30 μg) were analyzed by immunoblotting with the indicated antibodies. (B) EVs released into the supernatant by 18 × 106 LAD2 cells treated or not with SCF for 2 h were sedimented by differential ultracentrifugation into P15 and P120 EVs. KIT‐EV immunocapture was performed (KIT antibody AF332) from all sedimented LAD2 P15 and P120 EVs. The total bead elution was loaded and analyzed by Western blotting with the indicated antibodies. Input EV lysates (5 × 10⁸) were included. Representative blots are shown. (C) HMC‐1.1 cell line‐derived EVs (1.2 × 10¹⁰ EVs) were incubated or not in human normal plasma and captured with a KIT antibody (AF332) or by CD9 antibody‐conjugated beads. A goat HA antibody served as a negative isotype control. Representative blots are shown. sKIT, soluble KIT that is present in plasma. Dashed lines imply lanes from the same blot that were not loaded contiguously Image collected and cropped by CiteAb from the following open publication (https://pubmed.ncbi.nlm.nih.gov/36239715), licensed under a CC-BY license. Not internally tested by R&D Systems.
Detection of CD117/c-kit by Western Blot
KIT‐EVs are released as heterogeneous subpopulations with different physical properties. (A) Cell culture supernatant was subjected to differential ultracentrifugation to obtain P15 and P120 EV pellets, as illustrated. Where indicated, P15 and P120 EVs were further separated by iodixanol density gradients. Vesicles from each density fraction were pelleted and analyzed. (B) P15 and P120 EVs obtained from HMC‐1.1 cells were analyzed by nanoparticle tracking. Representative concentration and size profiles averaged from five workflow repetitions are depicted. The averaged percentage (%) of different size ranges within the P15 or P120 population is shown on top (bar chart). (C) Representative Western blot of HMC‐1.1 cell, P15 and P120 EV lysates (30 μg) probed with the indicated antibodies. (D, E) HMC‐1.1‐derived P15 (D) or P120 (E) EV pellets were separated by density gradients and the vesicles from each fraction (F1‐F10) were analyzed by nanoparticle tracking for concentration (particles/ml), shown as box plots, and size (represented as average mode, nm), shown as a line graph. Data in the box plots represent the median with the whiskers indicating minimum and maximum values; data in the line graph are represented as mean ± S.D. from five repetitions. Representative results are shown. (F, G) Representative immunoblots showing the presence of KIT and annexin A1 in P15 EV fractions (F) and KIT and CD81 in P120 EV fractions (G). The density (g/ml) of each fraction is indicated below Image collected and cropped by CiteAb from the following open publication (https://pubmed.ncbi.nlm.nih.gov/36239715), licensed under a CC-BY license. Not internally tested by R&D Systems.
Human CD117 / c-kit ELISA Standard Curve
Mouse FGF acidic was serially diluted and captured by Mouse Anti-Human CD117/c-kit Monoclonal Antibody (Catalog # MAB332) coated on a Clear Polystyrene Microplate (Catalog # DY990). Goat Anti-Human CD117/c-kit Antigen Affinity-purified Polyclonal Antibody (Catalog # AF332) was biotinylated and incubated with the protein captured on the plate. Detection of the standard curve was achieved by incubating Streptavidin-HRP (Catalog # DY998)Applications for Human CD117/c-kit Antibody
Application
Recommended Usage
CyTOF-ready
Ready to be labeled using established conjugation methods. No BSA or other carrier proteins that could interfere with conjugation.
Flow Cytometry
2.5 µg/106 cells
Sample: TF‑1 human erythroleukemic cell line
Sample: TF‑1 human erythroleukemic cell line
Immunohistochemistry
5-15 µg/mL
Sample: Immersion fixed paraffin-embedded sections of human brain (hippocampus) subjected to Antigen Retrieval Reagent-Basic (Catalog # CTS013)
Sample: Immersion fixed paraffin-embedded sections of human brain (hippocampus) subjected to Antigen Retrieval Reagent-Basic (Catalog # CTS013)
Simple Western
5 µg/mL
Sample: MO7e human megakaryocytic leukemic cell line
Sample: MO7e human megakaryocytic leukemic cell line
Western Blot
0.1 µg/mL
Sample: MO7e human megakaryocytic leukemic cell line
Sample: MO7e human megakaryocytic leukemic cell line
Neutralization
Measured by its ability to neutralize SCF/c‑kit Ligand-induced proliferation in the TF‑1 human erythroleukemic cell line. Kitamura, T. et al. (1989) J. Cell Physiol. 140:323.The Neutralization Dose (ND50) is typically 0.06-0.36 μg/mL in the presence of 20 ng/mL Recombinant Human SCF/c‑kit Ligand.
Reviewed Applications
Read 3 reviews rated 4.7 using AF332 in the following applications:
Flow Cytometry Panel Builder
Bio-Techne Knows Flow Cytometry
Save time and reduce costly mistakes by quickly finding compatible reagents using the Panel Builder Tool.
Advanced Features
- Spectra Viewer - Custom analysis of spectra from multiple fluorochromes
- Spillover Popups - Visualize the spectra of individual fluorochromes
- Antigen Density Selector - Match fluorochrome brightness with antigen density

Formulation, Preparation, and Storage
Purification
Antigen Affinity-purified
Reconstitution
Reconstitute at 0.2 mg/mL in sterile PBS. For liquid material, refer to CoA for concentration.
Loading...
Formulation
Lyophilized from a 0.2 μm filtered solution in PBS with Trehalose. *Small pack size (SP) is supplied either lyophilized or as a 0.2 µm filtered solution in PBS.
Shipping
Lyophilized product is shipped at ambient temperature. Liquid small pack size (-SP) is shipped with polar packs. Upon receipt, store immediately at the temperature recommended below.
Stability & Storage
Use a manual defrost freezer and avoid repeated freeze-thaw cycles.
- 12 months from date of receipt, -20 to -70 °C as supplied.
- 1 month, 2 to 8 °C under sterile conditions after reconstitution.
- 6 months, -20 to -70 °C under sterile conditions after reconstitution.
Calculators
Background: CD117/c-kit
References
- Broudy, V. (1997) Blood 90:1345.
- Vliagoftis, H. et al. (1997) J. Allergy Clin. Immunol. 100:435.
Long Name
Stem Cell Factor Receptor
Alternate Names
c-kit, CD117, ckit, KIT, PBT, SCF R, SCFR
Gene Symbol
KIT
UniProt
Additional CD117/c-kit Products
Product Documents for Human CD117/c-kit Antibody
Certificate of Analysis
To download a Certificate of Analysis, please enter a lot or batch number in the search box below.
Note: Certificate of Analysis not available for kit components.
Product Specific Notices for Human CD117/c-kit Antibody
For research use only
Related Research Areas
Citations for Human CD117/c-kit Antibody
 Powered by Bioz
Customer Reviews for Human CD117/c-kit Antibody (3)
4.7 out of 5
3 Customer Ratings
Have you used Human CD117/c-kit Antibody?
Submit a review and receive an Amazon gift card!
$25/€18/£15/$25CAN/¥2500 Yen for a review with an image
$10/€7/£6/$10CAN/¥1110 Yen for a review without an image
Submit a review
Customer Images
Showing
1
-
3 of
3 reviews
Showing All
Filter By:
-
Application: ImmunohistochemistrySample Tested: Adult small intestineSpecies: HumanVerified Customer | Posted 11/13/2025Tissue fixed in 4% PFA for 1 hour, and cryoprotected in 30% sucrose for 24 hours. Tissue frozen in OCT compound and cut at 10um thickness. Blocked for 1 hour in protein block and stained at 5 ug/mL.

-
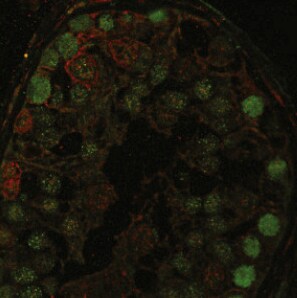
Application: Immunocytochemistry/ImmunofluorescenceSample Tested: Testis tissueSpecies: HumanVerified Customer | Posted 01/12/2021ckit antibody dilution 1:200 for human sample. Red colour is kit staining.
-
Application: Immunohistochemistry-FrozenSample Tested: See PMID 23769888Species: MouseVerified Customer | Posted 01/07/2015
There are no reviews that match your criteria.
Protocols
Find general support by application which include: protocols, troubleshooting, illustrated assays, videos and webinars.
- 7-Amino Actinomycin D (7-AAD) Cell Viability Flow Cytometry Protocol
- Antigen Retrieval Protocol (PIER)
- Antigen Retrieval for Frozen Sections Protocol
- Appropriate Fixation of IHC/ICC Samples
- Cellular Response to Hypoxia Protocols
- Chromogenic IHC Staining of Formalin-Fixed Paraffin-Embedded (FFPE) Tissue Protocol
- Chromogenic Immunohistochemistry Staining of Frozen Tissue
- ClariTSA™ Fluorophore Kits
- Detection & Visualization of Antibody Binding
- Extracellular Membrane Flow Cytometry Protocol
- Flow Cytometry Protocol for Cell Surface Markers
- Flow Cytometry Protocol for Staining Membrane Associated Proteins
- Flow Cytometry Staining Protocols
- Flow Cytometry Troubleshooting Guide
- Fluorescent IHC Staining of Frozen Tissue Protocol
- Graphic Protocol for Heat-induced Epitope Retrieval
- Graphic Protocol for the Preparation and Fluorescent IHC Staining of Frozen Tissue Sections
- Graphic Protocol for the Preparation and Fluorescent IHC Staining of Paraffin-embedded Tissue Sections
- Graphic Protocol for the Preparation of Gelatin-coated Slides for Histological Tissue Sections
- IHC Sample Preparation (Frozen sections vs Paraffin)
- Immunofluorescent IHC Staining of Formalin-Fixed Paraffin-Embedded (FFPE) Tissue Protocol
- Immunohistochemistry (IHC) and Immunocytochemistry (ICC) Protocols
- Immunohistochemistry Frozen Troubleshooting
- Immunohistochemistry Paraffin Troubleshooting
- Intracellular Flow Cytometry Protocol Using Alcohol (Methanol)
- Intracellular Flow Cytometry Protocol Using Detergents
- Intracellular Nuclear Staining Flow Cytometry Protocol Using Detergents
- Intracellular Staining Flow Cytometry Protocol Using Alcohol Permeabilization
- Intracellular Staining Flow Cytometry Protocol Using Detergents to Permeabilize Cells
- Preparing Samples for IHC/ICC Experiments
- Preventing Non-Specific Staining (Non-Specific Binding)
- Primary Antibody Selection & Optimization
- Propidium Iodide Cell Viability Flow Cytometry Protocol
- Protocol for Heat-Induced Epitope Retrieval (HIER)
- Protocol for Liperfluo
- Protocol for Making a 4% Formaldehyde Solution in PBS
- Protocol for VisUCyte™ HRP Polymer Detection Reagent
- Protocol for the Characterization of Human Th22 Cells
- Protocol for the Characterization of Human Th9 Cells
- Protocol for the Preparation & Fixation of Cells on Coverslips
- Protocol for the Preparation and Chromogenic IHC Staining of Frozen Tissue Sections
- Protocol for the Preparation and Chromogenic IHC Staining of Frozen Tissue Sections - Graphic
- Protocol for the Preparation and Chromogenic IHC Staining of Paraffin-embedded Tissue Sections
- Protocol for the Preparation and Chromogenic IHC Staining of Paraffin-embedded Tissue Sections - Graphic
- Protocol for the Preparation and Fluorescent IHC Staining of Frozen Tissue Sections
- Protocol for the Preparation and Fluorescent IHC Staining of Paraffin-embedded Tissue Sections
- Protocol for the Preparation of Gelatin-coated Slides for Histological Tissue Sections
- Protocol: Annexin V and PI Staining by Flow Cytometry
- Protocol: Annexin V and PI Staining for Apoptosis by Flow Cytometry
- R&D Systems Quality Control Western Blot Protocol
- TUNEL and Active Caspase-3 Detection by IHC/ICC Protocol
- The Importance of IHC/ICC Controls
- Troubleshooting Guide: Fluorokine Flow Cytometry Kits
- Troubleshooting Guide: Immunohistochemistry
- Troubleshooting Guide: Western Blot Figures
- Western Blot Conditions
- Western Blot Protocol
- Western Blot Protocol for Cell Lysates
- Western Blot Troubleshooting
- Western Blot Troubleshooting Guide
- View all Protocols, Troubleshooting, Illustrated assays and Webinars