Human GATA‑6 Antibody
R&D Systems | Catalog # AF1700

Key Product Details
Validated by
Biological Validation
Species Reactivity
Validated:
Human
Cited:
Human, Mouse, Porcine, Bovine, Primate - Callithrix jacchus (Common Marmoset), Primate - Macaca fascicularis (Crab-eating Monkey or Cynomolgus Macaque), Transgenic Mouse
Applications
Validated:
Immunohistochemistry, Western Blot, Immunocytochemistry, Simple Western, Chromatin Immunoprecipitation (ChIP)
Cited:
Immunohistochemistry, Immunohistochemistry-Paraffin, Immunohistochemistry-Frozen, Western Blot, Flow Cytometry, Immunocytochemistry, Immunocytochemistry/ Immunofluorescence, Immunoprecipitation, Chromatin Immunoprecipitation (ChIP), IF/ICC
Label
Unconjugated
Antibody Source
Polyclonal Goat IgG
Loading...
Product Specifications
Immunogen
E. coli-derived recombinant human GATA-6
Met1-Thr449
Accession # Q92908
Met1-Thr449
Accession # Q92908
Specificity
Detects human GATA-6 in direct ELISAs and Western blots.
Clonality
Polyclonal
Host
Goat
Isotype
IgG
Scientific Data Images for Human GATA‑6 Antibody
Detection of Human GATA‑6 by Western Blot.
Western blot shows cytoplasmic and nuclear extracts from PC-3 human prostate cancer cell line. PVDF membrane was probed with 1 µg/mL of Goat Anti-Human GATA-6 Antigen Affinity-purified Polyclonal Antibody (Catalog # AF1700) followed by HRP-conjugated Anti-Goat IgG Secondary Antibody (HAF017). A specific band was detected for GATA-6 at approximately 55 kDa (as indicated). This experiment was conducted under reducing conditions and using Immunoblot Buffer Group 1.
GATA‑6 in KATO-III Human Cell Line.
GATA-6 was detected in immersion fixed KATO-III human gastric carcinoma cell line using 10 µg/mL Goat Anti-Human GATA-6 Antigen Affinity-purified Polyclonal Antibody (Catalog # AF1700) for 3 hours at room temperature. Cells were stained with the NorthernLights™ 557-conjugated Anti-Goat IgG Secondary Antibody (red, upper panel; NL001) and counterstained with DAPI (blue, lower panel). View our protocol for Fluorescent ICC Staining of Cells on Coverslips.
Detection of GATA‑6-regulated Genes by Chromatin Immunoprecipitation.
KATO-III human gastric carcinoma cell line was fixed using formaldehyde, resuspended in lysis buffer, and sonicated to shear chromatin. GATA-6/DNA complexes were immunoprecipitated using 5 µg Goat Anti-Human GATA-6 Antigen Affinity-purified Polyclonal Antibody (Catalog # AF1700) or control antibody (AB-108-C) for 15 minutes in an ultrasonic bath, followed by Biotinylated Anti-Goat IgG Secondary Antibody (BAF109). Immunocomplexes were captured using 50 µL of MagCellect Streptavidin Ferrofluid (MAG999) and DNA was purified using chelating resin solution. Themucin4promoter was detected by standard PCR.
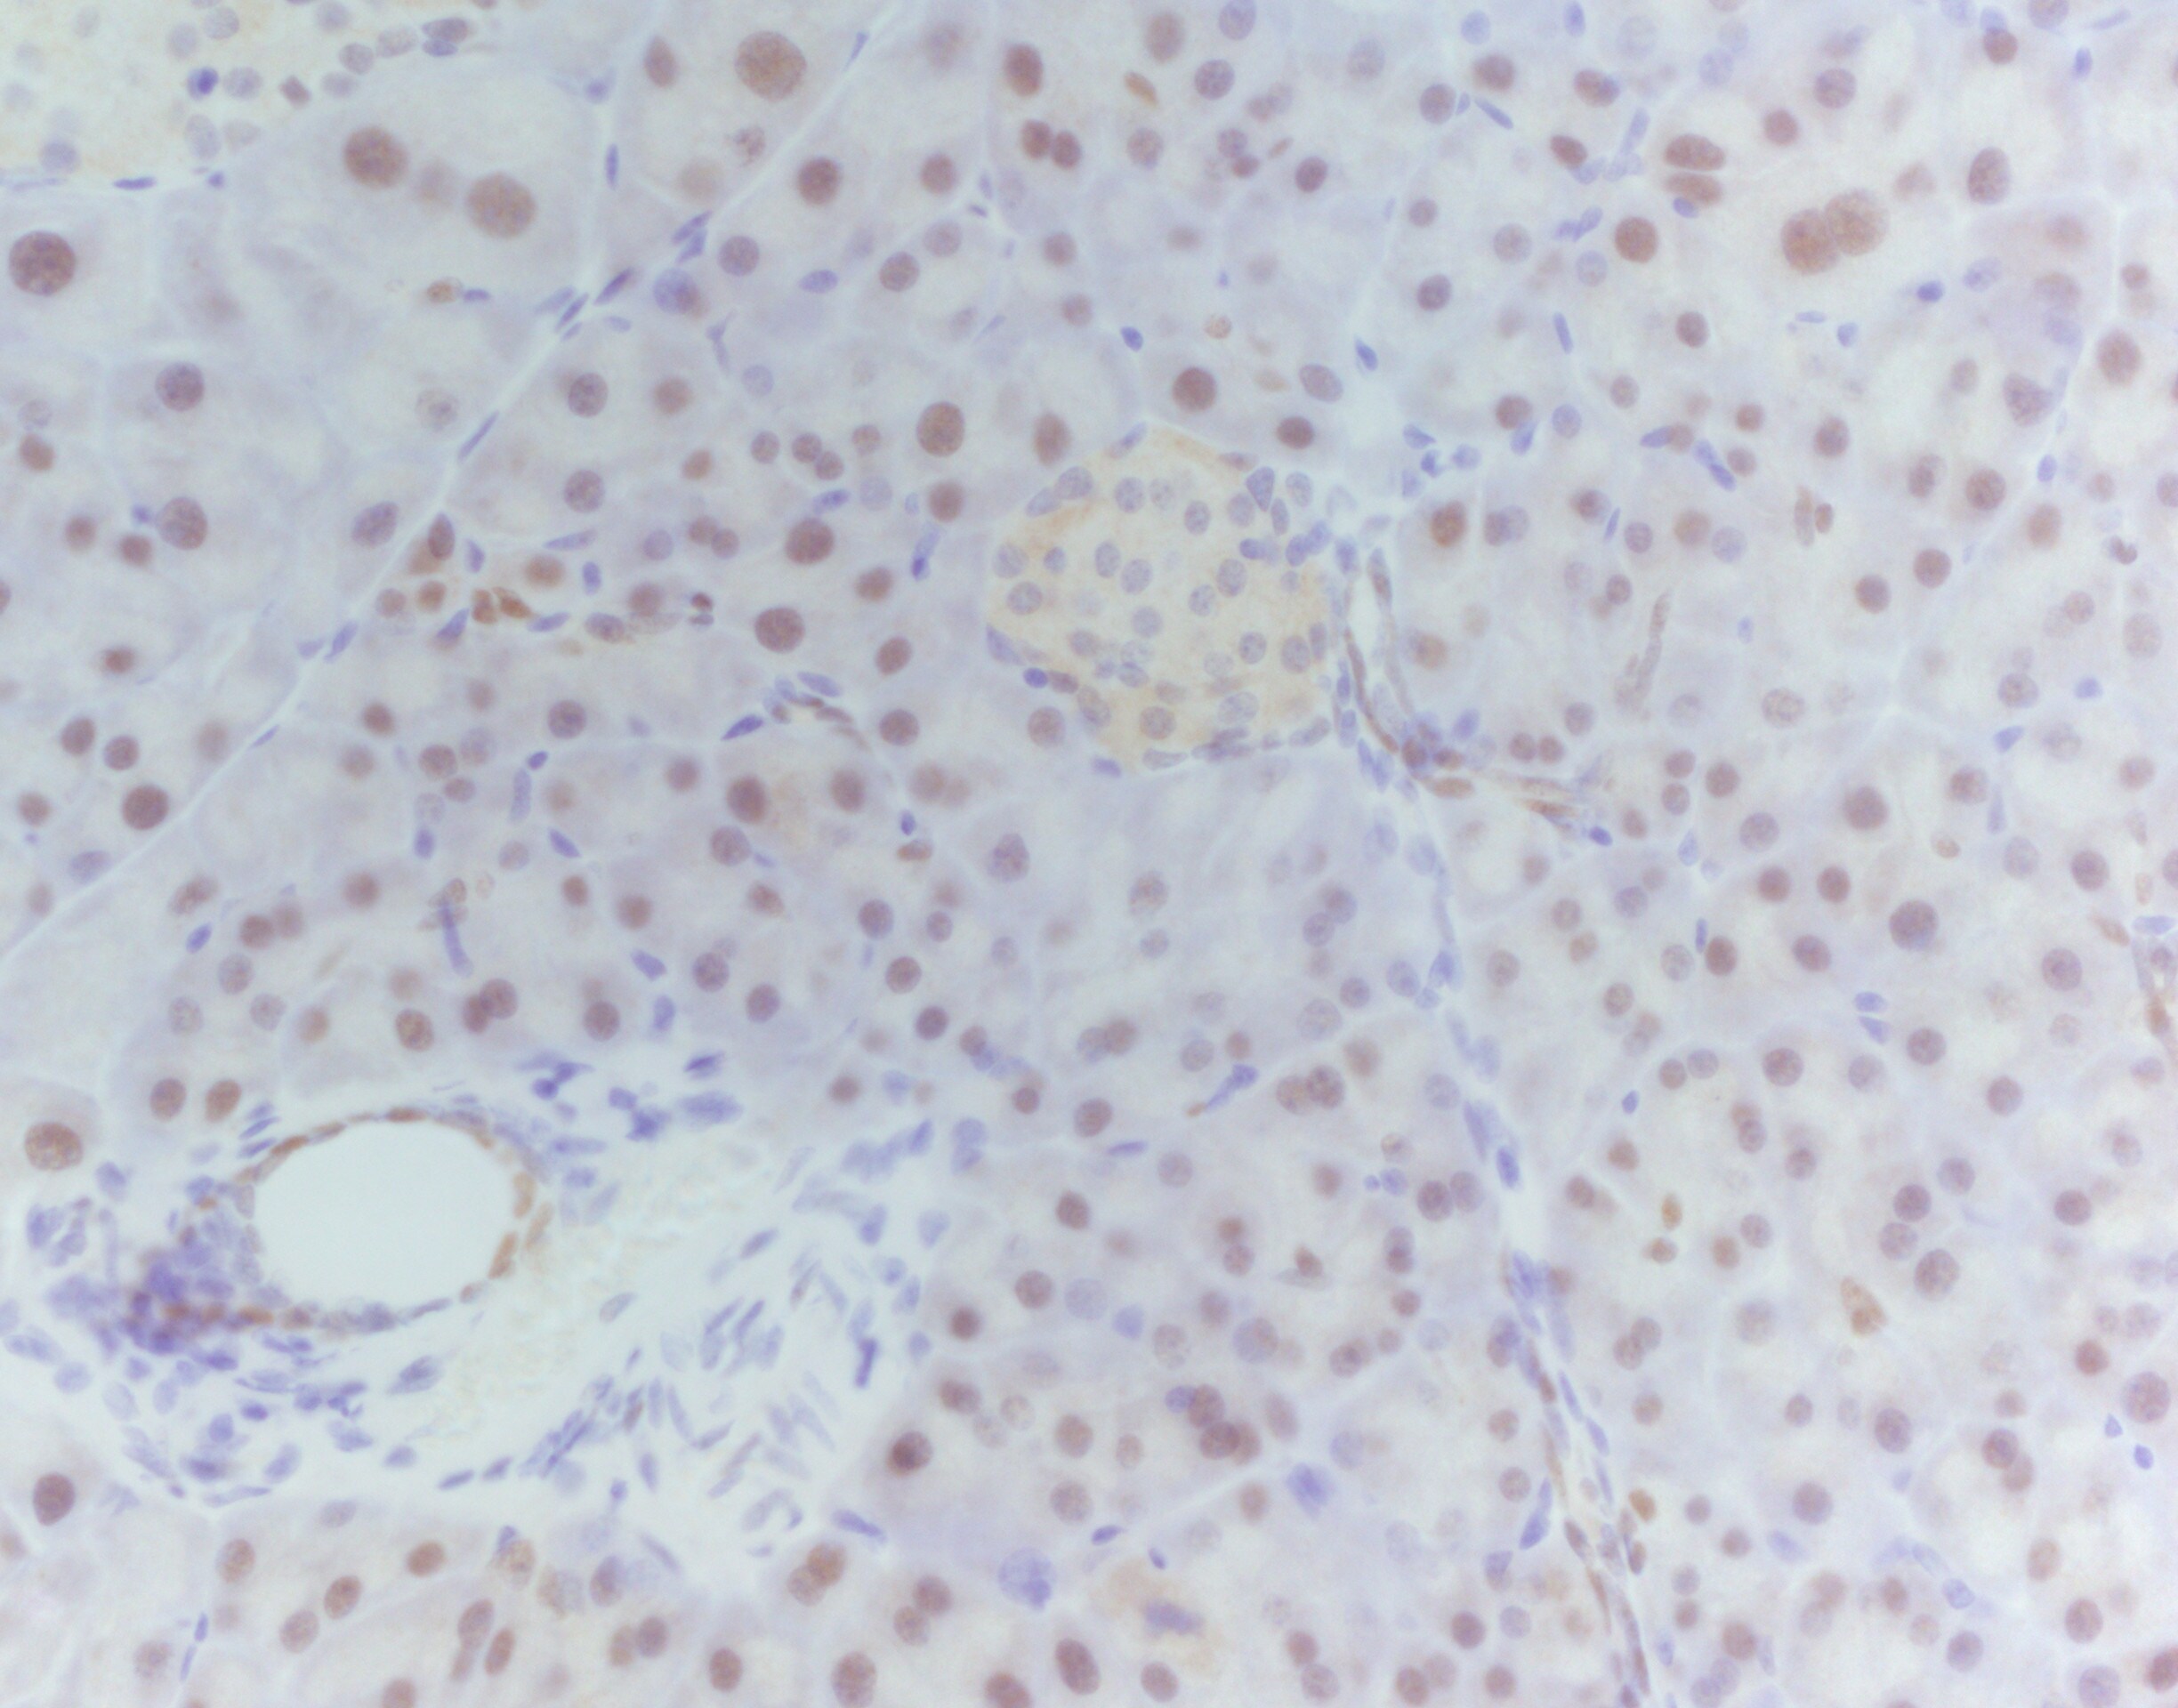
GATA‑6 in Human Intestine.
GATA-6 was detected in immersion fixed paraffin-embedded sections of human intestine using Goat Anti-Human GATA-6 Antigen Affinity-purified Polyclonal Antibody (Catalog # AF1700) at 5 µg/mL overnight at 4 °C. Tissue was stained using the Anti-Goat HRP-DAB Cell & Tissue Staining Kit (brown; CTS008) and counter-stained with hematoxylin (blue). View our protocol for Chromogenic IHC Staining of Paraffin-embedded Tissue Sections.
Detection of Human GATA‑6 by Simple WesternTM.
Simple Western shows lysates of PC‑3 human prostate cancer cell line, loaded at 0.2 mg/ml. A specific band was detected for GATA‑6 at approximately 62 kDa (as indicated) using 10 µg/mL of Goat Anti-Human GATA‑6 Antigen Affinity-purified Polyclonal Antibody (Catalog # AF1700). This experiment was conducted under reducing conditions and using the 12-230kDa separation system.
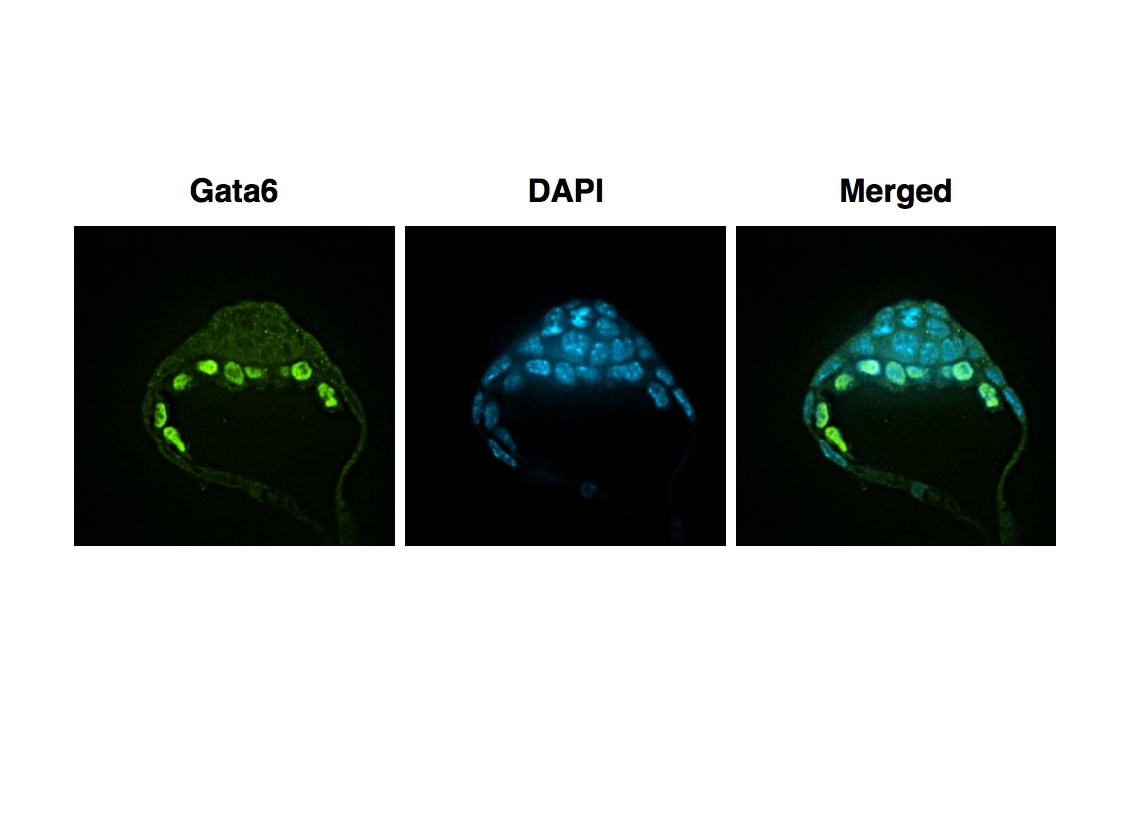
Detection of Mouse GATA-6 by Immunocytochemistry/Immunofluorescence
p38-Mapk14/11 inhibition during blastocyst maturation blocks PrE differentiation/maturation. (a) Experimental schema of p38-Mapk14/11 inhibition (+SB220025), plus vehicle control (+DMSO), and the details of antibodies used to analyse ICM cell lineage marker protein expression by immunofluorescence (IF) in late blastocysts (E4.5); Nanog and Gata4 (+DMSO n = 27, +SB220025 n = 33)—green, Nanog and Sox17 (+DMSO n = 18, +SB220025 n = 20)—red, and Nanog and Gata6 (+DMSO n = 24, +SB220025 n = 27)—blue. (b) Representative single confocal z-plane micrographs of vehicle control-treated (+DMSO) or p38-Mapk14/11 inhibited (+SB220025) late-blastocyst stage/equivalent embryos, immunofluorescently stained for indicated ICM cell lineage markers (Nanog in green and Gata4, Sox17 and Gata6 in red, plus DAPI DNA stain in blue). Examples of cells classified as TE, PrE and EPI are marked with an asterisk, arrowhead and arrow, respectively. Scale bar, 15 µm. (c) Pie charts of the relative cell lineage contribution in vehicle control (+DMSO) and p38-Mapk14/11 inhibited (+SB220025) blastocysts as judged by IF to detect the stated ICM lineage marker proteins. Blue, trophectoderm (TE); yellow, epiblast (EPI—ICM exhibiting exclusive Nanog expression); green, primitive endoderm (PrE—ICM exhibiting exclusive Gata4/6 or Sox17 expression, as appropriate); orange, uncommitted ICM cells (exhibiting co-expression of both Nanog and Gata4/6 or Sox17, as appropriate); and grey, ICM cells negative for either assayed marker. (d) Bar charts show average number of cells allocated to each specified ICM lineage, as judged by the indicated IF staining regime employed. Error bars represent s.e.m. and asterisks denote statistical significant differences in cell number between the vehicle control (+DMSO, black bars) and p38-Mapk14/11 inhibited (+SB220025, grey bars) embryo groups, according to two-tailed Student's t-test, with *p < 0.05 and **p < 0.005 confidence intervals. Yellow asterisk denotes increase in cel
Detection of Mouse GATA-6 by Western Blot
Reduced expression of the primitive endoderm markers Gata4 and Gata6 and increased expression of Nanog was observed in embryoid bodies following inhibitor of the Fgfr.Embryoid bodies were grown in different concentrations of AZD-4547 or 0.08% DMSO for 7 days. Expression levels of (A) Gata6, and (B) Gata4 were analysed using western blotting. A representative blot and quantification from 3 independent experiments is shown for each marker. A dose dependent decrease in expression of both proteins was observed. Statistical analysis is a one-way Anova with a Dunnett’s post-hoc test. Whole-mount immunostaining of (C) Gata6 and (D) Nanog after treatment of embryoid bodies with 4 µM AZD-4547 or 0.04% DMSO. A reduction in the percentage of nuclei expressing Gata6 was observed. The percentage of nuclei expressing Nanog increased. A representative image from 3 independent experiments is shown. Scale bars 10 µm. Dotted lines represent position that the relevant orthogonal or aerial images were taken. Statistical analysis is a paired t-test. Data is from 3 independent experiments, error bars represent SEM. (*P = 0.1–0.5, **p = 0.001–0.01, ***p<0.001). Image collected and cropped by CiteAb from the following publication (https://dx.plos.org/10.1371/journal.pone.0095434), licensed under a CC-BY license. Not internally tested by R&D Systems.
Detection of Mouse GATA-6 by Western Blot
Reduced expression of primitive endoderm markers Gata4 and Gata6 and increased expression of Nanog was observed in embryoid bodies upon inhibition of Mek.Embryoid bodies were grown in different concentrations of PD-0325901 or 0.04% DMSO for 7 days. Expression levels of (A) Gata6, and (B) Gata4 were analysed using western blotting. A representative blot and quantification from 3 independent experiments is shown for each marker. A dose dependent decrease in expression of both proteins was observed. Statistical analysis is a one-way Anova with a Dunnett’s post-hoc test. Whole-mount immunostaining of (C) Gata6 and (D) Nanog after treatment of embryoid bodies with 4 µM PD-0325901. A reduction in the percentage of nuclei expressing Gata6 was observed whilst there was an increase in the percentage of nuclei expressing Nanog. A representative image from 3 independent experiments is shown. Scale bars 10 µm. Dotted lines represent position that the relevant orthogonal or aerial images were taken. Statistical test is a paired t-test. Data is from 3 independent experiments, error bars represent SEM. (*P = 0.1–0.5, **p = 0.001–0.01, ***p<0.001). Image collected and cropped by CiteAb from the following publication (https://dx.plos.org/10.1371/journal.pone.0095434), licensed under a CC-BY license. Not internally tested by R&D Systems.
Detection of Mouse GATA-6 by Immunocytochemistry/Immunofluorescence
Reduced expression of the primitive endoderm markers Gata4 and Gata6 and increased expression of Nanog was observed in embryoid bodies following inhibitor of the Fgfr.Embryoid bodies were grown in different concentrations of AZD-4547 or 0.08% DMSO for 7 days. Expression levels of (A) Gata6, and (B) Gata4 were analysed using western blotting. A representative blot and quantification from 3 independent experiments is shown for each marker. A dose dependent decrease in expression of both proteins was observed. Statistical analysis is a one-way Anova with a Dunnett’s post-hoc test. Whole-mount immunostaining of (C) Gata6 and (D) Nanog after treatment of embryoid bodies with 4 µM AZD-4547 or 0.04% DMSO. A reduction in the percentage of nuclei expressing Gata6 was observed. The percentage of nuclei expressing Nanog increased. A representative image from 3 independent experiments is shown. Scale bars 10 µm. Dotted lines represent position that the relevant orthogonal or aerial images were taken. Statistical analysis is a paired t-test. Data is from 3 independent experiments, error bars represent SEM. (*P = 0.1–0.5, **p = 0.001–0.01, ***p<0.001). Image collected and cropped by CiteAb from the following publication (https://dx.plos.org/10.1371/journal.pone.0095434), licensed under a CC-BY license. Not internally tested by R&D Systems.
Detection of Mouse GATA-6 by Immunocytochemistry/Immunofluorescence
expression of primitive endoderm cell fate markers gradually increased and nanog decreased in developing embryoid bodies.Embryoid bodies were produced from R63 mES cells using the hanging drop method. Development of the embryoid body was monitored over ten days. (A) Light microscopy images show the gradual increase in size of the embryoid bodies as well as increased heterogeneity, loss of circularity and formation of cystic cavities at later timepoints. Scale bars 200 µm. (B) Whole-mount immunostaining showing nuclear localisation of Gata6, Gata4, and Hnf4 alpha on days 3, 5, 7, and 10 of embryoid body development. The percentage of positive nuclei for each protein is shown graphically. The number of positive nuclei increased, reaching a maximum on day 7. (C) Whole-mount immunostaining showing nuclear localisation of Nanog. The number of positive nuclei rapidly decreased, with no positive cells seen on days 7 or 10. The percentage of positive nuclei for each protein is shown graphically. Data is from at least 3 independent experiments, error bars are standard error of the mean (SEM). Statistical analysis is a one-way Anova with a Tukey’s post-hoc test, (*P = 0.1–0.5, **p = 0.001–0.01, ***p<0.001). Dotted lines represent position that the relevant orthogonal or aerial images were taken. Scale bars 10 µm. Image collected and cropped by CiteAb from the following publication (https://dx.plos.org/10.1371/journal.pone.0095434), licensed under a CC-BY license. Not internally tested by R&D Systems.
Detection of Mouse GATA-6 by Western Blot
Gata factor expression in embryoid bodies (EBs) at day 5.5 culture and in ex vivo visceral yolk sac (VYS) at E17.5 in relation to maternal diet. (A) Expression of Gata4, Gata6 and Dab2 mRNA in EBs of Emb-LPD and NPD groups presented as ratio to the geometric mean of Gapdh and Ppib transcripts (n = 5 per treatment). (B) Expression of Gata6 and Dab2 protein in EBs from NPD and Emb-LPD groups (n = 6 cell lines per treatment). Upper: representative images of protein immunoblot bands. Lower: band intensity normalized to alpha -tubulin expression. (C) Expression of Gata6 protein in VYS from Emb-LPD, LPD and NPD group (n = 4 samples per treatment). Upper: representative images of protein immunoblot bands. Lower: band intensity normalized to alpha -tubulin expression. Values presented are mean ± SEM. *p < 0.05. Image collected and cropped by CiteAb from the following publication (https://bmcdevbiol.biomedcentral.com/articles/10.1186/s12861-015-0053-1), licensed under a CC-BY license. Not internally tested by R&D Systems.
Detection of Mouse GATA-6 by Immunocytochemistry/Immunofluorescence
Reduced expression of primitive endoderm markers Gata4 and Gata6 and increased expression of Nanog was observed in embryoid bodies upon inhibition of Mek.Embryoid bodies were grown in different concentrations of PD-0325901 or 0.04% DMSO for 7 days. Expression levels of (A) Gata6, and (B) Gata4 were analysed using western blotting. A representative blot and quantification from 3 independent experiments is shown for each marker. A dose dependent decrease in expression of both proteins was observed. Statistical analysis is a one-way Anova with a Dunnett’s post-hoc test. Whole-mount immunostaining of (C) Gata6 and (D) Nanog after treatment of embryoid bodies with 4 µM PD-0325901. A reduction in the percentage of nuclei expressing Gata6 was observed whilst there was an increase in the percentage of nuclei expressing Nanog. A representative image from 3 independent experiments is shown. Scale bars 10 µm. Dotted lines represent position that the relevant orthogonal or aerial images were taken. Statistical test is a paired t-test. Data is from 3 independent experiments, error bars represent SEM. (*P = 0.1–0.5, **p = 0.001–0.01, ***p<0.001). Image collected and cropped by CiteAb from the following publication (https://dx.plos.org/10.1371/journal.pone.0095434), licensed under a CC-BY license. Not internally tested by R&D Systems.
Detection of Human GATA-6 by Western Blot
Gata factor expression in embryoid bodies (EBs) at day 5.5 culture and in ex vivo visceral yolk sac (VYS) at E17.5 in relation to maternal diet. (A) Expression of Gata4, Gata6 and Dab2 mRNA in EBs of Emb-LPD and NPD groups presented as ratio to the geometric mean of Gapdh and Ppib transcripts (n = 5 per treatment). (B) Expression of Gata6 and Dab2 protein in EBs from NPD and Emb-LPD groups (n = 6 cell lines per treatment). Upper: representative images of protein immunoblot bands. Lower: band intensity normalized to alpha -tubulin expression. (C) Expression of Gata6 protein in VYS from Emb-LPD, LPD and NPD group (n = 4 samples per treatment). Upper: representative images of protein immunoblot bands. Lower: band intensity normalized to alpha -tubulin expression. Values presented are mean ± SEM. *p < 0.05. Image collected and cropped by CiteAb from the following publication (https://bmcdevbiol.biomedcentral.com/articles/10.1186/s12861-015-0053-1), licensed under a CC-BY license. Not internally tested by R&D Systems.
Detection of GATA-6 by Western Blot
Endothelial GATA6 loss promotes GATA6 deficiency and increases growth of PASMC. (A) IHC stainings were performed to detect Gata6, CD31 and alpha -SMA in WT and Gata6 CKO mice; images are representative from 3 mice/group. Bar = 50 μm. White arrowheads indicate Gata6-positive cells. (B) Schematic representation of experiments (C–F). Media conditioned for 72 h by non-diseased human PAEC (HPAEC) transfected with GATA6 siRNAs or control scr siRNA was added to non-diseased distal human PASMC. (C,D,E) mRNA (C) and immunoblot analyses (D,E) of PASMC after 72 h incubation with HPAEC-conditioned media (CM) were performed. Data are means ± SE from n ≥ 3 repetitions. *p < 0.05, **p < 0.01, ***p < 0.001 by Mann Whitney U test. (F) Cell growth (cell counts) assay of PASMC after 48 h incubation with indicated HPAEC conditioned media (CM). Data are means ± SE, n = 3. *p < 0.05 by Mann Whitney U test. (G,H) PASMC were incubated for 48 h with indicated HPAEC conditioned media (CM) in the presence of 10 nM control IgG, anti-fractalkine antibody (AB), or anti-TGF beta AB. Schematic representation of experiment (G) and cell proliferation analysis (H) are shown. Data are means ± SE, n = 3–4/group. *p < 0.05 by Kruskal–Wallis test with post hoc Dunn’s test for multiple comparisons. The original blots are presented in Supplementary Fig. S18. Image collected and cropped by CiteAb from the following open publication (https://pubmed.ncbi.nlm.nih.gov/37087509), licensed under a CC-BY license. Not internally tested by R&D Systems.
Detection of GATA-6 by Western Blot
GATA6 deficiency is required for increased proliferation of human PAH PAEC & PASMC. (A-D) Human PAH PAECs were transfected with mock ( − ) (A,B), 10 MOI control adenovirus (C,D), or 10 MOI AdGATA6 for 48 h followed by immunoblot analysis (A), cell counts (B), proliferation (Ki67) (C), & apoptosis (Annexin V-FITC Apoptosis Staining/Detection Kit) (D) assays. Data are means ± SE from three (A–C) or four (D) experiments, each performed on from different patient. *p < 0.05 by Mann Whitney U test. (E–H) Immunoblot analysis (E), cell counts (F), proliferation (Ki67) (G), & apoptosis (Annexin V-FITC Apoptosis Staining/Detection Kit) (H) assays of human PAH PASMC transfected with mock ( − ) (E,F), 10 MOI control adenovirus (G,H), or 10 MOI AdGATA6 for 48 h. Data are means ± SE from three (E–G) or four (H) experiments, each performed on from different patient. *p < 0.05 by Mann Whitney U test. (I) RNA-sequencing analysis of adGATA6 & mock-transfected PAH PASMC (3 patients/group). RNA-sequencing data was normalized & clustered. Selected up & down-regulated gene clusters are shown. Genes further studied by immunoblot are boxed. Selected up- & down-regulated pathways identified by Gene Ontology analysis are shown (see supplemental Tables S2 & S3 for complete gene expression data). (J) Human PAH PASMC were transfected with mock ( − ) or 10 MOI AdGATA6 for 48 h followed by immunoblot analysis to detect indicated proteins. Data are means ± SE from three experiments, each performed on from different patient. *p < 0.05 by Mann Whitney U test. (K) Immunoblot analysis of human healthy control (HC) & PAH PASMC to detect indicated proteins. Data are means ± SE from n = 4 subjects/group, *p < 0.05 by Mann Whitney U test. The original blots are presented in Supplementary Fig. S15. Image collected & cropped by CiteAb from the following open publication (https://pubmed.ncbi.nlm.nih.gov/37087509), licensed under a CC-BY license. Not internally tested by R&D Systems.
Detection of GATA-6 by Western Blot
Endothelial GATA6 loss promotes GATA6 deficiency and increases growth of PASMC. (A) IHC stainings were performed to detect Gata6, CD31 and alpha -SMA in WT and Gata6 CKO mice; images are representative from 3 mice/group. Bar = 50 μm. White arrowheads indicate Gata6-positive cells. (B) Schematic representation of experiments (C–F). Media conditioned for 72 h by non-diseased human PAEC (HPAEC) transfected with GATA6 siRNAs or control scr siRNA was added to non-diseased distal human PASMC. (C,D,E) mRNA (C) and immunoblot analyses (D,E) of PASMC after 72 h incubation with HPAEC-conditioned media (CM) were performed. Data are means ± SE from n ≥ 3 repetitions. *p < 0.05, **p < 0.01, ***p < 0.001 by Mann Whitney U test. (F) Cell growth (cell counts) assay of PASMC after 48 h incubation with indicated HPAEC conditioned media (CM). Data are means ± SE, n = 3. *p < 0.05 by Mann Whitney U test. (G,H) PASMC were incubated for 48 h with indicated HPAEC conditioned media (CM) in the presence of 10 nM control IgG, anti-fractalkine antibody (AB), or anti-TGF beta AB. Schematic representation of experiment (G) and cell proliferation analysis (H) are shown. Data are means ± SE, n = 3–4/group. *p < 0.05 by Kruskal–Wallis test with post hoc Dunn’s test for multiple comparisons. The original blots are presented in Supplementary Fig. S18. Image collected and cropped by CiteAb from the following open publication (https://pubmed.ncbi.nlm.nih.gov/37087509), licensed under a CC-BY license. Not internally tested by R&D Systems.
Detection of Human GATA-6 by Western Blot
GATA6 deficiency is required for increased proliferation of human PAH PAEC & PASMC. (A-D) Human PAH PAECs were transfected with mock ( − ) (A,B), 10 MOI control adenovirus (C,D), or 10 MOI AdGATA6 for 48 h followed by immunoblot analysis (A), cell counts (B), proliferation (Ki67) (C), & apoptosis (Annexin V-FITC Apoptosis Staining/Detection Kit) (D) assays. Data are means ± SE from three (A–C) or four (D) experiments, each performed on from different patient. *p < 0.05 by Mann Whitney U test. (E–H) Immunoblot analysis (E), cell counts (F), proliferation (Ki67) (G), & apoptosis (Annexin V-FITC Apoptosis Staining/Detection Kit) (H) assays of human PAH PASMC transfected with mock ( − ) (E,F), 10 MOI control adenovirus (G,H), or 10 MOI AdGATA6 for 48 h. Data are means ± SE from three (E–G) or four (H) experiments, each performed on from different patient. *p < 0.05 by Mann Whitney U test. (I) RNA-sequencing analysis of adGATA6 & mock-transfected PAH PASMC (3 patients/group). RNA-sequencing data was normalized & clustered. Selected up & down-regulated gene clusters are shown. Genes further studied by immunoblot are boxed. Selected up- & down-regulated pathways identified by Gene Ontology analysis are shown (see supplemental Tables S2 & S3 for complete gene expression data). (J) Human PAH PASMC were transfected with mock ( − ) or 10 MOI AdGATA6 for 48 h followed by immunoblot analysis to detect indicated proteins. Data are means ± SE from three experiments, each performed on from different patient. *p < 0.05 by Mann Whitney U test. (K) Immunoblot analysis of human healthy control (HC) & PAH PASMC to detect indicated proteins. Data are means ± SE from n = 4 subjects/group, *p < 0.05 by Mann Whitney U test. The original blots are presented in Supplementary Fig. S15. Image collected & cropped by CiteAb from the following open publication (https://pubmed.ncbi.nlm.nih.gov/37087509), licensed under a CC-BY license. Not internally tested by R&D Systems.
Detection of GATA-6 by Western Blot
GATA6 deficiency is required for increased proliferation of human PAH PAEC & PASMC. (A-D) Human PAH PAECs were transfected with mock ( − ) (A,B), 10 MOI control adenovirus (C,D), or 10 MOI AdGATA6 for 48 h followed by immunoblot analysis (A), cell counts (B), proliferation (Ki67) (C), & apoptosis (Annexin V-FITC Apoptosis Staining/Detection Kit) (D) assays. Data are means ± SE from three (A–C) or four (D) experiments, each performed on from different patient. *p < 0.05 by Mann Whitney U test. (E–H) Immunoblot analysis (E), cell counts (F), proliferation (Ki67) (G), & apoptosis (Annexin V-FITC Apoptosis Staining/Detection Kit) (H) assays of human PAH PASMC transfected with mock ( − ) (E,F), 10 MOI control adenovirus (G,H), or 10 MOI AdGATA6 for 48 h. Data are means ± SE from three (E–G) or four (H) experiments, each performed on from different patient. *p < 0.05 by Mann Whitney U test. (I) RNA-sequencing analysis of adGATA6 & mock-transfected PAH PASMC (3 patients/group). RNA-sequencing data was normalized & clustered. Selected up & down-regulated gene clusters are shown. Genes further studied by immunoblot are boxed. Selected up- & down-regulated pathways identified by Gene Ontology analysis are shown (see supplemental Tables S2 & S3 for complete gene expression data). (J) Human PAH PASMC were transfected with mock ( − ) or 10 MOI AdGATA6 for 48 h followed by immunoblot analysis to detect indicated proteins. Data are means ± SE from three experiments, each performed on from different patient. *p < 0.05 by Mann Whitney U test. (K) Immunoblot analysis of human healthy control (HC) & PAH PASMC to detect indicated proteins. Data are means ± SE from n = 4 subjects/group, *p < 0.05 by Mann Whitney U test. The original blots are presented in Supplementary Fig. S15. Image collected & cropped by CiteAb from the following open publication (https://pubmed.ncbi.nlm.nih.gov/37087509), licensed under a CC-BY license. Not internally tested by R&D Systems.Applications for Human GATA‑6 Antibody
Application
Recommended Usage
Chromatin Immunoprecipitation (ChIP)
5 µg/5 x 106 cells
Sample: KATO‑III human gastric carcinoma cell line chromatin, mucin4 promoter detected by standard PCR.
Sample: KATO‑III human gastric carcinoma cell line chromatin, mucin4 promoter detected by standard PCR.
Immunocytochemistry
5-15 µg/mL
Sample: Immersion fixed KATO-III human gastric carcinoma cell line
Sample: Immersion fixed KATO-III human gastric carcinoma cell line
Immunohistochemistry
5-15 µg/mL
Sample: Immersion fixed paraffin-embedded sections of human intestine
Sample: Immersion fixed paraffin-embedded sections of human intestine
Simple Western
10 µg/mL
Sample: PC-3 human prostate cancer cell line
Sample: PC-3 human prostate cancer cell line
Western Blot
1 µg/mL
Sample: Nuclear extracts from PC‑3 human prostate cancer cell line
Sample: Nuclear extracts from PC‑3 human prostate cancer cell line
Reviewed Applications
Read 8 reviews rated 4.3 using AF1700 in the following applications:
Formulation, Preparation, and Storage
Purification
Antigen Affinity-purified
Reconstitution
Reconstitute at 0.2 mg/mL in sterile PBS. For liquid material, refer to CoA for concentration.
Loading...
Formulation
Lyophilized from a 0.2 μm filtered solution in PBS with Trehalose. See Certificate of Analysis for details.
*Small pack size (-SP) is supplied either lyophilized or as a 0.2 µm filtered solution in PBS.
*Small pack size (-SP) is supplied either lyophilized or as a 0.2 µm filtered solution in PBS.
Shipping
Lyophilized product is shipped at ambient temperature. Liquid small pack size (-SP) is shipped with polar packs. Upon receipt, store immediately at the temperature recommended below.
Stability & Storage
Use a manual defrost freezer and avoid repeated freeze-thaw cycles.
- 12 months from date of receipt, -20 to -70 °C as supplied.
- 1 month, 2 to 8 °C under sterile conditions after reconstitution.
- 6 months, -20 to -70 °C under sterile conditions after reconstitution.
Calculators
Background: GATA-6
Additional GATA-6 Products
Product Documents for Human GATA‑6 Antibody
Certificate of Analysis
To download a Certificate of Analysis, please enter a lot or batch number in the search box below.
Note: Certificate of Analysis not available for kit components.
Product Specific Notices for Human GATA‑6 Antibody
For research use only
Citations for Human GATA‑6 Antibody
 Powered by Bioz
Customer Reviews for Human GATA‑6 Antibody (8)
4.3 out of 5
8 Customer Ratings
Have you used Human GATA‑6 Antibody?
Submit a review and receive an Amazon gift card!
$25/€18/£15/$25CAN/¥2500 Yen for a review with an image
$10/€7/£6/$10CAN/¥1110 Yen for a review without an image
Submit a review
Customer Images
Showing
1
-
5 of
8 reviews
Showing All
Filter By:
-
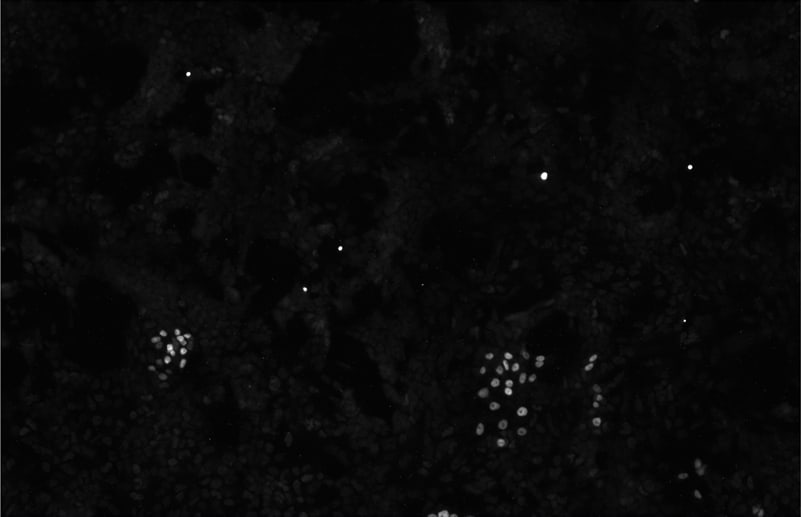
Application: ImmunohistochemistrySample Tested: Adult pancreasSpecies: MouseVerified Customer | Posted 10/25/2018Paraffin embedded tissue Antibody dilution 1:1000

-
Application: ImmunocytochemistrySample Tested: R1 wild type Mouse embryonic Stem CellsSpecies: MouseVerified Customer | Posted 08/04/2016Gata6 in R1 wild type mouse embryonic stem cells
-
Application: Immunocytochemistry/ImmunofluorescenceSample Tested: E4.5 mouse embryoSpecies: MouseVerified Customer | Posted 10/26/2015Specificity: Specific<br />Sensitivity: Sensitive<br />Buffer: PBST<br />Dilution: 1/500
-
Application: Immunohistochemistry-ParaffinSample Tested: See PMID 23002247Species: MouseVerified Customer | Posted 01/05/2015
-
Application: Immunohistochemistry-ParaffinSample Tested: See PMID 22733991Species: MouseVerified Customer | Posted 01/05/2015
-
Application: ImmunofluorescenceSample Tested: See PMID 22733991Species: MouseVerified Customer | Posted 01/05/2015
-
Application: Chromatin ImmunoprecipitationSample Tested: See PMID 23002247Species: MouseVerified Customer | Posted 01/05/2015
-
Application: ImmunofluorescenceSample Tested: See PMID 20826529Species: MouseVerified Customer | Posted 01/05/2015
There are no reviews that match your criteria.
Protocols
Find general support by application which include: protocols, troubleshooting, illustrated assays, videos and webinars.
- Antigen Retrieval Protocol (PIER)
- Antigen Retrieval for Frozen Sections Protocol
- Appropriate Fixation of IHC/ICC Samples
- Cellular Response to Hypoxia Protocols
- ChIP Protocol Video
- Chromatin Immunoprecipitation (ChIP) Protocol
- Chromatin Immunoprecipitation Protocol
- Chromogenic IHC Staining of Formalin-Fixed Paraffin-Embedded (FFPE) Tissue Protocol
- Chromogenic Immunohistochemistry Staining of Frozen Tissue
- ClariTSA™ Fluorophore Kits
- Detection & Visualization of Antibody Binding
- Fluorescent IHC Staining of Frozen Tissue Protocol
- Graphic Protocol for Heat-induced Epitope Retrieval
- Graphic Protocol for the Preparation and Fluorescent IHC Staining of Frozen Tissue Sections
- Graphic Protocol for the Preparation and Fluorescent IHC Staining of Paraffin-embedded Tissue Sections
- Graphic Protocol for the Preparation of Gelatin-coated Slides for Histological Tissue Sections
- ICC Cell Smear Protocol for Suspension Cells
- ICC Immunocytochemistry Protocol Videos
- ICC for Adherent Cells
- IHC Sample Preparation (Frozen sections vs Paraffin)
- Immunocytochemistry (ICC) Protocol
- Immunocytochemistry Troubleshooting
- Immunofluorescence of Organoids Embedded in Cultrex Basement Membrane Extract
- Immunofluorescent IHC Staining of Formalin-Fixed Paraffin-Embedded (FFPE) Tissue Protocol
- Immunohistochemistry (IHC) and Immunocytochemistry (ICC) Protocols
- Immunohistochemistry Frozen Troubleshooting
- Immunohistochemistry Paraffin Troubleshooting
- Preparing Samples for IHC/ICC Experiments
- Preventing Non-Specific Staining (Non-Specific Binding)
- Primary Antibody Selection & Optimization
- Protocol for Heat-Induced Epitope Retrieval (HIER)
- Protocol for Making a 4% Formaldehyde Solution in PBS
- Protocol for VisUCyte™ HRP Polymer Detection Reagent
- Protocol for the Fluorescent ICC Staining of Cell Smears - Graphic
- Protocol for the Fluorescent ICC Staining of Cultured Cells on Coverslips - Graphic
- Protocol for the Preparation & Fixation of Cells on Coverslips
- Protocol for the Preparation and Chromogenic IHC Staining of Frozen Tissue Sections
- Protocol for the Preparation and Chromogenic IHC Staining of Frozen Tissue Sections - Graphic
- Protocol for the Preparation and Chromogenic IHC Staining of Paraffin-embedded Tissue Sections
- Protocol for the Preparation and Chromogenic IHC Staining of Paraffin-embedded Tissue Sections - Graphic
- Protocol for the Preparation and Fluorescent ICC Staining of Cells on Coverslips
- Protocol for the Preparation and Fluorescent ICC Staining of Non-adherent Cells
- Protocol for the Preparation and Fluorescent ICC Staining of Stem Cells on Coverslips
- Protocol for the Preparation and Fluorescent IHC Staining of Frozen Tissue Sections
- Protocol for the Preparation and Fluorescent IHC Staining of Paraffin-embedded Tissue Sections
- Protocol for the Preparation of Gelatin-coated Slides for Histological Tissue Sections
- Protocol for the Preparation of a Cell Smear for Non-adherent Cell ICC - Graphic
- R&D Systems Quality Control Western Blot Protocol
- TUNEL and Active Caspase-3 Detection by IHC/ICC Protocol
- The Importance of IHC/ICC Controls
- Troubleshooting Guide: Immunohistochemistry
- Troubleshooting Guide: Western Blot Figures
- Western Blot Conditions
- Western Blot Protocol
- Western Blot Protocol for Cell Lysates
- Western Blot Troubleshooting
- Western Blot Troubleshooting Guide
- View all Protocols, Troubleshooting, Illustrated assays and Webinars
Loading...