
Key Product Details
Validated by
Knockout/Knockdown, Biological Validation
Species Reactivity
Validated:
Human, Mouse, Rat
Cited:
Human, Mouse, Rat, Transgenic Mouse
Applications
Validated:
Knockout Validated, Western Blot, Immunocytochemistry, Simple Western, Immunoprecipitation, Chromatin Immunoprecipitation (ChIP)
Cited:
Immunohistochemistry, Immunohistochemistry-Paraffin, Western Blot, Flow Cytometry, Immunocytochemistry, Simple Western
Label
Unconjugated
Antibody Source
Polyclonal Goat IgG
Loading...
Product Specifications
Immunogen
E. coli-derived recombinant human p53
Asp7-Asp393
Accession # P04637
Asp7-Asp393
Accession # P04637
Specificity
Detects human, mouse, and rat p53.
Clonality
Polyclonal
Host
Goat
Isotype
IgG
Scientific Data Images for p53 Antibody
Detection of Human p53 by Western Blot.
Western blot shows lysates of CEM human T-lymphoblastoid cell line and MCF-7 human breast cancer cell line were mock-treated (-) or exposed (+) to 10 Gy ionizing radiation (IR) and harvested after 1 hour. PVDF membrane was probed with 0.5 µg/mL of Goat Anti-Human/Mouse/Rat p53 Antigen Affinity-purified Polyclonal Antibody (Catalog # AF1355), followed by HRP-conjugated Anti-Goat IgG Secondary Antibody (Catalog # HAF109). A specific band was detected for p53 at approximately 53 kDa (as indicated). This experiment was conducted under reducing conditions and using Immunoblot Buffer Group 1.
Detection of p53-regulated Genes by Chromatin Immunoprecipitation.
MCF-7 human breast cancer cell line treated with 300 nM camptothecin overnight were fixed using formaldehyde, resuspended in lysis buffer, and sonicated to shear chromatin. p53/DNA complexes were immunoprecipitated using 5 µg Goat Anti-Human/Mouse/Rat p53 Antigen Affinity-purified Polyclonal Antibody (Catalog # AF1355) or control antibody (Catalog # AB-108-C) for 15 minutes in an ultrasonic bath, followed by Biotinylated Anti-Goat IgG Secondary Antibody (Catalog # BAF109). Immunocomplexes were captured using 50 µL of MagCellect Streptavidin Ferrofluid (Catalog # MAG999) and DNA was purified using chelating resin solution. The p21 promoter was detected by standard PCR.
p53 in HeLa Human Cell Line.
p53 was detected in immersion fixed HeLa human cervical epithelial carcinoma cell line using Goat Anti-Human/Mouse/Rat p53 Antigen Affinity-purified Polyclonal Antibody (Catalog # AF1355) at 1.7 µg/mL for 3 hours at room temperature. Cells were stained using the NorthernLights™ 557-conjugated Anti-Goat IgG Secondary Antibody (red; Catalog # NL001) and counterstained with DAPI (blue). Specific staining was localized to nuclei. View our protocol for Fluorescent ICC Staining of Cells on Coverslips.
Detection of Human p53 by Simple WesternTM.
Simple Western lane view shows lysates of CEM human T-lymphoblastoid cell line and HEK293T human embryonic kidney cell line, loaded at 0.2 mg/mL. A specific band was detected for p53 at approximately 59 kDa (as indicated) using 2.5 µg/mL of Goat Anti-Human/Mouse/Rat p53 Antigen Affinity-purified Polyclonal Antibody (Catalog # AF1355) followed by 1:50 dilution of HRP-conjugated Anti-Goat IgG Secondary Antibody (Catalog # HAF109). This experiment was conducted under reducing conditions and using the 12-230 kDa separation system.
Western Blot Shows Human p53 Specificity by Using Knockout Cell Line.
Western blot shows lysates of HeLa human cervical epithelial carcinoma parental cell line and p53 knockout HeLa cell line (KO). PVDF membrane was probed with 0.25 µg/mL of Goat Anti-Human/Mouse/Rat p53 Antigen Affinity-purified Polyclonal Antibody (Catalog # AF1355) followed by HRP-conjugated Anti-Goat IgG Secondary Antibody (Catalog # HAF017). A specific band was detected for p53 at approximately 53 kDa (as indicated) in the parental HeLa cell line, but is not detectable in knockout HeLa cell line. GAPDH (Catalog # AF5718) is shown as a loading control.This experiment was conducted under reducing conditions and using Immunoblot Buffer Group 1.
Detection of Human p53 by Knockdown Validated
Overexpression of Survivin in glioma cells affects cell cycle and proliferation in a p53 dependent manner. a Western blot analysis showing cell lysates from U87-MG and U87-MGshp53 after transduction with Survivin and control vectors. The membranes were blotted with anti-p53 (53 kDa), anti-p53s15 (53 kDa), anti-p21waf/cip (21 kDa), anti-gamma H2AX (16 kDa), anti-cyclin D1 (37 kDa) and E (42 kDa singlets +50 kDa doublets) antibodies and the signals comparing control and Survivin cells were measured. The relative band density (fold increase) obtained from the densitometric analysis and normalized to the corresponding control is depicted. alpha -actin (42 kDa) was used as an internal loading control. b Representative BrdU-incorporation assays of U87-MG (left panel) and U87-MGshp53 cells (right panel) with overexpression of Survivin (bottom) compared to the empty vector-transduced controls (top). The overall amount of BrdU-positive fractions as well as the relative levels of BrdU+ and BrdU− cells in fractions with DNA contents of 2n, 4n, 8n and >8n are depicted. c Proliferation index of the U87-MG and U87-MGshp53 cells transduced with Survivin and empty vector controls. Depicted are mean values ± SD. **p < 0.01. d BrdU-incorporation in U87-MG and U87-MGshp53 cell fractions with DNA content >4n. Depicted are mean values ± SD. **p < 0.01. All data were collected 72 h after transduction of cells Image collected and cropped by CiteAb from the following publication (https://bmccancer.biomedcentral.com/articles/10.1186/s12885-017-3932-y), licensed under a CC-BY license. Not internally tested by R&D Systems.
Detection of p53 by Western Blot
Normal human lung fibroblasts and A549 cells acquire a senescent phenotype after ZNF365 silencing. Senescence-associated beta galactosidase activity (SA-beta Gal) staining photomicrograph of normal human lung fibroblasts (A) and A549 epithelial cells (C) transfected with scrambled control sequences “SCRAM” or with specific siRNA sequences for ZNF365 “siZNF” (Scale bar 100 μm). (B,D), Percentage of positive SA-beta Gal staining. Western blot analysis of senescent markers in ZNF365 silenced normal human lung fibroblasts (E) and A549 cells (F); beta actin was used as the internal loading control. Densitometric analyses are shown. (B,D) graphics represent the mean ± SD of one experiment with two technical replicates and ten random bright microscopic fields counted for each replicate. *** p < 0.001 by a two-tailed Student’s t-test with Welch’s correction. Image collected and cropped by CiteAb from the following open publication (https://pubmed.ncbi.nlm.nih.gov/36139424), licensed under a CC-BY license. Not internally tested by R&D Systems.
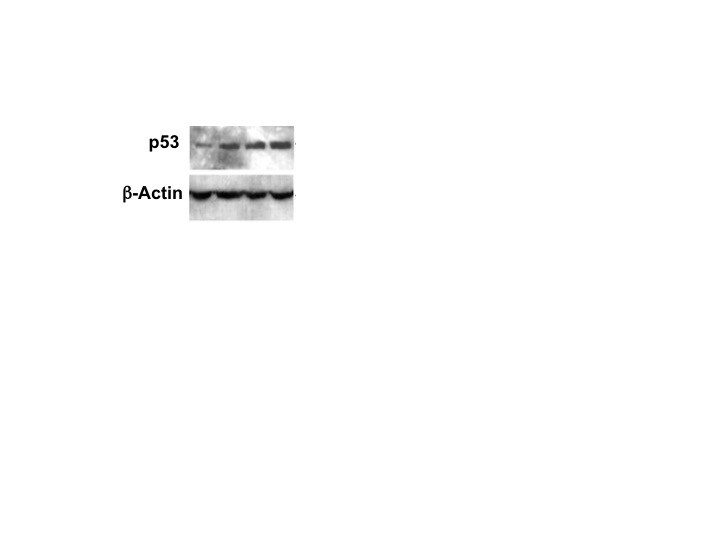
Detection of p53 by Western Blot
GH is induced in different senescence models & is a SASP component. (a) Oncogene‐induced senescence. WB of hNCC infected with lentivirus‐expressing, constitutively activated mutant V‐12HRAS oncogene (lentiV‐12HRAS) or empty vector (lenti‐CMV) & analyzed 7 days later. (b) DNA damage‐induced senescence. WB of hNCC exposed to indicated doses of UVC light or left untreated (NT) & analyzed 6 days later. (c) Replicative senescence. WB of hNCC passaged until proliferation was significantly reduced. from Passage 8 (p.8) & Passage 61 (p.61) compared. (d) WB of senescence markers in hNCC treated with DMSO (control) or 50 μM etoposide for 48 h & analyzed 7 days after beginning treatment. (e) Representative images of hNCC treated with DMSO (Control) or with 50 μM etoposide for 48 h & stained for SA‐ beta ‐gal (blue) & GH (brown) 6 days after beginning treatment. Note that only senescent express GH. Scale bar = 20 μm. (f, g) hNCC infected with lentivirus expressing shScr as control or shGH, treated with 50 μM etoposide (Etop) or DMSO (C) for 48 h, & analyzed 6 days after beginning treatment. (f) WB of cell GH & senescent marker expression. (g) WB of secreted GH in culture medium (in duplicate). EM, empty medium. Medium concentration was equalized according to cell number in wells. Ponceau was used as a loading control. (h) WB of GH & senescence markers & (i) real‐time PCR of GH in human fibroblasts derived from indicated progeroid syndrome patients & healthy volunteers as controls (C). AT, ataxia telangiectasia; CS, Cockayne syndrome; CSB, Cockayne syndrome group B; HGPS, Hutchinson–Gilford progeroid syndrome; XP, xeroderma pigmentosa. ImageJ quantification of WBs is depicted in Figure S1A & S2A,B,D,E. In a–d, f, & g, representative blots from at least three independent experiments are shown. Image collected & cropped by CiteAb from the following open publication (https://pubmed.ncbi.nlm.nih.gov/38724466), licensed under a CC-BY license. Not internally tested by R&D Systems.
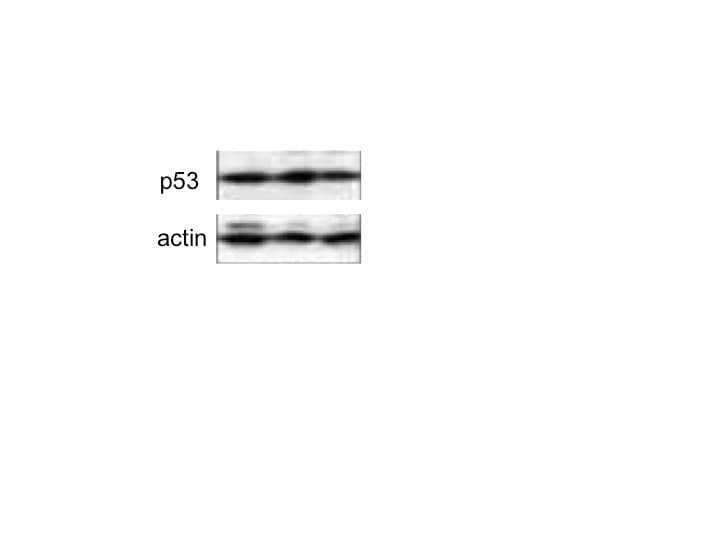
Detection of p53 by Western Blot
Chemotherapeutic drugs DOX and PTX increase WT1 levels in CAFs and enhance their ability to inhibit T cell proliferation. A Schematic overview of drug treatment, co-culture of CAFs and PBMCs followed by T cell proliferation assay. B Protein expression of WT1 and p53 in CAFs following DOX and PTX treatment was determined by Western blotting. GAPDH was used as a loading control. C Protein levels of STAT1, STAT3, PD-L1 levels. IDO release from DOX and PTX treated CAFs was determined by ELISA. D DOX treated CAFs were co-cultured with PBMCs and CFSE-labelled CD4+ and CD8+ T cell proliferation was determined by flow cytometry (E) PTX treated CAFs were co-cultured with PBMCs and CFSE-labelled CD4+ and CD8.+ T cell proliferation was determined by flow cytometry. Representative experiment is shown of n = 3 biological replicates. Data are mean ± SEM; * P < 0.05, ** P < 0.01, *** P < 0.001, and **** P < 0.0001 Image collected and cropped by CiteAb from the following open publication (https://pubmed.ncbi.nlm.nih.gov/40598415), licensed under a CC-BY license. Not internally tested by R&D Systems.Applications for p53 Antibody
Application
Recommended Usage
Chromatin Immunoprecipitation (ChIP)
5 µg/5 x 106 cells
Sample: Camptothecin treated MCF‑7 human breast cancer cell line chromatin, p21 promoter detected by standard PCR.
Sample: Camptothecin treated MCF‑7 human breast cancer cell line chromatin, p21 promoter detected by standard PCR.
Immunocytochemistry
5-15 µg/mL
Sample: Immersion fixed HeLa human cervical epithelial carcinoma cell line
Sample: Immersion fixed HeLa human cervical epithelial carcinoma cell line
Immunoprecipitation
1-2 µg/500 µg cell lysate
Sample: CEM human T-lymphoblastoid cell line, see our available Western blot detection antibodies
Sample: CEM human T-lymphoblastoid cell line, see our available Western blot detection antibodies
Knockout Validated
p53 is specifically detected in HeLa human
cervical epithelial carcinoma parental cell line but is not detectable in
p53 knockout HeLa cell line.
Simple Western
2.5 µg/mL
Sample: CEM human T-lymphoblastoid cell line and HEK293T human embryonic kidney cell line
Sample: CEM human T-lymphoblastoid cell line and HEK293T human embryonic kidney cell line
Western Blot
0.25 µg/mL
Sample: CEM human T‑lymphoblastoid cell line and ionizing radiation-treated MCF‑7 human breast cancer cell line
Sample: CEM human T‑lymphoblastoid cell line and ionizing radiation-treated MCF‑7 human breast cancer cell line
Reviewed Applications
Read 4 reviews rated 4.8 using AF1355 in the following applications:
Formulation, Preparation, and Storage
Purification
Antigen Affinity-purified
Reconstitution
Reconstitute at 0.2 mg/mL in sterile PBS. For liquid material, refer to CoA for concentration.
Loading...
Formulation
Lyophilized from a 0.2 μm filtered solution in PBS with Trehalose. *Small pack size (SP) is supplied either lyophilized or as a 0.2 µm filtered solution in PBS.
Shipping
Lyophilized product is shipped at ambient temperature. Liquid small pack size (-SP) is shipped with polar packs. Upon receipt, store immediately at the temperature recommended below.
Stability & Storage
Use a manual defrost freezer and avoid repeated freeze-thaw cycles.
- 12 months from date of receipt, -20 to -70 °C as supplied.
- 1 month, 2 to 8 °C under sterile conditions after reconstitution.
- 6 months, -20 to -70 °C under sterile conditions after reconstitution.
Calculators
Background: p53
Alternate Names
BCC7, LFS1, TP53, TRP53
Gene Symbol
TP53
UniProt
Additional p53 Products
Product Documents for p53 Antibody
Certificate of Analysis
To download a Certificate of Analysis, please enter a lot or batch number in the search box below.
Note: Certificate of Analysis not available for kit components.
Product Specific Notices for p53 Antibody
For research use only
Citations for p53 Antibody
 Powered by Bioz
Customer Reviews for p53 Antibody (4)
4.8 out of 5
4 Customer Ratings
Have you used p53 Antibody?
Submit a review and receive an Amazon gift card!
$25/€18/£15/$25CAN/¥2500 Yen for a review with an image
$10/€7/£6/$10CAN/¥1110 Yen for a review without an image
Submit a review
Customer Images
Showing
1
-
4 of
4 reviews
Showing All
Filter By:
-
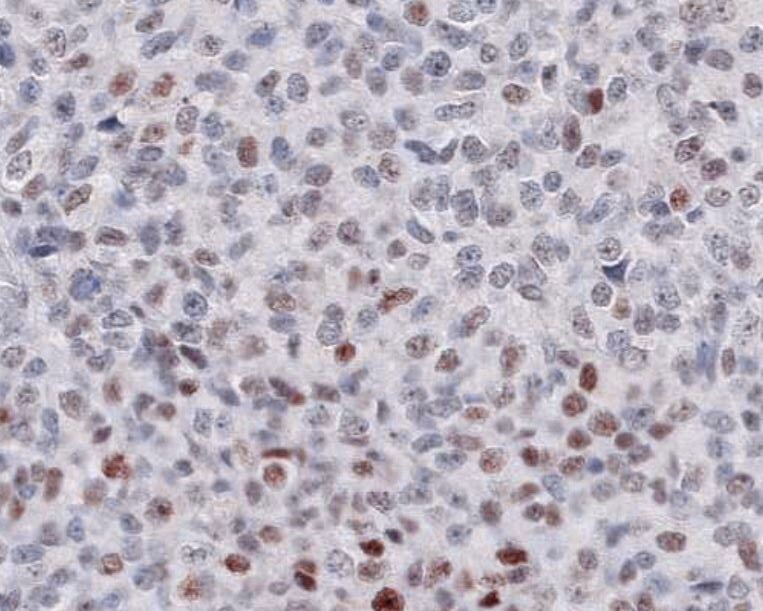
Application: ImmunohistochemistrySample Tested: Melanoma tissueSpecies: HumanVerified Customer | Posted 11/12/2021

-
Application: Western BlotSample Tested: 4T1 mouse breast cancer cell lineSpecies: MouseVerified Customer | Posted 01/17/2018
-
Application: Western BlotSample Tested: PANC-1 human pancreatic carcinoma cell lineSpecies: HumanVerified Customer | Posted 01/12/2018
-
Application: Western BlotSample Tested: See PMID 24886358Species: HumanVerified Customer | Posted 01/05/2015
There are no reviews that match your criteria.
Protocols
Find general support by application which include: protocols, troubleshooting, illustrated assays, videos and webinars.
- Appropriate Fixation of IHC/ICC Samples
- Cellular Response to Hypoxia Protocols
- ChIP Protocol Video
- Chromatin Immunoprecipitation (ChIP) Protocol
- Chromatin Immunoprecipitation Protocol
- ClariTSA™ Fluorophore Kits
- Detection & Visualization of Antibody Binding
- ICC Cell Smear Protocol for Suspension Cells
- ICC Immunocytochemistry Protocol Videos
- ICC for Adherent Cells
- Immunocytochemistry (ICC) Protocol
- Immunocytochemistry Troubleshooting
- Immunofluorescence of Organoids Embedded in Cultrex Basement Membrane Extract
- Immunohistochemistry (IHC) and Immunocytochemistry (ICC) Protocols
- Immunoprecipitation Protocol
- Preparing Samples for IHC/ICC Experiments
- Preventing Non-Specific Staining (Non-Specific Binding)
- Primary Antibody Selection & Optimization
- Protocol for VisUCyte™ HRP Polymer Detection Reagent
- Protocol for the Fluorescent ICC Staining of Cell Smears - Graphic
- Protocol for the Fluorescent ICC Staining of Cultured Cells on Coverslips - Graphic
- Protocol for the Preparation and Fluorescent ICC Staining of Cells on Coverslips
- Protocol for the Preparation and Fluorescent ICC Staining of Non-adherent Cells
- Protocol for the Preparation and Fluorescent ICC Staining of Stem Cells on Coverslips
- Protocol for the Preparation of a Cell Smear for Non-adherent Cell ICC - Graphic
- R&D Systems Quality Control Western Blot Protocol
- TUNEL and Active Caspase-3 Detection by IHC/ICC Protocol
- The Importance of IHC/ICC Controls
- Troubleshooting Guide: Western Blot Figures
- Western Blot Conditions
- Western Blot Protocol
- Western Blot Protocol for Cell Lysates
- Western Blot Troubleshooting
- Western Blot Troubleshooting Guide
- View all Protocols, Troubleshooting, Illustrated assays and Webinars
Loading...
Associated Pathways


