FABP-4 (fatty acid binding protein-4; also Adipocyte-type FABP, ALBP and aP2) is a 14-15 kDa member of the fatty acid binding protein family, calycin superfamily of molecules. It is expressed by adipocytes, macrophages, monocyte-derived DC and myoepithelial cells, and is known to serve as a carrier for select PPAR gamma fatty acid ligands as they enter the nucleus. These ligands, or fatty acids, facilitate PPAR gamma -mediated gene transcription. Mouse FABP-4 is 132 amino acids (aa) in length. It is a two beta -sheet molecule that contains an NLS (aa 22-32) and a fatty acid binding segment (aa 127-129). Mouse FABP-4 is 94% and 92% aa identical to rat and human FABP-4, respectively.

Key Product Details
Validated by
Biological Validation
Species Reactivity
Validated:
Mouse, Rat
Cited:
Human, Mouse, Rat, Transgenic Mouse, Xenograft
Applications
Validated:
Immunohistochemistry, Western Blot, Immunocytochemistry, Simple Western
Cited:
Immunohistochemistry, Immunohistochemistry-Paraffin, Immunohistochemistry-Frozen, Western Blot, Flow Cytometry, Immunocytochemistry, Immunocytochemistry/ Immunofluorescence, Immunoprecipitation
Label
Unconjugated
Antibody Source
Polyclonal Goat IgG
Loading...
Product Specifications
Immunogen
E. coli-derived recombinant mouse FABP4
Met1-Ala132
Accession # P04117
Met1-Ala132
Accession # P04117
Specificity
Detects mouse FABP4 in direct ELISAs and Western blots. In direct ELISAs, less than 5% cross-reactivity with recombinant mouse (rm) FABP5 and rmFABP9 is observed.
Clonality
Polyclonal
Host
Goat
Isotype
IgG
Scientific Data Images for FABP4/A-FABP Antibody
Detection of Mouse FABP4/A‑FABP by Western Blot.
Western blot shows lysates of mouse thymus tissue and mouse heart tissue. PVDF membrane was probed with 0.25 µg/mL of Goat Anti-Mouse/Rat FABP4/A-FABP Antigen Affinity-purified Polyclonal Antibody (Catalog # AF1443) followed by HRP-conjugated Anti-Goat IgG Secondary Antibody (Catalog # HAF019). A specific band was detected for FABP4/A-FABP at approximately 14 kDa (as indicated). This experiment was conducted under reducing conditions and using Immunoblot Buffer Group 1.
FABP4 in Mouse Adipocytes.
FABP4 was detected in immersion fixed mouse mesenchymal stem cell-derived adipocytes using 10 µg/mL Goat Anti-Mouse/Rat FABP4 Antigen Affinity-purified Polyclonal Antibody (Catalog # AF1443) for 3 hours at room temperature. Cells were stained with the NorthernLights™ 557-conjugated Anti-Goat IgG Secondary Antibody (red; Catalog # NL001) and counterstained with DAPI (blue). View our protocol for Fluorescent ICC Staining of Cells on Coverslips.
FABP4 in Rat Mesenchymal Stem Cells.
FABP4 was detected in immersion fixed rat mesenchymal stem cells differentiated to adipocytes using Goat Anti-Mouse/Rat FABP4 Antigen Affinity-purified Polyclonal Antibody (Catalog # AF1443) at 10 µg/mL for 3 hours at room temperature. Cells were stained using the NorthernLights™ 557-conjugated Anti-Goat IgG Secondary Antibody (yellow; Catalog # NL001) and counterstained with DAPI (blue). View our protocol for Fluorescent ICC Staining of Cells on Coverslips.
FABP4 in Mouse Intestine.
FABP4 was detected in perfusion fixed frozen sections of mouse intestine using Goat Anti-Mouse/Rat FABP4 Antigen Affinity-purified Polyclonal Antibody (Catalog # AF1443) at 5 µg/mL overnight at 4 °C. Tissue was stained using the Anti-Goat HRP-DAB Cell & Tissue Staining Kit (brown; Catalog # CTS008) and counterstained with hematoxylin (blue). Specific labeling was localized to the plasma membrane of epithelial cells in intestinal glands. View our protocol for Chromogenic IHC Staining of Frozen Tissue Sections.
Detection of Mouse FABP4/A‑FABP by Simple WesternTM.
Simple Western lane view shows lysates of mouse thymus tissue and mouse heart tissue, loaded at 0.2 mg/mL. A specific band was detected for FABP4/A-FABP at approximately 17 kDa (as indicated) using 2.5 µg/mL of Goat Anti-Mouse/Rat FABP4/A-FABP Antigen Affinity-purified Polyclonal Antibody (Catalog # AF1443) followed by 1:50 dilution of HRP-conjugated Anti-Goat IgG Secondary Antibody (Catalog # HAF109). This experiment was conducted under reducing conditions and using the 12-230 kDa separation system.
Detection of Mouse FABP4/A-FABP by Western Blot
A-FABP mediates expression of Dio2 via inhibition of LXR alpha.(a,b) BAT isolated from WT and A-FABP KO mice (a) fed with STC or HFD for 24 weeks or (b) subjected to room temperature (23 °C) or cold exposure (6 °C) for 24 h as indicated in Fig. 2 were subjected to immunoblotting using an antibody against A-FABP, type II iodothyronine deiodinase (D2), liver X receptor alpha (LXR alpha ) and beta -tubulin. The bar charts below are the band intensity of each protein relative to beta -tubulin and expressed as arbitrary units, N.D., not detected (n=6). (c,d) The mRNA abundance of A-FABP, Dio2 and LXR alpha in BAT of above WT and A-FABP KO mice (c) fed with STC or HFD for 24 weeks or (d) subjected to cold exposure (6 °C) for 24 h (n=6). (e) The mRNA abundance of A-FABP, LXR alpha and Dio2 in WT or A-FABP-deficient primary brown adipocytes incubated with PBS or recombinant A-FABP (rA-FABP, 2 μg ml−1) for 24 h (n=6). (f) The mRNA abundance of LXR alpha downstream target genes (SCD-1, SREBP-1c) and Dio2 in WT and A-FABP-deficient primary brown adipocytes treated with or without LXR alpha agonist TO901317 (TO;1 μM) and/or rA-FABP (2 μg ml−1) for 24 h (n=6). Uncropped western blot images are shown in Supplementary Fig. 13. Data are represented as mean±s.e.m. *P<0.05, **P<0.01 (One-way analysis of variance with Bonferroni correction for multiple comparisons). Image collected and cropped by CiteAb from the following open publication (https://pubmed.ncbi.nlm.nih.gov/28128199), licensed under a CC-BY license. Not internally tested by R&D Systems.
Detection of Mouse FABP4/A-FABP by Western Blot
A-FABP accelerates proteasomal degradation of LXR alpha.(a) Primary adipocytes derived from male 6-week-old A-FABP KO mice or WT littermates were treated with actinomycin D (actD, 1 μg ml−1) or vehicle (PBS). The mRNA level of LXR alpha was determined by real-time PCR at time points as indicated (n=4). (b,c) Primary brown adipocytes derived from male 6-week-old A-FABP KO mice or WT littermates were treated with (b) cycloheximide (CHX, 50 μg ml−1) or (c) CHX (50 μg ml−1) together with MG132 (10 μM) for different periods were subjected to immunoblotting using an antibody against LXR alpha, A-FABP and GADPH as indicated (n=4). (d) Primary brown adipocytes derived male 6-week-old A-FABP KO mice or WT littermates were infected with adenovirus overexpressing A-FABP (Ad-AFABP) or luciferase (Ad-Luci) for 48 h, followed by treatment with CHX (50 μg ml−1) for 0,6,12 and 24 h, and then subjected to immunoblotting using an antibody against LXR alpha, A-FABP and GADPH as indicated (n=4). The right panel is the band intensity of LXR alpha normalized with GAPDH, and expressed as percentage relative to baseline (0 h). Uncropped western blot images are shown in Supplementary Fig. 14. Data are represented as mean±s.e.m. *P<0.05, **P<0.01 (Students' t-test). Image collected and cropped by CiteAb from the following open publication (https://pubmed.ncbi.nlm.nih.gov/28128199), licensed under a CC-BY license. Not internally tested by R&D Systems.
Detection of Mouse FABP4/A-FABP by Western Blot
NPGPx is a suppressor of adipogenesis via ROS regulationRelative NPGPx expression assayed by qRT-PCR (left panel) and Western blots (right panel) in the stromal vascular fraction (SVF) and adipocyte fraction isolated from the gonadal fat of C57BL/6 mice (n = 3 per group).Relative NPGPx expression in preadipocytes (Lin−CD34+CD29+Sca1+), endothelial cells (CD31+), macrophages (CD11b+) and adipocytes of adipose tissue measured by in C57BL/6 mice (n = 3 per group).NPGPx, CCAAT/enhancer-binding protein beta (C/EBP beta ) and peroxisome proliferator-activated receptor gamma (PPAR gamma ) mRNA level during induced 3T3-L1 adipogenesis (n = 5 per group).NPGPx expression assayed by Western blots during 3T3L1 adipogenesis.NBT reduction staining of wild-type SVF cells (WT), NPGPx-knockout SVF cells (KO) and NPGPx-knockout SVF cells expressing human NPGPx (KO + hNPGPx) (left panels). Quantification of NBT reduction stains 8 days after induction (n = 3 per group) (right panels). *p = 0.0002 for WT vs. KO by independent Student's t-test.Oil Red O stain of WT, KO and KO + hNPGPx SVF (left panels). Quantification of Oil Red O stain 8 days after induction (n = 3 per group) (right panels). *p = 0.0002 for WT vs. KO by independent Student's t-test.Western blots showing ap2 and adiponectin expression in WT, KO and KO + hNPGPx SVF cells 8 days after induction.NBT reduction stain of NPGPx knockdown (KD) and control (V) 3T3-L1 preadipocytes after adipogenic induction (left panels). Quantification of NBT reduction stain at day 8 (n = 3 per group) (right panels). *p = 0.0004 by independent Student's t-test.Oil Red O staining of KD and V 3T3-L1 preadipocytes after adipogenic induction (left panels). Quantification of Oil Red O stain at day 8 (n = 3 per group) (right panels). *p = 0.0005 by independent Student's t-test.Western blots showing ap2 and adiponectin expression in NPGPx KD and V 3T3-L1 preadipocytes after adipogenic stimulation.NBT reduction stain and Oil Red O stain of NPGPx KD and V 3T3-L1 cells 8 d
Detection of Mouse FABP4/A-FABP by Western Blot
A-FABP mediates expression of Dio2 via inhibition of LXR alpha.(a,b) BAT isolated from WT and A-FABP KO mice (a) fed with STC or HFD for 24 weeks or (b) subjected to room temperature (23 °C) or cold exposure (6 °C) for 24 h as indicated in Fig. 2 were subjected to immunoblotting using an antibody against A-FABP, type II iodothyronine deiodinase (D2), liver X receptor alpha (LXR alpha ) and beta -tubulin. The bar charts below are the band intensity of each protein relative to beta -tubulin and expressed as arbitrary units, N.D., not detected (n=6). (c,d) The mRNA abundance of A-FABP, Dio2 and LXR alpha in BAT of above WT and A-FABP KO mice (c) fed with STC or HFD for 24 weeks or (d) subjected to cold exposure (6 °C) for 24 h (n=6). (e) The mRNA abundance of A-FABP, LXR alpha and Dio2 in WT or A-FABP-deficient primary brown adipocytes incubated with PBS or recombinant A-FABP (rA-FABP, 2 μg ml−1) for 24 h (n=6). (f) The mRNA abundance of LXR alpha downstream target genes (SCD-1, SREBP-1c) and Dio2 in WT and A-FABP-deficient primary brown adipocytes treated with or without LXR alpha agonist TO901317 (TO;1 μM) and/or rA-FABP (2 μg ml−1) for 24 h (n=6). Uncropped western blot images are shown in Supplementary Fig. 13. Data are represented as mean±s.e.m. *P<0.05, **P<0.01 (One-way analysis of variance with Bonferroni correction for multiple comparisons). Image collected and cropped by CiteAb from the following open publication (https://pubmed.ncbi.nlm.nih.gov/28128199), licensed under a CC-BY license. Not internally tested by R&D Systems.
Detection of Mouse FABP4/A-FABP by Western Blot
Circulating A-FABP facilitates the uptake of free fatty acid into adipocytes.(a) Circulating A-FABP and (b) FFA profile of male 4-week-old C57BL/6N mice fed with HFD for 24 weeks (n=8). (c) Circulating A-FABP and (d) FFA level of male 8-week-old C57BL/6N mice during cold exposure (6 °C) for 4 h (n=8). (e) Circulating A-FABP and (f) FFA level of male 8-week-old C57BL/6N mice intraperitoneally injected with norepinephrine (NE; 1 mg kg−1) or PBS (vehicle) for 4 h under fasting condition (n=6). (g) Co-immunoprecipitation (Co-IP) of A-FABP and 3H-palmitate in serum of male 8-week-old C57BL/6N mice after administration of 3H-palmitate (2 μCi) for 4 h. Right panel is the 3H-palmitate radioactivity of the co-immunoprecipitated A-FABP protein (n=6). (h,i) 3H-palmitate uptake in BAT and WAT of 8-week-old A-FABP KO mice and their WT littermates infused with PBS or (h) recombinant A-FABP (rA-FABP; 1 μg h−1) or (i) mutant R126Q (1 μg h−1) (n=6). (j) BODIPY-FA uptake in WT or A-FABP-deficient brown adipocytes treated with PBS or rA-FABP (2 μg ml−1) for 10 min (min) (n=6). (k) 3H-palmitate uptake in A-FABP-deficient adipocytes incubated with PBS, bovine serum albumin (BSA; 3 μg ml−1) or rA-FABP (2 μg ml−1) (n=6). (l) In vitro fluorescent imaging analysis of brown adipocytes treated with BODIPY-FA (2 μM) with or without pre-incubation with fluorescent-labelled rA-FABP (2 μg ml−1). Images were taken at 5, 10 and 30 min after treatment. Control image was taken at 30 min in which A-FABP-deficient brown adipocytes were incubated with BODIPY-FA without pre-incubation with rA-FABP. Scale bar, 20 μm, with magnification of 400 ×. Representative images from three independent experiments are shown (n=6). (m) Oxygen consumption rate (OCR) and its mean value (lower panel) of A-FABP-deficient brown adipocytes treated with palmitate (PA: 200 nM) with or without pre-incubation with rA-FABP (2 μg ml−1) (n=6). CPMA, count per minutes for beta particles; RFU, relative fluorescence units; OCR, oxyge
Detection of Mouse FABP4/A-FABP by Western Blot
NPGPx is a suppressor of adipogenesis via ROS regulationRelative NPGPx expression assayed by qRT-PCR (left panel) and Western blots (right panel) in the stromal vascular fraction (SVF) and adipocyte fraction isolated from the gonadal fat of C57BL/6 mice (n = 3 per group).Relative NPGPx expression in preadipocytes (Lin−CD34+CD29+Sca1+), endothelial cells (CD31+), macrophages (CD11b+) and adipocytes of adipose tissue measured by in C57BL/6 mice (n = 3 per group).NPGPx, CCAAT/enhancer-binding protein beta (C/EBP beta ) and peroxisome proliferator-activated receptor gamma (PPAR gamma ) mRNA level during induced 3T3-L1 adipogenesis (n = 5 per group).NPGPx expression assayed by Western blots during 3T3L1 adipogenesis.NBT reduction staining of wild-type SVF cells (WT), NPGPx-knockout SVF cells (KO) and NPGPx-knockout SVF cells expressing human NPGPx (KO + hNPGPx) (left panels). Quantification of NBT reduction stains 8 days after induction (n = 3 per group) (right panels). *p = 0.0002 for WT vs. KO by independent Student's t-test.Oil Red O stain of WT, KO and KO + hNPGPx SVF (left panels). Quantification of Oil Red O stain 8 days after induction (n = 3 per group) (right panels). *p = 0.0002 for WT vs. KO by independent Student's t-test.Western blots showing ap2 and adiponectin expression in WT, KO and KO + hNPGPx SVF cells 8 days after induction.NBT reduction stain of NPGPx knockdown (KD) and control (V) 3T3-L1 preadipocytes after adipogenic induction (left panels). Quantification of NBT reduction stain at day 8 (n = 3 per group) (right panels). *p = 0.0004 by independent Student's t-test.Oil Red O staining of KD and V 3T3-L1 preadipocytes after adipogenic induction (left panels). Quantification of Oil Red O stain at day 8 (n = 3 per group) (right panels). *p = 0.0005 by independent Student's t-test.Western blots showing ap2 and adiponectin expression in NPGPx KD and V 3T3-L1 preadipocytes after adipogenic stimulation.NBT reduction stain and Oil Red O stain of NPGPx KD and V 3T3-L1 cells 8 d
Detection of Mouse FABP4/A-FABP by Western Blot
A-FABP accelerates proteasomal degradation of LXR alpha.(a) Primary adipocytes derived from male 6-week-old A-FABP KO mice or WT littermates were treated with actinomycin D (actD, 1 μg ml−1) or vehicle (PBS). The mRNA level of LXR alpha was determined by real-time PCR at time points as indicated (n=4). (b,c) Primary brown adipocytes derived from male 6-week-old A-FABP KO mice or WT littermates were treated with (b) cycloheximide (CHX, 50 μg ml−1) or (c) CHX (50 μg ml−1) together with MG132 (10 μM) for different periods were subjected to immunoblotting using an antibody against LXR alpha, A-FABP and GADPH as indicated (n=4). (d) Primary brown adipocytes derived male 6-week-old A-FABP KO mice or WT littermates were infected with adenovirus overexpressing A-FABP (Ad-AFABP) or luciferase (Ad-Luci) for 48 h, followed by treatment with CHX (50 μg ml−1) for 0,6,12 and 24 h, and then subjected to immunoblotting using an antibody against LXR alpha, A-FABP and GADPH as indicated (n=4). The right panel is the band intensity of LXR alpha normalized with GAPDH, and expressed as percentage relative to baseline (0 h). Uncropped western blot images are shown in Supplementary Fig. 14. Data are represented as mean±s.e.m. *P<0.05, **P<0.01 (Students' t-test). Image collected and cropped by CiteAb from the following open publication (https://pubmed.ncbi.nlm.nih.gov/28128199), licensed under a CC-BY license. Not internally tested by R&D Systems.
Detection of Mouse FABP4/A-FABP by Immunocytochemistry/ Immunofluorescence
Chemotherapy leads to fat loss in diet induced obese miceA. Weight of epididymal white adipose tissue (eWAT) from LFD, HFD, CY200 and MTX50 treated mice 1 week after last chemotherapy treatment. Each treatment group consisted of 6 mice, showing mean ± SD, data representative of 2 biological replicates. Comparisons by Student's t-test: ns - not significant, * p<0.02, ** p<0.004, *** p<0.002, **** p<0.0007 B. Representative illustration of abdominal cavities measured in (A), showing that large visceral fat deposits (arrows) were reduced post chemotherapy in HFD mice. C. Relative percent frequency of eWAT-associated adipocyte stem-like cells (ASC) in HFD mice treated with MTX12.5 or CY100. Each treatment group consisted of 3 mice, showing mean ± SD, data representative of 2 biological replicates. Statistics as in (A). D. Representative confocal imagery of sorted ASC cultured in adipogenic medium displaying lipid droplets. DAPI (blue)- DNA nuclear stain, FABP4 (green)- lipid transport protein in adipocytes, LipidTOX (red)- neutral lipid stain. Image collected and cropped by CiteAb from the following open publication (https://www.oncotarget.com/lookup/doi/10.18632/oncotarget.14576), licensed under a CC-BY license. Not internally tested by R&D Systems.
Detection of Porcine FABP4/A-FABP by Immunocytochemistry/ Immunofluorescence
In vitro differentiation capacity of young and old BM-MSCs: (A) Representative micrographs from each experimental group showing morphological change after 21 days of differentiation. (B) Results of adipogenic, osteogenic and chondrogenic differentiation. Representative micrographs showing anti-FABP4, Oil Red O, anti-osteocalcin, Alizarin Red-S and anti-aggrecan staining in cultured BM-MSCs from each experimental group. Image collected and cropped by CiteAb from the following open publication (https://pubmed.ncbi.nlm.nih.gov/21992089), licensed under a CC-BY license. Not internally tested by R&D Systems.
Detection of Mouse FABP4/A-FABP by Immunohistochemistry-Frozen
Pancreatic TRM cell recruitment during T1D progression is FABP4‐dependent. G) Representative images of immunofluorescent co‐staining of FABP4, CD69,&insulin in the pancreas of 10‐week‐old NOD mice (Scale bar 20 µm). Image collected & cropped by CiteAb from the following open publication (https://pubmed.ncbi.nlm.nih.gov/38884133), licensed under a CC-BY license. Not internally tested by R&D Systems.
Detection of FABP4/A-FABP by Western Blot
NPGPx is a suppressor of adipogenesis via ROS regulation. Western blots showing ap2 and adiponectin expression in NPGPx KD and V 3T3-L1 preadipocytes after adipogenic stimulation. Image collected and cropped by CiteAb from the following open publication (https://pubmed.ncbi.nlm.nih.gov/23828861), licensed under a CC-BY license. Not internally tested by R&D Systems.Applications for FABP4/A-FABP Antibody
Application
Recommended Usage
Immunocytochemistry
5-15 µg/mL
Sample: Immersion fixed mouse adipocytes and immersion fixed rat mesenchymal stem cells differentiated into adipocytes
Sample: Immersion fixed mouse adipocytes and immersion fixed rat mesenchymal stem cells differentiated into adipocytes
Immunohistochemistry
5-15 µg/mL
Sample: Perfusion fixed frozen sections of mouse intestine
Sample: Perfusion fixed frozen sections of mouse intestine
Simple Western
2.5 µg/mL
Sample: Mouse thymus tissue and mouse heart tissue
Sample: Mouse thymus tissue and mouse heart tissue
Western Blot
0.25 µg/mL
Sample: Mouse thymus tissue and mouse heart tissue
Sample: Mouse thymus tissue and mouse heart tissue
Reviewed Applications
Read 2 reviews rated 4 using AF1443 in the following applications:
Formulation, Preparation, and Storage
Purification
Antigen Affinity-purified
Reconstitution
Reconstitute at 0.2 mg/mL in sterile PBS. For liquid material, refer to CoA for concentration.
Loading...
Formulation
Lyophilized from a 0.2 μm filtered solution in PBS with Trehalose. *Small pack size (SP) is supplied either lyophilized or as a 0.2 µm filtered solution in PBS.
Shipping
Lyophilized product is shipped at ambient temperature. Liquid small pack size (-SP) is shipped with polar packs. Upon receipt, store immediately at the temperature recommended below.
Stability & Storage
Use a manual defrost freezer and avoid repeated freeze-thaw cycles.
- 12 months from date of receipt, -20 to -70 °C as supplied.
- 1 month, 2 to 8 °C under sterile conditions after reconstitution.
- 6 months, -20 to -70 °C under sterile conditions after reconstitution.
Calculators
Background: FABP4/A-FABP
Long Name
Fatty Acid-Binding Protein 4
Alternate Names
A-FABP, AFABP, aP2
Gene Symbol
FABP4
UniProt
Additional FABP4/A-FABP Products
Product Documents for FABP4/A-FABP Antibody
Certificate of Analysis
To download a Certificate of Analysis, please enter a lot or batch number in the search box below.
Note: Certificate of Analysis not available for kit components.
Product Specific Notices for FABP4/A-FABP Antibody
For research use only
Related Research Areas
Citations for FABP4/A-FABP Antibody
 Powered by Bioz
Customer Reviews for FABP4/A-FABP Antibody (2)
4 out of 5
2 Customer Ratings
Have you used FABP4/A-FABP Antibody?
Submit a review and receive an Amazon gift card!
$25/€18/£15/$25CAN/¥2500 Yen for a review with an image
$10/€7/£6/$10CAN/¥1110 Yen for a review without an image
Submit a review
Customer Images
Showing
1
-
2 of
2 reviews
Showing All
Filter By:
-
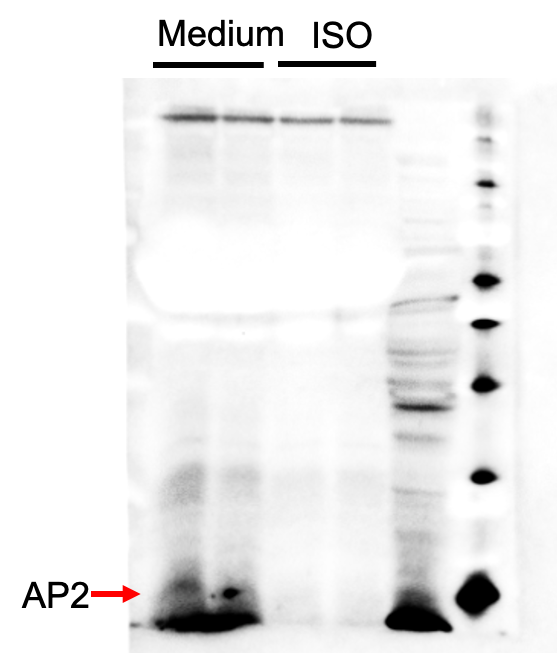
Application: Western BlotSample Tested: adipose tissue cultured mediumSpecies: MouseVerified Customer | Posted 11/03/2020n/a

-
Application: ImmunocytochemistrySample Tested: See PMID 22364878Species: RatVerified Customer | Posted 01/05/2015
There are no reviews that match your criteria.
Protocols
Find general support by application which include: protocols, troubleshooting, illustrated assays, videos and webinars.
- Antigen Retrieval Protocol (PIER)
- Antigen Retrieval for Frozen Sections Protocol
- Appropriate Fixation of IHC/ICC Samples
- Cellular Response to Hypoxia Protocols
- Chromogenic IHC Staining of Formalin-Fixed Paraffin-Embedded (FFPE) Tissue Protocol
- Chromogenic Immunohistochemistry Staining of Frozen Tissue
- ClariTSA™ Fluorophore Kits
- Detection & Visualization of Antibody Binding
- Fluorescent IHC Staining of Frozen Tissue Protocol
- Graphic Protocol for Heat-induced Epitope Retrieval
- Graphic Protocol for the Preparation and Fluorescent IHC Staining of Frozen Tissue Sections
- Graphic Protocol for the Preparation and Fluorescent IHC Staining of Paraffin-embedded Tissue Sections
- Graphic Protocol for the Preparation of Gelatin-coated Slides for Histological Tissue Sections
- ICC Cell Smear Protocol for Suspension Cells
- ICC Immunocytochemistry Protocol Videos
- ICC for Adherent Cells
- IHC Sample Preparation (Frozen sections vs Paraffin)
- Immunocytochemistry (ICC) Protocol
- Immunocytochemistry Troubleshooting
- Immunofluorescence of Organoids Embedded in Cultrex Basement Membrane Extract
- Immunofluorescent IHC Staining of Formalin-Fixed Paraffin-Embedded (FFPE) Tissue Protocol
- Immunohistochemistry (IHC) and Immunocytochemistry (ICC) Protocols
- Immunohistochemistry Frozen Troubleshooting
- Immunohistochemistry Paraffin Troubleshooting
- Preparing Samples for IHC/ICC Experiments
- Preventing Non-Specific Staining (Non-Specific Binding)
- Primary Antibody Selection & Optimization
- Protocol for Heat-Induced Epitope Retrieval (HIER)
- Protocol for Making a 4% Formaldehyde Solution in PBS
- Protocol for VisUCyte™ HRP Polymer Detection Reagent
- Protocol for the Fluorescent ICC Staining of Cell Smears - Graphic
- Protocol for the Fluorescent ICC Staining of Cultured Cells on Coverslips - Graphic
- Protocol for the Preparation & Fixation of Cells on Coverslips
- Protocol for the Preparation and Chromogenic IHC Staining of Frozen Tissue Sections
- Protocol for the Preparation and Chromogenic IHC Staining of Frozen Tissue Sections - Graphic
- Protocol for the Preparation and Chromogenic IHC Staining of Paraffin-embedded Tissue Sections
- Protocol for the Preparation and Chromogenic IHC Staining of Paraffin-embedded Tissue Sections - Graphic
- Protocol for the Preparation and Fluorescent ICC Staining of Cells on Coverslips
- Protocol for the Preparation and Fluorescent ICC Staining of Non-adherent Cells
- Protocol for the Preparation and Fluorescent ICC Staining of Stem Cells on Coverslips
- Protocol for the Preparation and Fluorescent IHC Staining of Frozen Tissue Sections
- Protocol for the Preparation and Fluorescent IHC Staining of Paraffin-embedded Tissue Sections
- Protocol for the Preparation of Gelatin-coated Slides for Histological Tissue Sections
- Protocol for the Preparation of a Cell Smear for Non-adherent Cell ICC - Graphic
- R&D Systems Quality Control Western Blot Protocol
- TUNEL and Active Caspase-3 Detection by IHC/ICC Protocol
- The Importance of IHC/ICC Controls
- Troubleshooting Guide: Immunohistochemistry
- Troubleshooting Guide: Western Blot Figures
- Western Blot Conditions
- Western Blot Protocol
- Western Blot Protocol for Cell Lysates
- Western Blot Troubleshooting
- Western Blot Troubleshooting Guide
- View all Protocols, Troubleshooting, Illustrated assays and Webinars
Loading...
Associated Pathways
